Real Time Simulation for the Study on Smart Grid
Feng Guo, Luis Herrera, Robert Murawski, Ernesto Inoa,
Chih-Lun Wang, Yi Huang, Eylem Ekici, and Jin Wang
The Ohio State UniversityColumbus, Ohio, U.S.A
Philippe Beauchamp
Opal-RT Technologies Montreal, Quebec, CanadaAbstract— This paper introduces the latest real time simulation technologies and their applications to the smart grid related studies. A real time simulation platform now built at the Ohio State University is described in detail. With the help of this platform, distributed real time simulation of complex power system integrated with high switching speed power electronics components, renewable energy resources, and communication networks can be fulfilled. Two case studies are performed to illustrate the platform. The first realizes intentional islanding and seamless transition of the smart grid during a power grid failure; the other integrates communication network and power network simulation together to explore communication and distributed control issues in the smart grid.
I. INTRODUCTION
The term “smart grid” refers to the digitalization of the modern power grid. It encompasses up-to-date technology in areas such as power electronics, renewable energy resources, and communication in order to establish a more secure, reliable, economic, and eco-friendly power network [1][2]. Due to the diversity of system topologies and large numbers of power electronics interface circuits, it is usually difficult and costly to build a test bed or pilot plant with real equipment for smart grid related research [3]. Therefore, simulation becomes a powerful and convenient tool in this research area.
The integrated power electronics devices in the smart grid introduce two great challenges to the simulation: high frequency PWM signals and large numbers of switching devices. As a result, traditional off-line simulators are time-consuming for long period simulations and not suitable to study slow phenomena [4]. Moreover, this kind of simulation usually lacks the hardware interface with real devices, thus it cannot be used at all the development stages of the smart grid, such as prototyping and testing.
As early as 20 years ago, manufactures of large thyristor-based HVDC and FACTS systems have used a digital real time simulator for power system integrated with power electronics components [5]. The digital real time simulator can run a large and complex model at the physical time, thus it is suitable to simulate a long time frame process. In addition, with the support of real time simulator, Hardware-in-the-Loop (HIL) can be utilized to test prototype controllers before implementing them into an actual system.
It can also be used to test the response of the controller and protector under severe conditions, such as overvoltage and overcurrent. However, when it comes to the simulation of smart grid, traditional real time simulators still cannot handle power electronics circuits with a large number of high frequency switches.
The requirement for real time simulation of high frequency switching devices was brought forward by the manufactures of fast power electronics devices such as Mitsubishi more than five years ago [6]. Nowadays, some of real time simulators can achieve very small simulation time step with relatively simple models. The real time simulator in [6] can run the simulation with a time step of 10 μs for one three-phase inverter. But for a system with a large number of switching devices, it becomes difficult to achieve such small time step and specific consideration is still needed. A micro grid model with two renewable energy sources and two inverters in [7] can run in real time with a switching frequency of 1 kHz, which is not quite fast.
Likewise, two-way flow of energy and information is fundamental in smart grid. For this reason, the communication network is essential in order to effectively incorporate many of the desired features of the smart grid such as distributed automated system, distributed energy resource protection, islanding, and display of network state and performance [1]. Thus, a further challenge in smart grid study is to integrate different kinds of communication networks and simulate their influence to electric power systems in real time. In [8], Nutaro et al. developed an offline software simulation of a 17 bus power network with communication between loads and generators; investigating the effects of factors such as bandwidth and latency. This work provides an example of combining discrete and continuous software to study communication requirements and its influence to a power system. In [9], a real time HIL model of a power network was implemented along with a physical network of two nodes: the real time simulation and a physical remote control center. The control center served as a means of monitoring and controlling the overall system, and testing cyber vulnerabilities of it. In sum, the importance of emulating communication network becomes apparent. An effective modeling of communication between control and protection devices along with present real time
This work is sponsored by the U.S. Department of Energy under project number DE-OE-0000402.
simulation of power networks could show more realistic results and bring great benefits to related studies in smart grid.
In this paper, an innovative platform is introduced and utilized to solve the aforementioned problems in smart grid study. In Section II, this system is introduced in detail. Section III and IV describe two case studies in order to show the effectiveness of the solution. In Section V, conclusion is presented.
II. REAL TIME SIMULATION PLATFORM INTRODUCTION
The real time simulation platform presented in this paper is based on PC technology running a Linux operating system and offers an underlying test bed for the study on smart grid. It consists of 4 target machines with a total of 8 CPUs, 48 cores, 5 Field-programmable Gate Array (FPGA) chips, and more than 500 analogue and digital inputs/outputs [10]. Dolphin [11] PCI boards are used to provide an extremely high speed and low latency real time communication link between target machines. With the technology of switch event interpolation and parallel computation [4], the switching frequency can achieve up to 10 kHz even with a large number of switching devices in a CPU based real time simulation. However, when the switching frequency exceeds 10 kHz, FPGA based simulation needs to be utilized, which is not as easy or flexible as the CPU based simulation.
Figure 1. Real time simulation platform
When combined with a discrete network emulator, the real time simulation system can provide advantages to simulating communication network and distributed control in the smart grid in a cost effective manner. Such studies would allow identification of the influence of key communication factors to the smart grid, such as protocols, latency and bandwidth requirements, cyber security, and data management [2]. As illustrated in Fig. 2, the proposed system will have a number of real time target machines which are related to the complexity of the system under test. The communication units are linked with the real time targets by an Ethernet connection. Relevant information (e.g. voltage, current, breaker status) is packaged and transferred to the control units which in turn will receive the
package and traverse the information through a virtual communication network and back.
Figure 2. Power network combined with communication network
III. CASE STUDY ONE:INTENTIONAL ISLANIDNG
A smart grid model composed of a Plug-in Hybrid Electric Vehicle (PHEV) charging station, Local Energy Storage (LES) and Photovoltaic (PV) is modeled with the proposed real time simulation system. The system schematic and the detailed circuit topology for each branch are shown in Fig. 3. The charging station can work in two modes: grid-connected mode and islanding mode.
(a) System schematic
(b) Circuit topology for each branch
Figure 3. System schematic and the detailed circuit topology.
A. Model Description
Each unit in the smart grid is modeled with detailed characteristics. The LES is modeled as recycled electric car batteries. The impedance and output voltage of LES are not only determined by the State of Charge (SOC), but also the temperature inside the LES. The PV is built with the mathematical model described in [12]. The output voltage and power of this unit are related with the irradiation and environment temperature. To make the model more realistic, a Lithium-Ion battery model is used as the load with an inverter and converter as the power conditioning circuit.
Core 1 Core 1
Real-Time Target 1 Real-Time Target 2
Core 2 Core 2
Real-Time Link (transmission line) Master
Grid Main Model
Client #1
Client #2
Network Simulator and Host 1
Network Simulator and Control Unit 2
Network Simulator and Control Unit 3
Communication Link Communication Link
Additionally, all circuit breakers in the system are modeled as solid state circuit breakers.
B. Control Strategy
The aim of the controller design is to make sure the system works properly in both grid-connected mode and islanding mode. More importantly, the controller should avoid large voltage and current spikes during the transition from grid-connected mode to islanding mode.
1) Grid-connected Mode
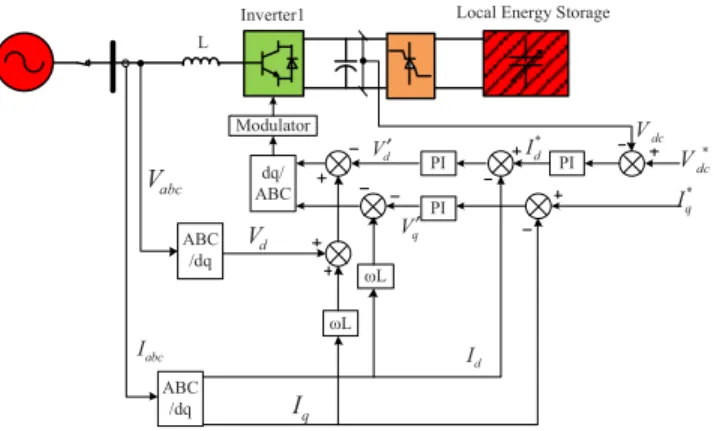
In grid connected mode, a multi-loop controller is used for all the three utility interactive inverters. The control objective of the inverters is to keep the DC-link voltage constant. The outer loop of the controller consists of a voltage loop with DC-link voltage as feedback. The inner loop is a grid current loop, with the active current reference generated by the outer voltage loop and reactive current reference set to 0, shown in Fig. 4.
Figure 4. Inverter controller during grid-connected mode.
Considering the three converters, the LES connected converter and PHEV batteries connected converter are working in current control mode while the PV connected converter is working with Maximum Power Point Tracking (MPPT) strategy.
2) Islanding Mode
In islanding mode, the inverters and converters connected to PV and PHEV still keep the same control strategy as in grid-connected mode. While for the LES-connected inverter, because of the loss of the grid, the control objective of this inverter is changed to keep the ac bus voltage constant. The same multi-loop control structure is utilized for the inverter, but with the ac bus voltage as feedback in the outer voltage loop, as illustrated in Fig. 5. The inner loop is the same current control loop as in grid-connected mode.
As mentioned above, in islanding mode, the LES-connected inverter is used to control the ac bus voltage. Therefore, the control purpose of the LES-connected converter is changed to control the DC-link voltage. Considering that the output current of the LES should also be restrictedly controlled, a multi-loop control structure with outer voltage loop and inner current loop is designed for this converter. The outer voltage control loop uses the DC-link
voltage as feedback, which will generate a reference current value for the inner control loop.
Figure 5. The controller of LES-connected inverter in islanding mode.
As shown in Fig. 4 and 5, the only difference between the grid connected and the islanding mode is that the voltage reference is changed from dc bus voltage to d axis component of the ac side voltage, thus there is no sudden controller structure change, and a seamless transfer from grid-connected mode to islanding mode can be achieved.
C. Simulation Results
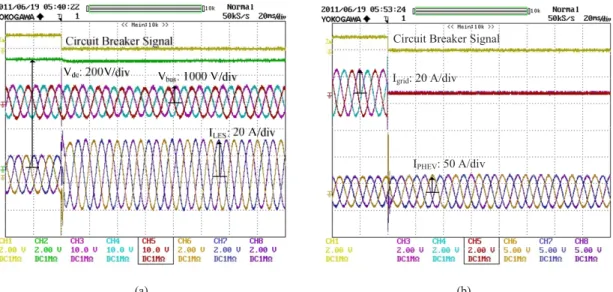
Real time simulation is performed to test control strategies for the case where the system transits from grid-connected mode to islanding mode. It is assumed that at certain time, a three phase short circuit occurs at grid side. The fault detection unit detects this failure and opens the main circuit breaker. In this case, it is assumed that during islanding mode, the LES and PV can provide enough power for PHEV battery charging. The simulation parameters are shown in Table I. Since the simulation is running at real time, the simulation results could be observed via oscilloscope. Oscillograms of the simulation results of the dc bus voltage within LES inverter system, ac bus voltage and LES output ac current are shown in Fig. 6 (a), while grid side current and PHEV charging currents are shown in Fig. 6 (b).
TABLE I. SIMULATION PARAMETERS
System Frequency f 60 Hz Switching Frequency fsw 10 kHz
DC Bus Voltage Vdc 800 V
AC Bus Voltage Vbus 240 VL-g
Inductor Lf 0.76 mH
PV Power Output Ppv 3 kW
PHEV Power Consumption Pphev 12 kW
The results illustrate that when the system changes from grid-connected mode to islanding mode, the dc bus voltage, ac bus voltage and load currents remain constant. Moreover, the voltage and current spike during this transition are within three times of their normal values, which is not significant.
Inverter1 Local Energy Storage L * dc V dc V PI * d I abc V abc I ABC /dq ABC /dq d I PI d V′ L q I d V PI q V′ L dq/ ABC Modulator * q I * d V d V * d I abc V abc I d I d V′ q I d V Vq′ * q I
(a) (b) Figure 6. Simulation results for intentional islanding
Therefore, the proposed control strategy is effective, and the real time simulation platform successfully handles the complex smart grid model with a large number of switching devices that are operating at high frequency.
IV. CASE STUDY TWO:INFLURENCE OF COMMUNICATION
NETWORK ON LOAD SHEDDING
A. Model Description
A smart grid model based on case study one is combined with the communication network described in Section II, as illustrated in Fig. 7.
Figure 7. Load shedding model
There are several network emulation toolsets currently available. In academia, one of the most prevalent tools is NS2 [13]. NS2 is an open-source network simulation package which has the capability to operate as a System-in-the-Loop (SITL) network emulator. It has the ability to accept real-time network traffic and simulate either a wired or wireless network. Since NS2 was mainly developed in the academic and open-source community, there is no corporate support available; however, a large community of support
exists online. NISTnet [14] is another open-source tool which has been used for real-time network emulation [15]. However, the network simulator for NISTnet is not as well developed and cannot support the simulation of different wired and wireless network protocols without significant work.
When considering commercial network emulators there are several options. Exata [16] is a network emulator developed by Scalable Network Technologies (SNT) based on the popular QualNet network simulator. It has the ability to simulate parameters such as terrain, cyber-attacks, scalability, and static parameters. While Exata can be used in SITL applications, it is mainly focused on simulation in the military industry. OPNET [17] is a well-developed commercially network simulator that has been used extensively in research. There is a large community of support available for OPNET modeling, similar to NS2; however, being a commercial product, corporate support through OPNET Technologies is available as well. A SITL package is available for use with OPNET that bridges the OPNET network simulation with the hardware simulation. The university license for OPNET allows for significant flexibility in terms of network development, this combined with the integrated support of many well-known communication protocols, makes OPNET an excellent option for implementation of the proposed communication network. In order to develop a protection scheme for the smart grid, an external microgrid control center (MCC) is utilized in the model. In the model, all circuit breakers are equipped with transmitter and receiver units, which are able to send its status to the MCC as well as acquire control signals. During a fault on the grid side, the main circuit breaker will open and send a signal to the MCC which initiates islanding mode and disconnects the three noncritical loads (PHEV batteries) simultaneously. Furthermore, the LES dc bus voltage is monitored by the MCC and gives a status of the power capabilities of the smart grid. The MCC will start reconnecting noncritical loads one at a time every 0.1
Circuit Breaker Signal
Igrid: 20 A/div IPHEV: 50 A/div Local Energy Storage PV Battery 1 Circuit Breaker Critical Load 1 kW Maximum 8.5 kW 4 kW 3kW Battery 2 4 kW Battery 3 4 kW CB 1 CB 2 CB 3
Real Time Target
Network Simulator CPU1 CPU2 Vdc Ethernet TCP or UDP/IP
seconds. If the monitored LES dc bus voltage is constant, the smart grid is able to sustain itself. However, if the voltage begins to decrease, the MCC will disconnect the last load added to the system, and the load shedding process stops. The effects of latency, bandwidth, and packet losses will introduce behaviors in the overall network which can be studied and compared.
B. Simulation Results
Real time simulation is performed to test the influence of the communication on the power network. The power level of each unit is shown in Fig. 7. It is assumed that when islanding occurs, the LES can provide a maximum of 8.5 kW power and the PV can provide 3 kW power. On the load side, the power consumption of each PHEV battery and critical load are 4 kW and 1 kW, respectively. The reclosing time of each PHEV switch is 0.1 s one after the other. And the dc bus threshold voltage is 700 V.
Fig. 8 shows the results for two types of communication: no delay, Fig. 8(a), and a delay of 20 ms, Fig. 8(b). In the first case, the communication between nodes is ideal or instantaneous data transfer. The grid is disconnected at t1 due to a three phase fault, as well as all PHEV batteries. Each PHEV battery is reconnected one by one after every 0.1 seconds. At the same time, a remote sensing unit measures the LES dc bus voltage data and sends it to the MCC. At t4, switch CB3 is closed, and the last load reconnected causes the dc bus voltage to drop due to power imbalance. When the dc bus voltage drops to the threshold voltage at t5, CB3 is reopened by the MCC and the dc bus voltage returns to its normal value.
In the second case, there is a 20 ms delay between the real dc bus voltage value and the dc bus voltage value sent to the MCC, as is shown in Fig. 8(b). This causes the reopen time for the CB3 to be also delayed. As a result, the dc bus
voltage drops far below the threshold voltage and there is a greater disturbance on the ac bus voltage when it is compared to the situation with no delay. This could cause damages to the LES and influence the function of the critical load.
In conclusion, the communication network brings great benefits to the operation of the smart grid in allowing for implementation of new and different types of protection schemes and control. However, it is seen from Fig. 8(a) and 8(b) that, without simulating the communication network, the actual system response is not accurately depicted. The real time simulation platform presented in this paper includes the influence of the communication to the simulation, thus provides an effective method to study the communication system in smart grid.
V. CONCLUSIONS
This paper presents the state of the art technology on real time simulation of smart grid. On one hand, the platform presented in this paper utilizes switch event interpolation and parallel computation technologies; combined with the advanced hardware platform, this system can achieve real time simulation with hundreds of switches at switching frequencies up to 10 kHz. On the other hand, when combining power systems modeling with network emulator, this system can simulate the communication network in smart grid and provide great convenience for related study.
A smart grid model of PHEV charging station is built with the aforementioned technologies. The real time model contains most of critical units in smart grid, including LES, PV, power conditioning circuits, solid state switches, and a communication network. Two case studies were designed based on this model to test the performance of the proposed platform. In the first case study, a control strategy of intentional islanding and seamless transition from grid-
(a) No delay (b) 20 ms delay Figure 8. Simulation results for load shedding
Vbus: 500 V/div Vdc: 200V/div ILES: 20 A/div t1 t2 t3 t4 t5 Vbus: 500 V/div Vdc: 200V/div ILES: 20 A/div t1 t2 t3 t4 t5
connected mode to islanding mode is utilized in the system. Test results show that the designed control strategy is effective.
In the second case study, a communication network is simulated together with the power network in real time. The influence of communication to the power network control is analyzed in the paper. Although the communication system brings great benefits to the operation of the smart grid, it also introduces negative influences in the electric power system under certain circumstances. In order to offset these influences, communication systems in smart grid should be thoroughly considered and designed properly in future smart grid application, which shows the importance of the integrated real time simulation platform.
REFERENCES
[1] R. Brown, “Impact of smart grid on distribution system design,” in
Proc. IEEE Power and Energy Society General Meeting, 2008, pp.
1-4.
[2] P. Parikh, M. Kanabar, and T. Sidhu, “Opportunities and challenges of wireless communication technologies for smart grid applications,”
in Proc. IEEE Power and Energy Society General Meeting, 2010, pp.
1-7.
[3] R.H. Lasseter, et al., “CERTS Microgrid laboratory test bed,” IEEE
Trans. Power Delivery, vol. 26, no. 1, pp. 325-332, Jan. 2011.
[4] W. Li, G. Joos, and J. Belanger, “Real-time simulation of a wind turbine generator coupled with a battery supercapacitor energy storage system,” IEEE Trans. Industry Electronics, vol. 57, no. 4, pp. 1137-1145, April 2010.
[5] D. Brandt, R. Wachal, R. Valiquette, and R. Wierckx, “Closed loop testing of a joint var controller using a digital real-time simulator,”
IEEE Trans. Power Systems, vol. 6, no. 3, pp. 1140-1146, Aug. 1991.
[6] S. Abourda, J. Belanger, and C. Dufour, “Real-time HIL simulation of a complete PMSM drive at 10 μs time step,” in Proc. IEEE
European Conference on Power Electronics and Applications, 2005,
pp. P.3- P.9.
[7] Y. Li, D. Vilathgamuwa, and P. Loh, “Design, analysis, and real-time testing of a controller for multibus microgrid system,” IEEE Trans.
Power Electronics, vol. 19, no. 5, pp. 1195-1204, Sept. 2004.
[8] J. Nutaro, P. Kuruganti, M. Shankar, L. Miller, and S. Mullen, "Integrated modeling of the electric grid, communications, and control", International Journal of Energy Sector Management, vol. 2, pp. 420 – 438, 2008.
[9] R. Reddi and A. Srivastava, “Real time test bed development for power system operation, control and cyber security,” in Proc. North
American Power Symposium, 2010, pp.1-6.
[10] Opal-RT Technologies [online]. Available: http://www.opalrt.com. [11] Dolphin [online]. Available: http://www.dolphinics.com/
[12] M.G. Villalva, J.R. Gazoli, and E.R. Filho, “Comprehensive Approach to Modeling and Simulation of Photovoltaic Arrays,” IEEE
Trans. Power Electronics, vol. 24, no. 5, pp. 1198-1208, May 2009.
[13] “Network Emulation with the NS Simulator,” [online]. Available: http://www.isi.edu/nsnam/ns/ns-emulation.html.
[14] NIST Net [online]. Available: http://dns.antd.nist.gov/itg/nistnet. [15] X. Zhang, W. Ye, and Y. Jin, “Dynamic overlay routing based on
active probing measurements: An emulation study,” in Proc.
Communications and Photonics Conference and Exhibition, 2009,
pp.1-7.
[16] Exata [online], 2011. Available: http://www.scalable-networks.com. [17] OPNET[online], 2011. Available: http://www.opnet.com.