Mapping and Analysis of Vegetation Spectral Reflectance in Oil
and Gas Seepage Polluted Zones Using Six Vegetation Indices
Chukwudi Andy Okereke* Princecharles C. Anyadiegwu
Department of Surveying and Geoinformatics, Imo State University, PMB 2000 Owerri, Imo State Nigeria Abstract
The growth and health of vegetation may be adversely influenced by oil and gas pollution or leakage. Thus, when an environment is contaminated with oil and gas pollution, growing vegetation often exhibit signs of stress. Satellite remote sensing has proven to be an effective tool and approach to detect and monitor vegetation health and status in oil and gas polluted zones. Previous studies have adopted vegetation indices which are obtained from remotely sensed satellite data to monitor vegetation health. This study is aimed at demonstrating the potential of vegetation spectral techniques for detecting and monitoring of oil and gas pollution from Landsat 8 OLI/TIRS remotely sensed data. To determine the influence of oil and gas pollution on vegetation reflectance, few polluted sites were analyzed and their reflectance were compared in all the TM bands against the non – polluted sites. The mean and standard deviation reflectance of each of the bands in two groups of sites and t – test are calculated to determine if there are any significant differences between the reflectance from the polluted and non – polluted sites. Thus, the study shows that in all the spectral bands, the vegetation reflectance from polluted and non – polluted areas exhibit small significant difference with a p-value >0.005. To further analyze the impacts of oil and gas on vegetation, six spectral indices including NDVI, SRI, MSAVI2, SAVI, ARVI2 and EVI2 were utilized. SRI, SAVI and EVI2 showed no significant relationship between polluted and non-polluted areas with a p-value >0.05 higher than the alpha level of 0.05 and the calculated t - test value is lower than the t-critical value of 2.09 while NDVI, MSAVI2 and ARVI2 showed a significant relationship between the polluted and non-polluted areas.
Keywords: oil and gas pollution, Ground Truthing, Vegetation Indices, Landsat 8 OLI/TIRS, Remote Sensing and Vegetation Cover.
DOI: 10.7176/JEES/9-7-05 Publication date:July 31st 2019
1. Introduction
Underground hydrocarbon reservoir often leak as a result of abundance of oil and gas at the earth’s subsurface and as the pass through impermeable seals, along faults zones, and fractures in rocks and planes of weakness between geological layers at high pressure. They form seepages at the earth’s surface. The negative impact of hydrocarbon seepages in our environment includes destruction of wild life, loss of fertile soil, pollution of air and water and damage to the ecosystem (Aghalino, 2000). Hydrocarbon seepage is one of the world’s environmental problems, which comes with negative impact on soil and vegetation. Hydrocarbon seepage in an area often gives rise to brownish and stressed vegetation and make fertile soil to become barren (Roberts, 1997). Vegetation is very important in our daily lives and we depend upon it to satisfy our basic needs which include food, clothing, shelter and health care . On a daily basis, our basic needs increase, and this is attributed to increase in world population, income and urbanization. Unfortunately, under field conditions, vegetation is continuously vulnerable to a wide range of biotic, abiotic and anthropogenic changes owing to hydrocarbon seepage. Hydrocarbon seepage often influences the soil chemistry, spectral reflectance, soil air composition and makes growing vegetation deficient in water and minerals intake, thus affecting their optimum growth (Schumacher, 2001). Hydrocarbon seepage also affects the health status of vegetation and make them to be stressed.
Remote sensing has the ability to detect the health status of vegetation, thus detecting if the vegetation is healthy or stressed. It is considered as a valuable tool for the determination, analysis and monitoring of vegetation status over time (Pinter et. al. 2003). Remote sensing has the ability to detect if a plant is healthy or is stressed, because vegetation spectral reflectance is dependent on the chlorophyll and water absorption in the leaves, which get affected by oil and gas impact. A vegetation which is healthy has high spectral reflectance pattern at wavelengths near infrared (800 – 1100nm) and are characterized by high absorption of blue (450nm) and red
Water 970 Weak absorption
Water, CO2 1450, 1944 Strong absorption
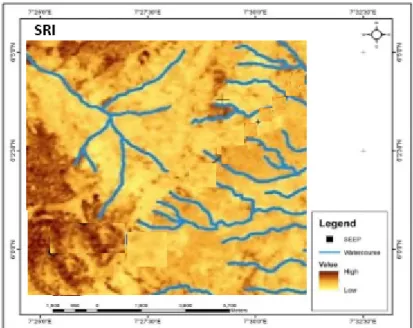
Vegetation indices are the most common and frequently used indices which indicate the relative density and health of vegetation. Vegetation indices such as NDVI, SRI, SAVI and MSAVI2 etc. compare the reflectance in the red and near – infrared bands. Healthy vegetation reflects a significant amount in the near – infrared portion of spectrum and reflects minimal in the visible, because chlorophyll present in plant leaves strongly absorb visible light, which is used in photosynthesis and the cell structure of the leaves strongly reflect near – infrared light. NDVI is the most widely used vegetation index. This index is adopted to distinguish healthy vegetation from others and from non – vegetated areas with the aid of red and near – infrared reflectance values. Calculations of NDVI for a given pixel usually result in a number which ranges from minus one (-1) to plus one (+1). No green leaves give a value close to zero. A zero means no vegetation and close to +1 (0.8 – 0.9) indicating the highest possible density of green leaves. SRI provides a general indication of vegetation. It is simply the reflectance in the NIR band divided by the reflectance in the red band. A larger SR value indicates healthy vegetation while lower values indicate soil, water or ice.
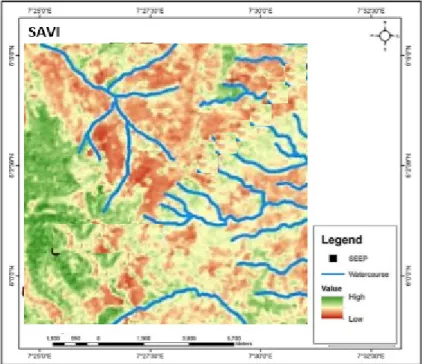
The aim of this study is to map and analyze the spectral reflectance of vegetation in hydrocarbon seepage polluted zones using vegetation indices. The SAVI is structured similar to the NDVI but with the addition of a soil brightness correction factor L. The “L” factor is one which is determined by the relative percentage of the vegetation, depending on its darkness or lightness (L=0 for very high vegetation cover, 1 for very low vegetation cover and 0.5 for intermediate cover) (Gibson et al., 2000). It is adopted as an exponent assigned to the red- band value in the denominator as well as a multiplier (L+1) of the first term.
Table 2: Summary of some common vegetation indices [Haindongo, (2009)]
Vegetation Index Acronym Author Formula
Normalized Difference Vegetation index
NDVI Rouse et al. 1974 (NIR-R)/(NIR+R)
Simple Vegetation Index SVI Pearson and Miller,
1972
Near Infrared/Red
Soil Adjusted Vegetation Index SAVI Huete, 1988
(NIR-R)/(NIR+R+L)*(1+L) 1.2. Study Area
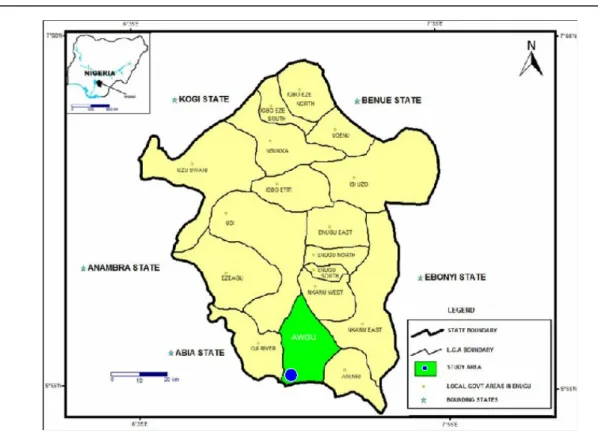
Ugwueme is located in the present Awgu Local Government Area of Enugu State. The town is bound by Latitude 60 0ʹ 00ʺN and 60 03ʹ 00ʺN and Longitude 70 24ʹ 00ʺE and 70 28ʹ 00ʺE of geographical co - ordinates. The study
area has mainly Ferralitic soils known as Red Earth, which is poorly drained and is particularly suitable for the cultivation of cash crops. The zone experiences heavy rainfall during the rainy season with an annual record of 1,800 mm which aid heavy flooding, soil leaching, erosion, extensive outwash and percolation during the dry season with an annual temperature of 26.60C. Oil and Gas seepage in the study area is categorized as
Macro-Seepage. Macro-Seepage is oil and gas seepage that can be seen with the eye directly on the surface as asphalt, oil pond or gas bubbles when associated with water or mud – volcano.
Figure 1. Location of the study area (Source: modified from Obeta and Nwankwo, 2015) 2. Materials and Methods
2.1. Data Collection
The study was carried out using Landsat 8 OLI/TIRS 2016 imagery which was acquired freely online from the site
www.http://earthexplorer.usgs.gov. They were retrieved from path 188 and row 55, path 188 and row 56 and path 189 and row 55 at a scale resolution of 30m. ArcGIS 10.3 software was used to compliment the display and processing of the data. The global positioning system (GPS) was used during field studies to obtain ground truthing information. To determine the influence of pollution from hydrocarbon seepage on vegetation reflectance, we analyzed few polluted sites and then compare their reflectance in all the Landsat 8 OLI/TIRS bands against the non – polluted sites. We then calculated the mean as well as the standard deviation reflectance of each of the bands in two groups of sites, and t – test to determine if there are any significant differences between the reflectance from the polluted and non – polluted sites.
Table 3: Sample points of 7 polluted and non – polluted vegetation areas and Location
Sample Points Categories Location X Location Y
1 Polluted 328572.962 670618.500 2 Polluted 327051.605 669130.216 3 Polluted 325519.664 663492.595 4 Polluted 326620.333 665566.933 5 Non – Polluted 328916.260 666979.811 6 Non – Polluted 333000.773 667376.687 7 Non – Polluted 328717.822 664234.753
2.2. Comparison of vegetation reflectance in polluted and non-polluted sites
Sequel to testing the hypothesis of the study, vegetation reflectance from sample points were obtained from Landsat 8 OLI data. The statistics for mean and standard deviation of the vegetation spectral reflectance were computed using statistical tools in SPSS. To test for the statistical significance of the study, it is assumed that
B7 7857.000 1192.182 843.000 10286.000 1524.522 1078.000 0.420
B8 8637.000 257.387 182.000 10207.000 873.984 618.000 1.420
B9 5033.000 1.414 1.000 5045.500 12.021 8.500 0.880
B10 27762.000 1157.534 818.500 29459.000 552.958 391.000 1.050 B11 25538.000 876.105 619.500 26782.000 481.540 340.500 0.710
Probability Error (alpha level) 0.05 Degree of Freedom 22.00
t-critical value 2.09
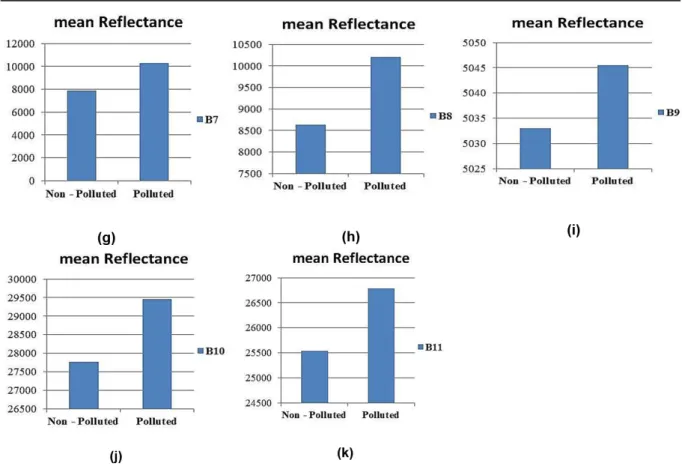
From the study, it is noted that in all the spectral bands, the vegetation reflectance from polluted and non-polluted areas showed small significant difference with a p-value >0.005. For the mean and standard deviation [See figure 2 (a – k)] for the various Landsat 8 bands, the statistical tests reveal significance differences between the reflectance of vegetation in the polluted and non - polluted areas. For example, in blue spectral band, green spectral band, red spectral band, and other spectral bands except spectral bands 5 and 8, the reflectance in the non - polluted areas were lower than in the polluted areas. In contrast, the NIR band showed a higher reflectance in the non – polluted areas as compared to the polluted sites. We note that these results are intriguing and need further studies.
Figure 2: (a – k): Mean and standard deviation for vegetation reflectance (B1 – B11) 3. Results
Adoption of vegetation indices minimizes the noise in the data. Therefore, to further analyze the impacts of Hydrocarbon seepage on vegetation in the study, there is need to calculate the vegetation indices. Thus, we need to first analyze if there were any significant differences between the vegetation indices derived for the polluted sites and those from the non-polluted sites. Secondly, we identify which vegetation indices are best suitable for depicting the impacts of pollution on vegetation in the study area. Table 5 shows the results from a sample of vegetation indices that were calculated.
Table 5: Calculated statistics for spectral vegetation indices
Non - Polluted Polluted Calculated
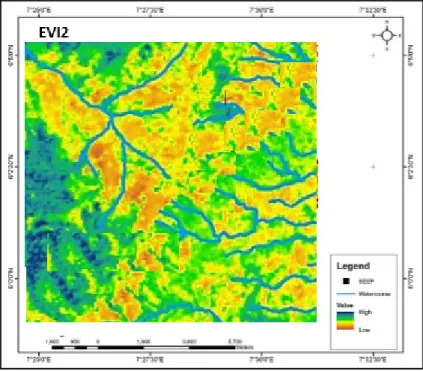
Statistics Vegetation Index Mean Standard Deviation Standard Error Mean Standard Deviation Standard Error t – Test value P – Values NDVI 0.270 0.012 0.009 0.173 0.024 0.017 2.600 0.01725 SRI 1.740 0.045 0.032 1.420 0.070 0.050 1.530 0.14141 MSAVI2 0.405 0.018 0.013 0.260 0.036 0.026 3.880 0.00093 SAVI 0.220 0.028 0.020 0.065 0.049 0.035 1.430 0.16798 ARVI2 0.647 0.029 0.020 0.415 0.058 0.041 2.600 0.18072 EVI2 0.136 0.014 0.010 0.022 0.028 0.020 1.390 0.01725 t-critical value 2.09 Degree of Freedom 20.00 Probability Error 0.05
Figure 3 : NDVI map of the study area (source: author, 2019)
Figure 5: MSAVI2 map of the study area (source: Author, 2019)
Figure 7: ARVI2 map of the study area (source: Author, 2019)
Figure 8: EVI2 map of the study area (source: Author, 2019) 4. Conclusion
The study shows that Remote Sensing and GIS is a valuable tool to detect and monitor the health of vegetation in hydrocarbon seepage zones. Thus in all the spectral bands, the vegetation reflectance from polluted and non – polluted areas exhibit small significant difference with a p-value >0.005. To further analyze the impacts of oil and gas on vegetation, six spectral indices including NDVI, SRI, MSAVI2, SAVI, ARVI2 and EVI2 were utilized. SRI, SAVI and EVI2 showed no significant relationship between polluted and non-polluted areas with a p-value >0.05 higher than the alpha level of 0.05 and the calculated t - test value is lower than the t-critical value of 2.09 while NDVI, MSAVI2 and ARVI2 showed a significant relationship between the polluted and non-polluted
Aghalino, S.O., (2000). Petroluem exploration and the agitation for compensation by oil mineral producing communities in Nigeria. Journal of Environment Policy Issues, Vol. 1: II.
Blackburn, G. A., (2007). Hyper-spectral remote sensing of plant pigments. Journal of experimental botany, 58: pp 855–867.
Carter, G. A. (1991). Primary and secondary effects of water content on the spectral reflectance of leaves. American Journal of Botany pp 78.
Gibson, P.J., Power, C.H., Goldin S.E. and Rudahl, K.T. (2000). Introductory to Remote Sensing: Digital Image process and applications, pp 111-113
Gitelson, A. A. and Merzlyak, N. (1996). Signature analysis of leaf reflectance spectra: Algorithm development for remote sensing of chlorophyll. Journal of Plant Physiology, 148: pp 494-500
Haindongo P. (2009). Investigating the factors influencing vegetation stress in a part of the Keiskamma catchment, Eastern Cape, a remote sensing and GIS approach: Unpublished M.Sc Dissertion, Nelson Mandela Metropolitian University, South Africa.
Male, E., Pickles, W., Silver E., Hoffmann G., Lewicki, J. and Apple M. (2010). Using hyperspectral plant signatures for CO2 leak detection during the 2008 ZERT CO2 sequestration field experiment in Bozeman,
Montana. Environmental Earth Sciences, 60: pp 251-261.
Miller, J. R., Hare, E. W. and Wu, J., (1990). Quantitative characterization of the red edge reflectance. An inverted-Gaussian model. International Journal of Remote Sensing, 11 (10), pp 1755– 1773.
Obeta, M. and Nwankwo, C. (2015). Factors Responsible for Rural Residential Water Supply Shortage in Southeastern Nigeria. Journal of Environmental Geography. 8. 21-32. 10.1515/jengeo-2015-0009.
Pinter, P. J. and J. L. Hatfield (2003). Remote Sensing for Crop management. Photogrammetric Engineering and Remote Sensing, pp 647-664.
Roberts, H.J.,( 1997). Oil contaminated soil and some reclamation. Journal of Soil Science, 24: 231-245
Schumacher, D., (2001). Petroleum exploration in environmentally sensitive areas: Opportunities for non-invasive geochemical and remote sensing methods, pp. 012-1 – 012-5. Annual Convention of the ASPG.
Smith, K. L., (2002). Remote sensing of leaf responses to leaking underground natural gas. Unpublished PhD, University of Nottingham, Nottingham, UK.
![Table 2: Summary of some common vegetation indices [Haindongo, (2009)]](https://thumb-us.123doks.com/thumbv2/123dok_us/11076593.2993923/2.892.189.708.130.366/table-summary-common-vegetation-indices-haindongo.webp)