noaa
NATIONAL OCEANIC AND/
ATMOSPHERIC ADMINISTRATIONNational Environmental Satellite, Data, and Information Service
NOAA Technical Memorandum
NESDIS NGDC-
24
ETOPO1 1 ARC-MINUTE GLOBAL RELIEF MODEL:
PROCEDURES, DATA SOURCES AND ANALYSIS
C. Amante
B.W. Eakins
National Geophysical Data Center
Marine Geology and Geophysics Division
Boulder, Colorado
UNITED STATES
DEPARTMENT OF COMMERCE
Gary Locke
Secretary
NATIONAL OCEANIC AND
ATMOSPHERIC ADMINISTRATION Dr. Jane Lubchenco
Under Secretary for Oceans and Atmosphere/Administrator
National Environmental Satellite, Data, and Information Service Mary E. Kicza
Assistant Administrator
NOAA Technical Memorandum
NESDIS NGDC-24
ETOPO1 1 ARC-MINUTE GLOBAL RELIEF MODEL:
PROCEDURES, DATA SOURCES AND ANALYSIS
Christopher Amante
1Barry W. Eakins
21
NOAA Ernest F. Hollings Undergraduate Scholar, Boulder, Colorado
2
Cooperative Institute for Research in Environmental Sciences, University of Colorado, Boulder
National Geophysical Data Center
Marine Geology and Geophysics Division
Boulder, Colorado
Amante and Eakins, 2009
ii
NOTICE
Mention of a commercial company or product does not constitute an endorsement by the
NOAA National Environmental Satellite, Data, and Information Service. Use of information
from this publication concerning proprietary products or the test of such products for publicity
or advertising purposes is not authorized.
Corresponding project contact:
Barry E. Eakins
NOAA, National Geophysical Data Center Marine Geology and Geophysics Division 325 Broadway, E/GC 3 Boulder, Colorado 80305 Phone: 303-497-6505 Fax: 303-497-6513 E-mail: [email protected] http://www.ngdc.noaa.gov/mgg/global/global.html
Also available from the National Technical Information Service (NTIS) (http://www.ntis.gov)
ETOPO1 1 Arc-MinuTE GlObAl rEliEf MOdEl iii Contents 1. Introduction ...1 2. Study Area ...2 3. Methodology ...2
3.1 Data Sources and Processing ...3
3.1.1 Shoreline ...4
3.1.2 Bathymetry ...5
3.1.3 Topography ...7
3.1.4 Integrated Bathymetry–Topography ...9
3.1.5 Bedrock ...13
3.2 Establishing Common Datums ...14
3.2.1 Vertical datum transformations ...14
3.2.2 Horizontal datum transformations ...14
3.3 Digital Elevation Model Development ...14
3.3.1 Verifying consistency between data sets ...14
3.3.2 Gridding of coastal bathymetry ...14
3.3.3 Gridding the data with MB-System...16
3.3.4 Registration of grids ...16
3.4 Quality Assessment of the DEM ...17
3.4.1 Horizontal and vertical accuracy ...17
4. Summary and Conclusions ...17
5. Acknowledgments ...18
6. References ...18
7. Data Processing Software ...19
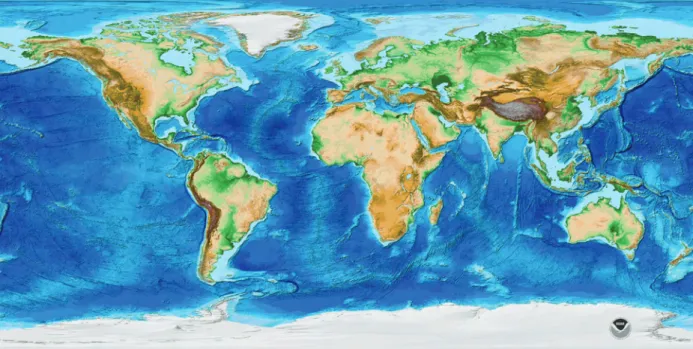
Listof figures Figure 1. Color, shaded-relief image of the ETOPO1 Ice Surface Global Relief Model ...1
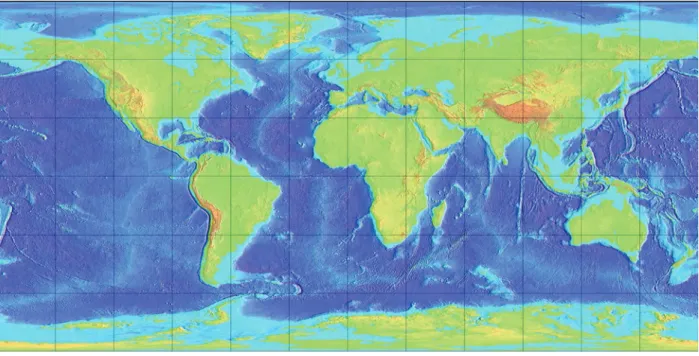
Figure 2. Color, shaded-relief image of the ETOPO1 Bedrock Global Relief Model ...2
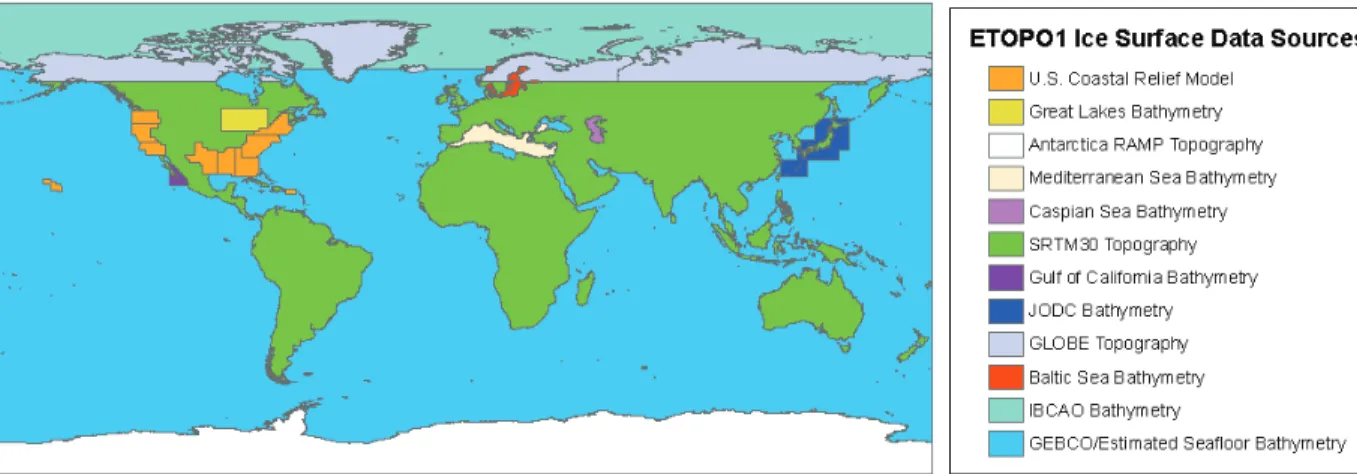
Figure 3. Source and coverage of data sets used to compile the ETOPO1 Ice Surface Global Relief Model ...3
Figure 4. Source and coverage of data sets used to compile the ETOPO1 Bedrock Global Relief Model ...3
Figure 5. Color image of Caspian Sea depth contours and bathymetric grid ...6
Figure 6. Color image of Mediterranean Sea morpho-bathymetric map ...6
Figure 7. A row of bad data present in the SRTM30 data set ...7
Figure 8. Coverage of GLOBE topography that was used in building ETOPO1...8
Figure 9. Anomalous depth values in the Measured and Estimated Seafloor Topography grid in shallow coastal waters north of Vancouver Island ...10
Figure 10. Color image of the IBCAO v.2 grid of the Arctic ...11
Figure 11. Areas of the U.S. coast covered by NGDC’s Coastal Relief Model ...12
Figure 12. Color image of the Estimated Seafloor Topography grid along Iceland’s northwest coast ...15
Figure 13. Color image of Iceland’s northwest coast in ETOPO1 ...15
Figure 14. Differences between grid-registration and cell-registration ...17
Listof tabLes Table 1. Specifications for ETOPO1 ...2
Table 2. Shoreline data sets used in evaluating ETOPO1 source data sets...4
Table 3. Bathymetric data sets used in compiling ETOPO1 ...5
Table 4. Topographic data sets used in compiling ETOPO1 ...7
Table 5. Integrated bathymetric–topographic data sets used in compiling ETOPO1 ...9
Table 6. Bedrock elevation data sets used in compiling the ETOPO1 Bedrock Global Relief Model ...13
ETOPO1 1 Arc-Minute Global Relief Model
Procedures, Data Sources and Analysis
1.
i
ntroduCtionIn August 2008, the National Geophysical Data Center (NGDC), an office of the National Oceanic and
Atmospheric Administration (NOAA) developed the ETOPO1 1 Arc-Minute Global Relief Model as an improvement to the ETOPO2v2 Global Relief Model. ETOPO1 is available in “Ice Surface” (top of Antarctic and Greenland ice sheets; Fig. 1) and “Bedrock” (base of the ice sheets; Fig. 2) versions. Both versions of ETOPO1 were generated from diverse global and regional digital data sets (coverage shown in Figs. 3 and 4), which were shifted to common horizontal and vertical datums, and then evaluated and edited as needed. This report provides a summary of the data sources and methodology used in developing ETOPO1.
Amante and Eakins, 2009
2
Figure 2. Color, shaded-relief image of the ETOPO1 Bedrock Global Relief Model. Illumination from the east.
2.
s
tudya
reaETOPO1 provides complete global topographic and bathymetric coverage between -90° to +90° in latitude and -180° to +180° in longitude.
3.
M
ethodoLogyETOPO1 was developed to improve the resolution and accuracy of the ETOPO2v2 2 arc-minute Global Relief Model, and was designed to support tsunami forecasting, modeling and warning, as well as ocean circulation modeling and Earth visualization. The best available regional and global digital data sets were obtained by NGDC and shifted to common horizontal and vertical datums: World Geodetic System 1984 (WGS 84) and sea level. Data processing, evaluation, assembly and assessment of ETOPO1 are described in the following subsections.
Table 1: Specifications for ETOPO1.
Versions Ice Surface, Bedrock
Coverage Area Global: -180º to 180º; -90º to 90º
Coordinate System Geographic decimal degrees
Horizontal Datum World Geodetic System of 1984 (WGS 84)
Vertical Datum Sea Level
Vertical Units Meters
Cell Size 1 arc-minute
ETOPO1 1 Arc-MinuTE GlObAl rEliEf MOdEl
3
3.1
Data Sources and Processing
Shoreline, bathymetric, topographic, integrated bathymetric–topographic, and bedrock digital data sets (data footprints shown in Figs. 3 and 4) were obtained from several U.S. government agencies, international agencies and academic institutions. Safe Software’s (http://www.safe.com/) ‘Feature Manipulation Engine’ (FME) data translation tool package was used to shift data sets to WGS 84 horizontal datum and sea level vertical datum, and to convert them into ESRI (http://www.esri.com/) ArcGIS shape files and rasters. The shape files and rasters were then displayed with ArcGIS to assess data quality and manually edit data sets. Wessel and Smith’s [1991, 1995] ‘Generic Mapping Tools’ (GMT) version 4.3 (http://gmt.soest.hawaii.edu) and Caress and Chayes’ [1995] ‘MB-System’ version 5.1.0 (http:// www.ldeo.columbia.edu/res/pi/MB-System/) were used to grid the data and build the global relief model.
Figure 3. Source and coverage of data sets used to compile the ETOPO1 Ice Surface Global Relief Model.
Amante and Eakins, 2009
4
3.1.1 Shoreline
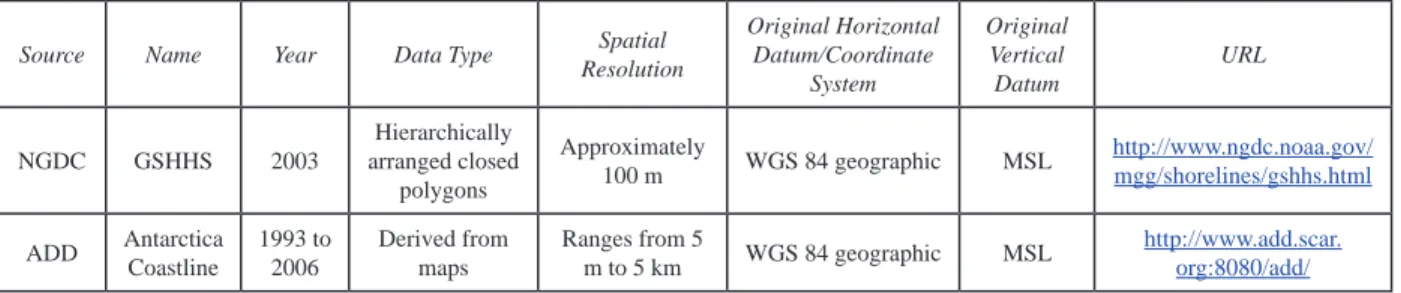
Coastline data sets were obtained from NGDC and the Antarctica Digital Database (Table 2). Both coastline data sets were used in evaluating individual source data sets and ETOPO1. They were also used to clip some data sets to the coastline to eliminate anomalous values.
Table 2: Shoreline data sets used in evaluating ETOPO1 source data sets.
Source Name Year Data Type Spatial Resolution Original Horizontal Datum/Coordinate System Original Vertical Datum URL NGDC GSHHS 2003 Hierarchically arranged closed polygons Approximately 100 m WGS 84 geographic MSL http://www.ngdc.noaa.gov/ mgg/shorelines/gshhs.html ADD Antarctica Coastline 1993 to 2006 Derived from maps Ranges from 5 m to 5 km WGS 84 geographic MSL http://www.add.scar. org:8080/add/ 1) GSHHS
NGDC disseminates the GSHHS (Global Self-consistent, Hierarchical, High-resolution Shoreline) in ArcGIS format. GSHHS is a high-resolution shoreline data set created from the two well-known, public domain data sets [Wessel and Smith, 1996]. World Data Bank II (WDB; also known as CIA Data Banks) contains global coastlines, lakes, political boundaries, and rivers at an approximate working scale of 1:3,000,000, which means that the features are considered to be accurately located on maps using that scale or smaller. The other data set is the World Vector Shoreline (WVS), which only contains shorelines along the ocean and land interface. The WVS data has superior quality and resolution with a working scale of 1:100,000 and thus the GSHHS was created using the WVS data when possible and supplementing it with WDB data. The data have undergone extensive processing and are free of internal inconsistencies such as erratic points and crossing segments.
2) Antarctica Coastline
The Antarctic Digital Database provides a medium-resolution coastline for Antarctica, south of 60° S,
created by the British Antarctic Survey. The database is managed by the Scientific Committee on Antarctic
ETOPO1 1 Arc-MinuTE GlObAl rEliEf MOdEl
5
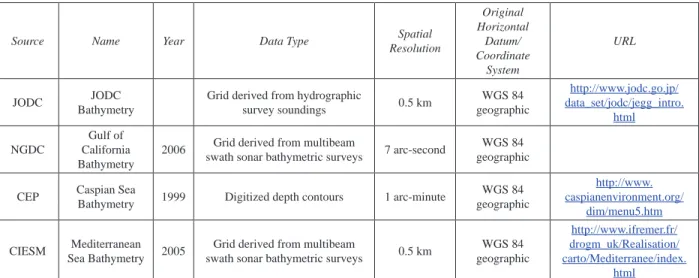
3.1.2 Bathymetry
Bathymetric data sets used in compiling the ETOPO1 Global Relief Model were obtained from the Japan Oceanographic Data Center (JODC), NGDC, the Caspian Environment Programme (CEP), and the Mediterranean Science Commission (CIESM; Table 3).
Table 3: Bathymetric data sets used in compiling ETOPO1.
Source Name Year Data Type Spatial
Resolution Original Horizontal Datum/ Coordinate System URL JODC JODC Bathymetry
Grid derived from hydrographic
survey soundings 0.5 km WGS 84 geographic http://www.jodc.go.jp/ data_set/jodc/jegg_intro. html NGDC Gulf of California Bathymetry
2006 Grid derived from multibeam
swath sonar bathymetric surveys 7 arc-second
WGS 84 geographic CEP Caspian Sea
Bathymetry 1999 Digitized depth contours 1 arc-minute
WGS 84 geographic http://www. caspianenvironment.org/ dim/menu5.htm CIESM Mediterranean Sea Bathymetry 2005
Grid derived from multibeam
swath sonar bathymetric surveys 0.5 km
WGS 84 geographic http://www.ifremer.fr/ drogm_uk/Realisation/ carto/Mediterranee/index. html 1) JODC Bathymetry
The JODC data set provides bathymetric data for three areas surrounding Japan: (1) latitude: N 34 to 46 (degrees), longitude : E 135 to 148 (degrees) (2) latitude: N 30 to 38 (degrees), longitude : E 128 to 144 (degrees) (3) latitude: N 24 to 30 (degrees), longitude : E 122 to 132 (degrees)
The underlying hydrographic survey soundings were collected by the Hydrographic and Oceanic Department of the Japan Coast Guard and various ocean research institutes. The data were then integrated and gridded at 500 meter intervals in the WGS 84 geographic coordinates. Since there is a variety of data quality and density, JODC smoothed the data to prevent improper steps. In areas void of data or with rapid bathymetry changes, such as coastal areas or seamounts, there are instances where the adopted values are moderately different from observed values.
2) Gulf of California Bathymetry
A 7 arc-second grid of multibeam swath sonar bathymetric surveys in the mouth of the Gulf of California, previously created by one of the authors, was used in building ETOPO1. This grid is not currently available to the public, although all of the multibeam swath sonar bathymetric data can be obtained from the online NGDC multibeam bathymetric database (http://www.ngdc.noaa.gov/mgg/bathymetry/multibeam.html).
Amante and Eakins, 2009
6
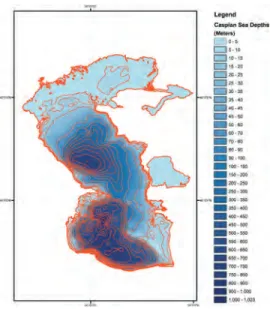
3) Caspian Sea Bathymetry
The Caspian Environment Programme provides digitized contour lines of the Caspian Sea ranging from zero to 1000 meters in depth, in the WGS 84 geographic coordinate system. The digitized contour lines were created from ‘The Navigation Map’ published by the Navigation and Oceanography Department of the Defense Ministry of the USSR in 1987 at a scale of 1:1,000,000 in the Mercator projection. NGDC gridded the contours with the ArcGIS ‘Topo to Raster’ tool to infill depths between contours (Fig. 5). The contour intervals were originally referenced relative to local lake level—approximately 28 meters below mean sea level. The grid was shifted 28 m vertically, to be consistent with sea level, before use in gridding ETOPO1.
Figure 5. Color image of Caspian Sea depth contours and bathymetric grid. NGDC used the ArcGIS
‘Topo to Raster’ tool to create a “hydrologically correct” surface from the contours.
4) Mediterranean Sea Bathymetry
The Mediterranean Science Commission (CIESM) has produced a morpho-bathymetric map (Fig. 6) of the Mediterranean Sea derived from multibeam swath sonar surveys [Medimap Group et al., 2005]. A 1-km grid of this data was graciously provided to NGDC by Benoit Loubrieu, Ifremer, which was used in building ETOPO1.
Figure 6. Color image of Mediterranean Sea morpho-bathymetric map. [Image from
ETOPO1 1 Arc-MinuTE GlObAl rEliEf MOdEl
7
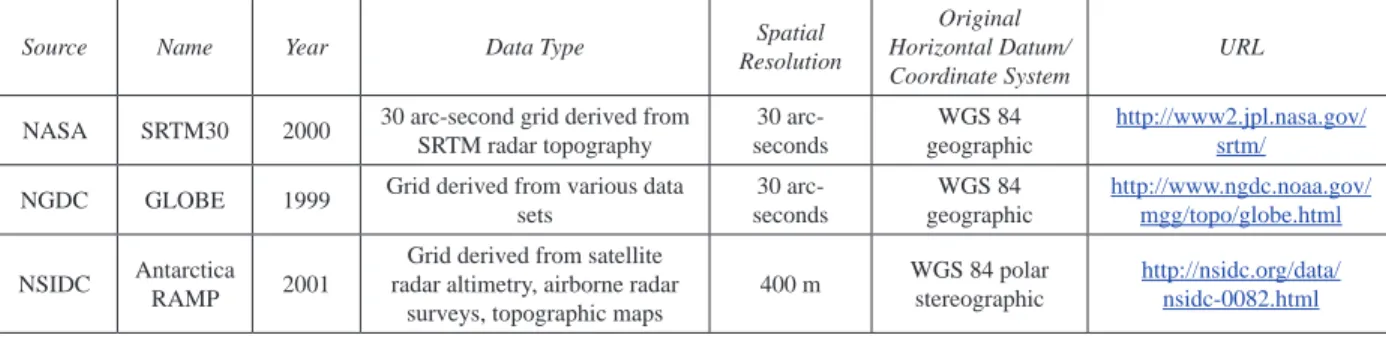
3.1.3 Topography
Topographic data sets used in compiling the ETOPO1 Global Relief Model were obtained from NGDC, NASA, and the National Snow and Ice Data Center (NSIDC; Table 4).
Table 4: Topographic data sets used in compiling the ETOPO1 Global Relief Model.
Source Name Year Data Type Spatial
Resolution
Original Horizontal Datum/ Coordinate System
URL
NASA SRTM30 2000 30 arc-second grid derived from SRTM radar topography 30 arc-seconds WGS 84 geographic http://www2.jpl.nasa.gov/ srtm/
NGDC GLOBE 1999 Grid derived from various data sets 30 arc- seconds WGS 84 geographic http://www.ngdc.noaa.gov/ mgg/topo/globe.html NSIDC Antarctica RAMP 2001
Grid derived from satellite radar altimetry, airborne radar
surveys, topographic maps
400 m WGS 84 polar stereographic
http://nsidc.org/data/ nsidc-0082.html
1) SRTM30 Global Topography
In February 2000, the Space Shuttle Endeavour flew the ‘Space Shuttle Radar Topography Mission’ (SRTM), which obtained nearly complete high-resolution digital topographic coverage of Earth between 56° S and 60° N. This data was processed into a 3 arc-second coverage database that is distributed to the public through the USGS ‘Seamless Server’. It was subsequently converted into a global topographic data set at 30 arc-second cell size by incorporating GTOPO30 gridded data into areas without SRTM data. The geodetic reference for SRTM30 is the WGS 84 EGM96 geoid. NGDC utilized the SRTM30 data between 56° S and 60° N—excluding Greenland— while eliminating ocean-surface “zero” values and GTOPO30 data outside the original SRTM survey region, though other anomalous data points had to be removed manually (e.g., Fig. 7).
Figure 7. A row of bad data, along 2°S, present in the SRTM30 data set. The bad data were manually removed before the gridding of
Amante and Eakins, 2009
8
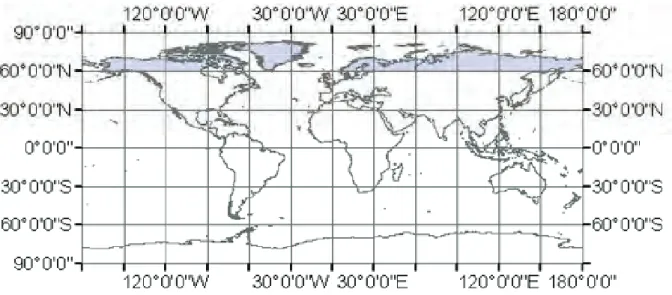
2) GLOBE Topography
The NGDC GLOBE Topography data sets provides complete 30 arc-second cell-registered coverage of global topography [Hastings and Dunbar, 1999]. The data are in WGS 84 geographic coordinates and have a sea level vertical datum. GLOBE was created from both global and regional data sources. The underlying global data sources used were Digital Terrain Elevation Data (DTED) and Digital Chart of the World (DCW). Various regional data sources included DEMs for Australia, Japan, Italy, New Zealand, Greenland, Antarctica, and for parts of South America and Asia.ETOPO1 incorporates GLOBE topographic data north of 60° N (Fig. 8)—excluding Greenland—and in a few small areas south of 56° S that have islands not represented in the Antarctic RAMP data set.
Figure 8. Coverage of GLOBE topography (blue) that was used in building ETOPO1. GSHHS coastline in gray.
3) Antarctica RAMP Topography
The Radarsat Antarctic Mapping Project (RAMP) DEM combines topographic data from a variety of sources to provide consistent coverage of all of Antarctica. Version 2 improves upon the original version by
incorporating new topographic data, error corrections, extended coverage, and other modifications [Liu et al., 2001]. The topographic data sources include satellite radar altimetry, airborne radar surveys, the recently-updated Antarctic Digital Database (version 2), and large-scale topographic maps from the U.S Geological Survey (USGS) and the Australian Antarctic Division. While most of the data has been collected during the 1980s and 1990s, some of the data originates as far back as the 1940s. The RAMP DEM was created to assist in processing RAMP radar data but it does not utilize any RAMP radar data. NGDC utilized the 400-m grid, version 2, in building the ETOPO1 Ice Surface Global Relief Model.
ETOPO1 1 Arc-MinuTE GlObAl rEliEf MOdEl
9
3.1.4 Integrated Bathymetry–Topography
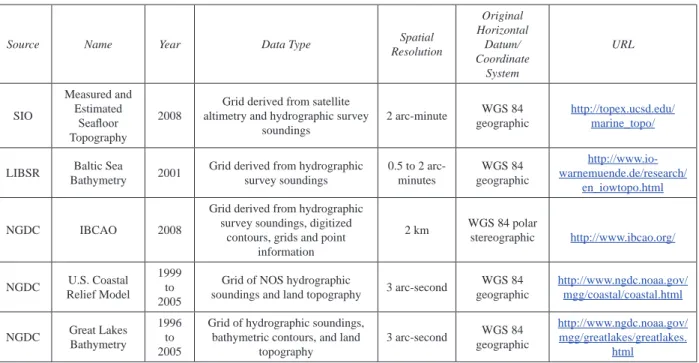
Integrated bathymetric and topographic data sets used in compiling the ETOPO1 Global Relief Model were obtained from Scripps Institute of Oceanography (SIO), the Leibniz Institute for Baltic Sea Research (LIBSR), and NGDC (Table 5).
Table 5: Integrated bathymetric-topographic data sets used in compiling ETOPO1.
Source Name Year Data Type Spatial
Resolution Original Horizontal Datum/ Coordinate System URL SIO Measured and Estimated Seafloor Topography 2008
Grid derived from satellite altimetry and hydrographic survey
soundings
2 arc-minute WGS 84 geographic
http://topex.ucsd.edu/ marine_topo/
LIBSR Baltic Sea
Bathymetry 2001
Grid derived from hydrographic survey soundings 0.5 to 2 arc-minutes WGS 84 geographic http://www.io-warnemuende.de/research/ en_iowtopo.html NGDC IBCAO 2008
Grid derived from hydrographic survey soundings, digitized
contours, grids and point information 2 km WGS 84 polar stereographic http://www.ibcao.org/ NGDC U.S. Coastal Relief Model 1999 to 2005
Grid of NOS hydrographic
soundings and land topography 3 arc-second
WGS 84 geographic http://www.ngdc.noaa.gov/ mgg/coastal/coastal.html NGDC Great Lakes Bathymetry 1996 to 2005
Grid of hydrographic soundings, bathymetric contours, and land
topography 3 arc-second WGS 84 geographic http://www.ngdc.noaa.gov/ mgg/greatlakes/greatlakes. html
1) Measured and Estimated Seafloor Topography
The Measured and Estimated Seafloor Topography grid provides a 1 arc-minute gridded representation of seafloor topography for all ice-free ocean areas within +/- 80 degrees latitude in Mercator projection [Smith and Sandwell, 1997]. Topographic data are derived from GTOPO30. Bathymetric values are derived from
known soundings and sea-surface satellite altimetry measurements, which were first used to calculate free-air
gravity anomaly and then converted to inferred ocean depths using nearby soundings both as constraints and
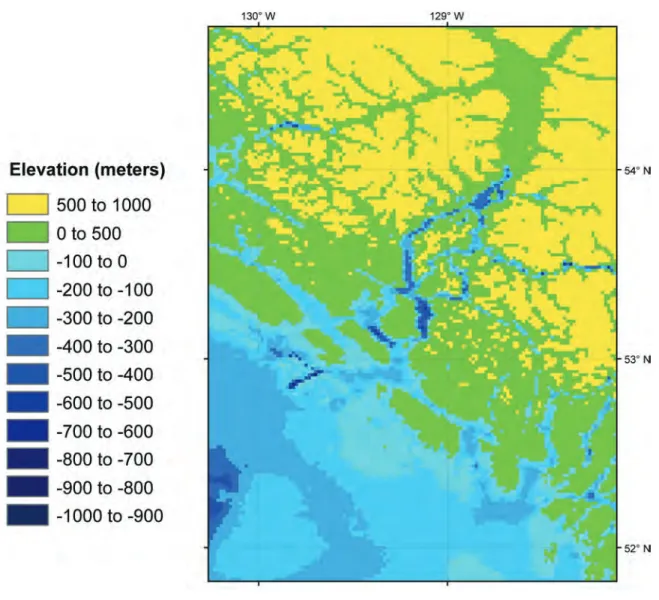
to save gravity-bathymetry relationships. Inaccuracies in the estimated seafloor grid were evident in shallow water throughout the data set (e.g., Fig. 9). NGDC down-sampled an older version of the estimated seafloor
Amante and Eakins, 2009
10
Figure 9. Anomalous depth values in the Measured and Estimated Seafloor Topography grid in
shallow coastal waters north of Vancouver Island. Depths in the grid exceed 1000 meters in many places in this region, although actual charted depths are typically on the order of a few tens of
ETOPO1 1 Arc-MinuTE GlObAl rEliEf MOdEl
11
3) Baltic Sea Bathymetry
The Leibniz Institute for Baltic Sea Research’s high resolution spherical grid topography of the Baltic Sea, 2nd edition, contains two separate grids of the Baltic Sea [Seifert et al., 2001]. The Baltic Sea grid
covers the entire Baltic Sea from 9° to 31° E and from 53°30´ to 66° N, with a resolution of 2 arc-minutes of longitude and 1 arc-minute of latitude. The Belt Sea grid contains the region of the Belt Sea from 9° to 15°10´ E and from 53°30´ to 56°30´ N, with a resolution of 1 arc-minute of longitude and 0.5 arc-minutes of latitude. In order to create a more accurate coastline, both grids used land masks derived from global high-resolution shorelines, GSHHS and RANGS (Regionally Accessible Nested Global Shoreline; http://www2008.io-warnemuende.de/homepages/rfeistel/rangs.htm). Most of the underlying data sets were sampled from sea charts of different scales. Some data sets included digitized soundings, and only Reissmann’s “Bathymetry of four deep Baltic basins” data came from ship-borne measurements. Both grids contain topographic data from GTOPO30, though only bathymetric values were used in compiling ETOPO1.
4) IBCAO Bathymetry
The International Bathymetric Chart of the Arctic Ocean (IBCAO) grid version 2.0 was created from ship track data, contours, grids and point information [Fig. 10; Jakobsson et al., 2008]. The majority of the echo sounding data was collected from surface vessels extracted from the following four archives: NGDC, the U.S. Naval Research Laboratory (NRL), the Canadian Hydrographic Service (CHS), and the Royal Danish Administration of Navigation and Hydrography (RDANH). The NGDC database was the primary source and the other three sources were used where there was not any NGDC data available. Where the ship track database information was limited in the central Arctic Ocean, contour information was derived from Russia’s Head Department of Navigation and Oceanography Bottom relief of the Arctic Ocean map. In addition,
contours were extracted from the GEBCO Digital Atlas in the southern Norwegian-Greenland Seas, in Baffin
Bay and in some areas of the Canadian Arctic. In the Gulf of Bothnia, the IBCAO grid used bathymetric data derived from the Seifert and Kayser digital grid of the Baltic Sea. NGDC extracted IBCAO bathymetric data north of 65 degrees latitude and surrounding Greenland to create ETOPO1. IBCAO topographic data of Greenland were also used in building ETOPO1. The original IBCAO grid was in polar stereographic projection and was converted to WGS 84 geographic coordinates using ArcGIS.
Amante and Eakins, 2009
12
5) U.S. Coastal Relief Model
NGDC’s U.S. Coastal Relief Model (CRM) provides 3 arc-second (~90 m) resolution for the East and West Coasts, Gulf of Mexico, Hawaii and Puerto Rico (see Fig. 11). The database extends from the coastal state boundaries to as far as the National Ocean Service hydrographic data is available, which in many cases reaches out to, and in some places even beyond, the continental slope. The bathymetric data sources include hydrographic surveys from the U.S. National Ocean Service (NOS), Monterey Bay Aquarium Research Institute (MBARI), U.S. Army Corps of Engineers LIDAR (SHOALS), and various other academic institutions. In addition, bathymetric contours from the International Bathymetric Chart of the Caribbean Sea and Gulf of Mexico were used where applicable. Topographic data are from the USGS National Elevation Data set (NED). Only bathymetric values were used in building ETOPO1.
Figure 11. Areas of the U.S. coast covered by NGDC’s Coastal Relief Model.
6) Great Lakes Bathymetry
NGDC, in cooperation with NOAA’s Great Lakes Environmental Laboratory and the Canadian Hydrographic Service, has compiled detailed vector bathymetric contours and 3 arc-second (~90 m) bathymetric grids for most of the U.S. Great Lakes. This integrated bathymetric–topographic grid was extracted at 15 arc-seconds for use in building ETOPO1.
ETOPO1 1 Arc-MinuTE GlObAl rEliEf MOdEl
13
3.1.5 Bedrock
Bedrock data sets depicting the bedrock elevation underneath the Antarctic and Greenland ice sheets were obtained from the National Snow and Ice Data Center (NSIDC), European Ice Sheet Modeling Initiative (EISMINT) and the
Scientific Committee on Antarctic Research (SCAR; Table 6).
Table 6: Bedrock elevation data sets used in compiling the ETOPO1 Bedrock Global Relief Model.
Source Name Year Data Type Spatial
Resolution Original Horizontal Datum/ Coordinate System URL NSIDC Greenland Bedrock 2001
Grid derived from satellite altimetry, Airbourne Topographic Mapper (ATM), photogrammetric digital height, ice penetrating Radar, airbourne
echo sounder 5 km WGS 84 Polar Stereographic http://nsidc.org/data/ nsidc-0092.html EISMINT / SCAR Antarctica BEDMAP 2000
Grid derived from terrestrial methods of measurement, primarily radar and seismic
soundings 5 km WGS 84 Polar Stereographic http://www.antarctica. ac.uk//bas_research/data/ access/bedmap/
1) Greenland NSIDC Bedrock
The National Snow and Ice Data Center (NSIDC) has built 5-km grids of ice surface, ice thickness and bedrock elevation for Greenland in polar stereographic projection [Bamber et al., 2001a, 2001b]. NGDC utilized the bedrock grid, resampled to 30 arc-second cell size, in building the ETOPO1 Bedrock grid. NSIDC
first created an ice-surface DEM from a combination of ERS-1 and Geostat satellite radar altimetry data,
Airbourne Topographic Mapper (ATM) data, and photogrammetric digital height data. The ice-thickness grid was derived from approximately 700,000 data points collected from a University of Kansas airborne ice penetrating radar (IPR), in addition to nearly 30,000 data points collected in the 1970s from a Technical University of Denmark (TUD) airborne echo sounder. The bedrock-elevation grid was created by subtracting the ice-thickness grid from the ice-surface grid. It is in WGS 84 polar stereographic projection, with standard parallel of latitude 71° N, projection parallel of 90° N, and 39° W central meridian.
2) Antarctica BEDMAP Bedrock
The European Ice Sheet Modeling Initiative (EISMINT) and the Scientific Committee on Antarctic
Research’s (SCAR) created the Antarctica BEDMAP grid, which contains the bedrock elevation data beneath the grounded ice sheet of Antarctica [Lythe et al., 2000]. It includes the entire geosphere south of 60° S at a nominal grid spacing of 5 km in WGS 84 polar stereographic projection. It was created from terrestrial methods of measurement, primarily radar and seismic soundings. The Antarctica BEDMAP provides an improved delineation of the boundary between East and West Antarctica. It also more accurately describes the morphology of the contiguous East Antarctica landmass, which is under an average of 2,500 meters of ice.
Amante and Eakins, 2009
14
3.2
Establishing Common Datums
3.2.1 Vertical datum transformations
Data sets used in the compilation and evaluation of ETOPO1 Global Relief Model were all originally referenced to sea level with the exception of the Caspian Sea data set. The contour intervals contained in this data set were originally referenced relative to local lake level. The grid was shifted 28 m vertically to be consistent with sea level before use in gridding ETOPO1.
3.2.2 Horizontal datum transformations
Data sets used to compile ETOPO1 Global Relief Model were originally referenced to WGS 84 geographic and WGS 84 polar stereographic. The relationships and transformational equations between these horizontal datums are well established. All data were converted to the WGS 84 geographic horizontal datum using FME software.
3.3
Digital Elevation Model Development
3.3.1 Verifying consistency between data sets
After horizontal and vertical transformations were applied, the resulting ArcGIS shape files and rasters were
checked in ArcMap for consistency between data sets. Problems and errors were identified and resolved before proceeding with subsequent gridding steps. The evaluated and edited ESRI shape files were then converted to xyz files
in preparation for gridding. Problems included:
Inconsistencies between IBCAO and the Measured and Estimated Seafloor Topography data sets in coastal
•
regions
Row of data errors in SRTM30 data set. Manual editing of the data was necessary to minimize these •
artifacts.
SRMT30 data set contains zero values over the open ocean. These values were removed using
• FME.
3.3.2 Gridding of coastal bathymetry
NGDC created bathymetric pre-surfaces in order to interpolate bathymetric data into coastal regions, which were poorly represented in some bathymetric data sets (e.g., Fig. 12). A global bathymetric pre-surface—excluding south
of 60° S—was created using the Measured and Estimated Seafloor Topography data (between -500 m and 0 m). These
data were gridded at 1 arc-minute cell size using GMT’s ‘surface’ tool. Points extracted from the GSHHS coastline were also included, at -1 m elevation, to force bathymetric interpolation into the coastal zone. The resulting surface, created in quadrangles, was clipped to the GSHHS coastline and the -120 m contour. Values between -50 and 0 m were then extracted from the clipped quadrangle grids and were used in building ETOPO1 (e.g,. Fig. 13). An Iceland
bathymetric pre-surface was also created, utilizing the Measured and Estimated Seafloor Topography bathymetric
values and the GSHHS coastline with points assigned at -5 m elevation, due to the deep fjords surrounding Iceland. This bathymetric pre-surface was also utilized in compiling ETOPO1 (see Table 7).
ETOPO1 1 Arc-MinuTE GlObAl rEliEf MOdEl
15
Figure 12. Color image of the IBCAO grid along Iceland’s northwest coast. Note the presence of
positive, topographic values in many of Iceland’s fjords. GSHHS coastline in red.
Figure 13. Color image of Iceland’s northwest coast in ETOPO1. ETOPO1 incorporates a
bathymetric pre-surface that forces interpolation of bathymetric values into coastal zones, enhancing their representation in the global relief model. GSHHS coastline in red.
Amante and Eakins, 2009
16
3.3.3 Gridding the data with MB-System
MB-System (http://www.ldeo.columbia.edu/res/pi/MB-System/) was used to create the 1 arc-minute ETOPO1 DEM. MB-System is an NSF-funded free software application that manipulates a wide variety of data types, including generic xyz data. The MB-System tool ‘mbgrid’ was used to apply a tight spline tension to the xyz data, and interpolate values for cells without data. The data hierarchy used in the ‘mbgrid’ gridding algorithm, as relative gridding weights, is listed in Table 7. The greatest weight was given to the Antarctica RAMP ice surface topography, Antarctica BEDMAP bedrock topography and the Greenland NSIDC bedrock topography data sets. Least weight was given to the global data sets and the interpolated bathymetric surface. Data were gridded in 16 regional tiles that were seamlessly
integrated to produce the final ice surface and bedrock grids.
Table 7: Data hierarchy used to assign gridding weight in MB-System.
Data set Relative Gridding Weight
Antarctica RAMP Topography 100 Antarctica BEDMAP Bedrock 100 Greenland NSIDC Bedrock 100 Gulf of California Bathymetry 10 Mediterranean Sea Bathymetry 10 JODC Bathymetry 10 Baltic Sea Bathymetry 10 IBCAO Bathymetry 10 Caspian Sea Bathymetry 10 U.S. Coastal Relief Model 10 Great Lakes Bathymetry 10 Created Iceland Bathymetric Surface 10 SRTM30 Global Topography 1 GLOBE Topography 1
Measured and Estimated Seafloor Topography 1 Bathymetric pre-surface 1
3.3.4 Registration of grids
The ETOPO1 Ice Surface and Bedrock global relief models are available in both grid/node-registration and cell/ pixel-registration. Figure 14 illustrates the differences between these two registrations. An individual grid cell in either registration has one elevation value that represents the average elevation over the extent of the cell. This value can alternatively be represented as a point at the center of the cell. The differences between the two registrations are in
how the grid ranges are defined (red lines in Fig. 14). Ranges for grid- or node-registered grids refer to the centers of
the cells that lie along the boundaries of the grid (panel A), and the footprints of the cells extend 1/2 cell width outside the range. Ranges for cell- or pixel-registered grids refer to the outside edges of the boundaries of the grid (panel B). This means for two grids with the same range, the grid-registered grid will have one more row and one more column than the cell-registered version. For global grids, a grid-registered grid has cells along the northern boundary that sit atop the North Pole, and similarly for the South Pole. Cell-registered grids have cells along the northern boundary that just touch the North Pole. Cell-registered grids are more typically used in images, while grid-registered are more commonly used for representing discrete, though averaged, point data.
ETOPO1 was built as a global, grid-registered, 1 arc-minute grid that spans from pole to pole and from -180° to 180° in longitude. It is 21601 cells by 10801 cells in dimension, with multiple duplicate cells sitting atop the North and South poles and on the -180°/180° longitude line. A cell-registered version (21600 by 10800 cells) was created from the grid-registered version by resampling, using GMT’s ‘grdsample’ tool. This resampling introduces some flattening of relief, due to averaging of four grid-registered cell values to produce one cell-registered value (see Fig. 14). Both types are global, though the grid-registered version should be considered the authoritative version. The cell-registered version may be more appropriate for creating maps and images.
ETOPO1 1 Arc-MinuTE GlObAl rEliEf MOdEl
17
Figure 14. Differences between grid-registration and cell-registration. Grid-registered grids have cells centered on
gridlines (lines of latitude and longitude for ETOPO1), while cell-registered grids have cells lying between gridlines.
3.4
Quality Assessment of the DEM
3.4.1. Horizontal and Vertical accuracy
The horizontal and vertical accuracy of topographic and bathymetric features in the ETOPO1 is dependent upon the data sets used to determine corresponding DEM cell values. Thus far, only a qualitative assessment of ETOPO1 has been performed. The GSHHS and the Antarctica Digital Database coastlines were used to assess the integration of topography and bathymetry. Further qualitative evaluation will involve the use of slope maps and 3-D perspectives in ETOPO1. A quantitative evaluation by comparing ETOPO1 with select source data sets and international nautical charts will be performed in the future.
4. s
uMMaryandC
onCLusionsETOPO1 is a global, integrated bathymetric–topographic, digital elevation model with cell size of 1 arc-minute. It is available in two versions: Ice Surface, which depicts the surface of the Antarctic and Greenland ice sheets; and Bedrock, which depicts the bedrock underneath the ice sheets. The best available digital data from diverse global and regional digital data sets were obtained, shifted to common horizontal and vertical datums, and evaluated and edited before DEM generation. The data and DEM were quality checked, processed and gridded using ArcGIS, FME, MB-System, and GMT software.
Recommendations to improve the ETOPO1 Global Relief Model include: Incorporate international hydrographic soundings in coastal waters •
Quantitatively assess by comparing to source data sets and international nautical charts •
Amante and Eakins, 2009
18
5.
a
CknowLedgMentsThe development of ETOPO1 was supported by an internship at NGDC through the NOAA Ernest F. Hollings Undergraduate Scholarship Program. The authors thank Beniot Loubrieu, Ifremer, for contributing Mediterranean Sea bathymetry. They also thank the members of NGDC’s Marine Geology & Geophysics (MGG) division for their assistance throughout the development of ETOPO1.
6.
r
eferenCesBamber, J.L., R.L. Layberry, S.P. Gogenini, A new ice thickness and bed data set for the Greenland ice sheet 1: Measurement, data reduction, and errors, J. of Geophys. Res. 106 (D24): 33773-33780, 2001a.
Bamber, J.L., R.L. Layberry, and S.P. Gogenini, A new ice thickness and bed data set for the Greenland ice sheet 2: Relationship between dynamics and basal topography, J. of Geophys. Res. 106 (D24): 33781-33788, 2001b. Caress, D. W., and D. N. Chayes, New software for processing sidescan data from sidescan-capable multibeam sonars,
Proceedings of the IEEE Oceans 95 Conference, 997-1000, 1995.
Hastings, D.A., and P. K. Dunbar, Global Land One-kilometer Base Elevation (GLOBE) Digital Elevation Model, Documentation, Volume 1.0, Key to Geophysical Records Documentation (KGRD) 34, National Oceanic and Atmospheric Adminstration, National Geophysical Data Center, Boulder, Colorado, 1999.
Jakobsson, M., R. Macnab, M. Mayer, R. Anderson, M. Edwards, J. Hatzky, H-W. Schenke, and P. Johnson, An improved bathymetric portrayal of the Arctic Ocean: Implications for ocean modeling and geological, geophysical and oceanographic analyses, L07602, Geophys. Res. Lett., 35, doi:10.1029/2008GL033520, 2008.
Liu, H., K. Jezek, B. Li, and Z. Zhao, Radarsat Antarctic Mapping Project digital elevation model version 2, National Snow and Ice Data Center, Boulder, CO, Digital media, 2001.
Lythe, M.B., D. G. Vaughan, and the BEDMAP Consortium, BEDMAP - bed topography of the Antarctic, 1:10,000,000 scale map, BAS (Misc) 9, Cambridge, British Antarctic Survey, 2000.
Medimap Group, B. Loubrieu, J. Mascle et al., Morpho-bathymetry of the Mediterranean Sea, CIESM/Ifremer edition, 2 maps at 1:2,000,000, 2005.
Seifert, T., F. Tauber, and B. Kayser, A high-resolution spherical grid topography of the Baltic Sea – 2nd edition, Baltic Sea Science Congress, Stockholm, 2001.
Smith, W. H. F., and D. T. Sandwell, Global seafloor topography from satellite altimetry and ship depth soundings,
Science, 277,1957-1962,1997.
Wessel, P., and W. H. F. Smith, A Global Self-consistent, Hierarchical, High-resolution Shoreline Database, J. Geophys. Res., 101, 8741-8743, 1996.
Wessel, P., and W. H. F. Smith, Free software helps map and display data, EOS Trans. AGU, 72, 441, 1991.
Wessel, P., and W. H. F. Smith, New version of the Generic Mapping Tools released, EOS Trans. AGU, 76, 329, 1995.
ETOPO1 1 Arc-MinuTE GlObAl rEliEf MOdEl
19
7.
d
ataP
roCessings
oftwareArcGIS v. 9.2, developed and licensed by ESRI, Redlands, California, http://www.esri.com/
FME 2008 ESRI Edition – Feature Manipulation Engine, developed and licensed by Safe Software, Vancouver, BC, Canada, http://www.safe.com/
GMT v. 4.3 – Generic Mapping Tools, free software developed and maintained by Paul Wessel and Walter Smith, funded by the National Science Foundation, http://gmt.soest.hawaii.edu
MB-System v. 5.1.0, free software developed and maintained by David W. Caress and Dale N. Chayes, funded by the National Science Foundation, http://www.ldeo.columbia.edu/res/pi/MB-System/