UNIVERSIDADE DE LISBOA
FACULDADE DE CIÊNCIAS
DEPARTAMENTO DE ENGENHARIA GEOGRÁFICA, GEOFÍSICA E ENERGIA
Development of an ammonia portable low-cost air quality
station
Ana Margarida Santos Antunes
Mestrado Integrado em Engenharia da Energia e do Ambiente
Dissertação orientada por:
Prof. Dra. Carla Silva
Acknowledgements
To my grandmother, Maria Cremilda Gomes Antunes. For all the love, all the hours, companionship, scoldings, laughs, tears, caresses, teasings. All the soups you made, all the laughs, all the care you had, all the candies and sweets (your Arroz Doce and Mousse will be passed on for generations). For the wise advices and your curiosity. For the songs you sang, for the stories you told and for your care when I was sick. Thank you for teaching me how to move around a kitchen and how to fight back in life. Thank you for all the nights and for wanting me near you. Thank you for our walks and our talks. Thank you, for everything. You will always be loved.
Resumo
A deterioração da qualidade do ar é um problema cada vez mais significativo para a saúde humana e para o ambiente. Assim, a monitorização dos poluentes, seja em espaços interiores ou exteriores, é cada vez mais necessária, de forma a aumentar a consciencialização das populações e a potenciar a criação de medidas de mitigação eficazes.
As estações de qualidade do ar de referência têm uma densidade espacial muito reduzida (uma estação por cada 1299 km2) devido aos seus elevados custos. Tendo isto em conta, o presente estudo visou
estudar e desenvolver uma estação de qualidade do ar de baixo custo, testando a sua validade e viabilidade. A estação em questão, a QAPT (acrónimo de Qualidade de Ar Para Todos), teve como objetivo a monitorização de amoníaco e outras variáveis secundárias (temperatura, T, e humidade relativa, HR), de forma a melhorar a performance do sensor de amoníaco e consequentemente do sistema num todo. O QAPT foi criado de forma a demonstrar a viabilidade do ponto que poderá pertencer, num futuro, a uma rede de monitorização da qualidade do ar de maior densidade espacial. A escolha do poluente a ser estudado, o amoníaco, adveio da necessidade de fazer uma melhor caracterização das concentrações e fontes emissores de amoníaco, uma vez que este poluente é monitorizado num número reduzido de estações de referência (ao contrário de poluentes mais conhecidos como o ozono ou partículas) e tem um elevado potencial de eutrofização e acidificação, sendo um importante precursor secundário de partículas.
Esta dissertação focou-se no estudo dos diversos sistemas da estação low-cost de qualidade do ar criada, nomeadamente, no sistema de amostragem de ar, no sistema eletrónico, no sistema de alimentação e no sistema de visualização e tratamento de dados. Assim, efetuou-se o estudo do comportamento e limitações dos diversos componentes da estação, verificando e estudando também os seus impactos no sistema como um todo. A validade da estação de baixo custo foi comprovada com a obtenção de resultados coerentes com a literatura existente aquando dos estudos do desempenho do QAPT em variados cenários, com particular ênfase na monitorização efetuada num salão de beleza e num armazém de criação de frangos. Aquando da monitorização no salão de beleza foi também possível verificar que as profissionais destes locais estão frequentemente expostas a muito elevadas concentrações de amoníaco, facto que é um perigo para a sua saúde. Os resultados obtidos na monitorização perto de estradas com muito tráfego e em cavalariças permitiu também mostrar um dos problemas mais recorrentes dos sensores de baixo custo: a falta de seletividade. No entanto há já variados estudos que se focaram na superação deste problema, sendo que os seus métodos poderão ser estudados em trabalhos futuros. Em termos económicos, a estação desenvolvida é muito satisfatória uma vez que custa apenas 133€ no seu estado atual. No entanto também se verificou que aquando futuras e eventuais melhorias, utilizando um Raspberry Pi de forma a fazer a comunicação para a cloud e ter mais espaço de memória, o protótipo fica a cerca de 165€, o que é muito satisfatório para uma estação de qualidade do ar. Não se aplicou a ligação à cloud uma vez que se verificou que esta punha em risco a portabilidade da estação pelo aumento do consumo de energia, o que inviabilizaria a autonomia do protótipo, baixando o seu tempo de monitorização de 28 horas para apenas 3 horas na melhor das hipóteses.
Neste trabalho foi também estudado o impacto da temperatura e humidade relativa no sensor low-cost de amoníaco (MQ137) que levou à criação de uma rotina (código de calibração com T e HR) de forma a minimizar o impacto de ambas as variáveis no sensor, tendo esta sido aplicada com sucesso. O sistema de amostragem desenvolvido minimiza as desvantagens de se terem colocado os sensores dentro de uma caixa, permitindo assim que o sistema funcione de forma satisfatória tanto em medições estáticas como em medições em movimento. Já na parte das ligações entre os componentes foi tida em conta a necessidade de minimizar o espaço ocupado e o peso do sistema, tal como a sua estabilidade, tendo para
isso sido feito um PCB. Em relação ao sistema de alimentação, das várias alternativas estudadas e tendo em conta os seus impactes no sistema (a nível térmico, das tensões impostas, capacidade, entre outros), verificou-se que a opção mais favorável é a utilização de um power bank solar. Por fim, verificou-se que a integração dos dados obtidos com um sistema de informação geográfica é de particular interesse quando aplicado às estações de qualidade do ar de baixo custo portáteis, facilitando a visualização espacial dos dados e consequentemente aumentando o potencial de consciencialização do sistema desenvolvido.
Palavras-Chave: estação de qualidade do ar, low-cost, portátil, sensor de amoníaco, sistema de amostragem
Abstract
Air pollution is becoming an ever-increasing problem for human health and the environment. As such, the monitorization of air pollutants, both indoors and outdoors, is increasingly necessary in order to enhance awareness and the creation of more effective mitigation measures.
The existing reference air quality stations have a very low spatial density due to their high costs. Considering this, the following study focused on the development and study of a low-cost air quality station, testing its validity and viability. The developed station, QAPT (which stands for Air Quality for All – “Qualidade de Ar Para Todos”) focused on the monitorization of ammonia and other secondary variables to improve system performance, having been built as a proof-of-concept, as a node for a broader monitorization network of high spatial distribution. The monitorization of ammonia arose from the necessity to understand in greater detail the spatial disposition of ammonia emission sources, as this pollutant is monitored in very few stations (unlike better-known pollutants like ozone or particulate matter) and has a high eutrophication and acidification potential, as well as being a secondary precursor to particulate matter formation.
This work focused on the study of the several systems of a low-cost air quality station, particularly: air sampling system, electrical connections, power supply and data visualisation and treatment. As such, the limitations of the low-cost components and their behaviour in the system are studied in detail and discussed. The station’s validity and viability, both in terms of the air quality monitorization (with consistent results from the low-cost MQ137 sensor) and total cost were assessed, laying the basic foundations for further work in the creation of nodes of a low-cost air-quality network of high spatial density.
The study assessed the impact of both temperature and humidity in the readings of the low-cost ammonia sensor (MQ137) and created a routine (calibration code) to minimise these effects, with proven success. The developed air sampling system minimises the limitations of having the sensors inside a case, thus allowing them to perform satisfyingly in both static and moving monitorization. The electrical connections were developed taking into consideration the need to ease trouble-solving and minimise volume and weight, with the creation of a PCB that allowed for greater system stability. Different power supply options and their impact on the system were studied, pointing to the advantages of using a solar power bank. Lastly, the integration of GIS software to analyse the data is proven to be of particular interest when applied to the low-cost air quality station data, improving the spatial visualisation of the data and thus enhancing the awareness potential of the system.
Table of Contents
Acknowledgements ... i Resumo ... iii Abstract ... v List of Figures ... ix List of Tables ... x List of Acronyms ... xi 1. Introduction ... 13 1.1. Framework ... 13 1.2. Objectives ... 141.3. Structure of The Thesis ... 15
2. Literature Review ... 16
2.1. Research Variables ... 16
2.1.1. Ammonia ... 16
2.1.2. Temperature and Relative Humidity ... 18
2.2. Existing AQS ... 18
3. Methodology ... 21
3.1. Component Selection and Operation ... 21
3.1.1. 𝑵𝑯𝟑 Sensor ... 21
3.1.2. Development Board ... 22
3.1.3. Temperature and Relative Humidity Sensor ... 23
3.1.4. Real-Time Clock ... 25
3.1.5. I2C Multiplexer Breakout Board ... 26
3.1.6. Micro Diaphragm gas pump ... 27
3.1.7. Visual interface ... 29
3.2. Sensor Tuning and Calibration ... 30
3.2.1. MQ137... 30
3.2.2. BME280 sensor ... 32
3.3. Data Logging and Presentation Systems ... 32
3.4. Wiring ... 34
3.5. Prototype Case Design and Build ... 35
3.6. Power Systems ... 36
3.8. GIS Integration ... 38
4. Results and Discussion ... 39
4.1. Characterisation and Reference Trials ... 39
4.1.1. Ammonia Sensor ... 39
4.1.2. Temperature and Relative Humidity Sensors ... 40
4.2. Memory usage and stability ... 46
4.3. Air Sampling System... 46
4.4. Wiring and Power Systems ... 47
4.5. Cost Analysis ... 49
4.5.1. QAPT System ... 49
4.5.2. QAPT System with Wifi – Alternative 1 ... 51
4.5.3. QAPT System with Wifi – Alternative 2 ... 52
4.6. Performance Trials and GIS Integration... 54
4.6.1. Near Road Traffic and Public Toilets ... 54
4.6.2. Horse Stable Yard ... 55
4.6.3. Hair Salon ... 56
4.6.4. Poultry Farm ... 59
5. Conclusions, Recommendations and Further Work ... 60
6. References ... 62
Annexe A - QAPT’s Code ... 66
A.1. R0 Finder ... 66
A.2. Read Time ... 67
A.3. Set Time... 69
A.4. Main Code ... 71
A.5. Temperature and Humidity Sensors Test Code ... 77
Annexe B ⋅ Thesis Flowchart ... 81
Annexe C⋅ 3D Case Studies ... 82
List of Figures
Figure 1- Development in EU-28 emissions, 2000-2016 (% of 2000 levels) – reproduced from [14] 17
Figure 2 - Typical dependence of the MQ137 on T and RH [20] ... 18
Figure 3 - APA Reference Air Quality Stations in Portugal [25] ... 19
Figure 4 - NH3 sensing methods and techniques - reproduced from [10] ... 21
Figure 5 - MQ137 Ammonia Sensor Module... 22
Figure 6 - Electric Scheme of MQ sensors modules ... 22
Figure 7 - Arduino Uno vs Raspberry Pi 3b ... 23
Figure 8 - T and RH Sensors; DHT11, DHT22 and BME280 in presentation order ... 23
Figure 9 - T and RH experiment wiring diagram made on Fritzing ... 25
Figure 10 - Telaire 7001 sensor kit ... 25
Figure 11 - Tiny RTC module back and front views ... 26
Figure 12 - TCA9548A I2C multiplexer breakout board ... 26
Figure 13 - Internal mechanisms of a diaphragm pump – reproduced from [35]... 27
Figure 14 - RS D series pump ... 27
Figure 15 - QAPTs air sampling diagram ... 28
Figure 16 - 16*2 I2C LCD ... 29
Figure 17 - RGB LED for visual cues ... 29
Figure 18 - Typical sensitivity characteristic of the MQ137 to NH3 – reproduced from [35] ... 31
Figure 19 - Electric diagram of the QAPT using the breadboard (made in Fritzing) ... 34
Figure 20 - PCB creation process ... 35
Figure 21 - QAPTs case with a computer for scale ... 35
Figure 22 - Anet A6 3D printer ... 35
Figure 23 - 3 possible ways to supply power to the QAPT ... 36
Figure 24 - RH experiment results: sensors vs reference (Telaire) ... 40
Figure 25 - T experiment results: sensors vs reference (Telaire) ... 41
Figure 26 - Absolute variation around Tmean vs abs variation around HR mean ... 42
Figure 27 - DHT11 sensors family - Abs variation around Tmean vs abs variation around HR mean . 43 Figure 28 - DHT22 sensors family - Abs variation around Tmean vs abs variation around HR mean . 44 Figure 29 - BME280 sensors family - Abs variation around Tmean vs abs variation around HR mean ... 45
Figure 30 - Thermography QAPT interior powered by battery pack ... 48
Figure 31 - Thermography QAPT interior powered by power bank ... 48
Figure 32 - QAPT components's cost distribution by section ... 50
Figure 33 - QAPT's Alternative 1 component’s cost distribution by section ... 52
Figure 34 - QAPT's Alternative 2 component's cost distribution by section ... 53
Figure 35 - Performance trial 1: car traffic and public toilets GIS track ... 54
Figure 36 - Performance trial 2: horse stable yard ... 55
Figure 37 - GIS integration: monitoring ammonia in route and hair salon ... 56
Figure 38 - Performance trial 3: Hair Salon ammonia concentration ... 58
List of Tables
Table 2.1 - NH3 concentration limits and effects, adapted from [9], [30] and [31] ... 20
Table 3.1 - Autonomy of the different power systems for several communications arrangements ... 37
Table 4.1 - Discriminated costs of the QAPT AQS ... 50
Table 4.2 - Discriminated costs of the QAPT's Alternative 1 ... 51
List of Acronyms
2G Second-generation cellular technology
ACGIH American Conference of Governmental Industrial Hygienists
APA Environmental Portuguese Agency
AQ Air Quality
AQS Air Quality Station
CCDR Commissions for Regional Coordination and Development
EMEP European Monitoring and Evaluation Program
Float Floating-point number
GIS Geographic Information System
GPRS General Packet Radio Service
GSM Global System for Mobile communications
I2C Inter-Integrated Circuit
IDE Integrated Development Environment
INT Integre
IPMA Portuguese Institute of the Sea and Atmosphere
LCD Liquid Crystal Display
LED Light Emitting Diode
MOS Metal-Oxide Sensors
NH3 Ammonia
NH4+ Ammonium
NIOSH National Institute for Occupational Safety and Health
NTC Negative Temperature Coefficient
OSHA Occupational Safety and Health Administration
PCB Printed Circuit Board
PM Particulate Matter
PM10 Atmospheric PM that has a diameter of fewer than 10 micrometres
PM2.5 Atmospheric PM that has a diameter of fewer than 2.5 micrometres
ppb Parts per Billion
ppm Parts per Million
QAPT Qualidade de Ar Para Todos
R0 Resistance of the MQ137 sensor in a 0 ammonia environment
RH Relative Humidity
RH Relative Humidity
Rs Resistance of the MQ137 sensor
SD Secure Digital
1.
Introduction
1.1.
Framework
One of the major objectives of this dissertation is to pave a way to the democratisation of air quality information, through the creation and study of the building blocks for a low-cost AQ monitoring grid, of high spatial density. This grid network will, in turn, allow researchers to make a better characterisation of the pollutants emission sources and behaviour, allowing for the creation of more effective mitigation measures.
The local AQ issue is gathering more and more visibility and relevance in the European and global panorama due to its direct impact on human health. Since the effects of exposure to poor AQ are not directly noticeable for the most part, nor immediate, but are usually only visible in long-term scenarios being associated to various negative effects on human health, there is still a very real need for the increase of awareness of the populations to this problem. For this to happen, it is imperative to increase the access and acquisition of relevant data for better characterisation and monitoring of AQ and therefore for the society to take on a more active role in the mitigation of this issue.
Although the AQ issue is, nowadays, being taken more into consideration, this is not a recent problem for the European populations. With the appearance of dense housing aggregates in cities and an increase in car traffic and industry, this issue became critical in past decades, and Europe has already come a long way from the extreme situation it had in some of its major cities in the advent of the industrial revolution. For example, London has had, since the peak of the industrial revolution, many problems of poor air quality, associated with the industries pollutants emissions. These problems remained very critical until the end of the XX century, observable, for example, with the typical smog of the 50s and 60s decades [1]. The problems with the emissions of sooth and sulphur dioxide started to subside when the industry started using smaller and smaller amounts of coal in its operation, with the implementation of guidelines and laws for the regulation of pollutants emissions and with the ever-increasing deployment of renewables (characterised by lower local pollutants emissions). Other problems have arisen with the increased number of motor vehicles, for example, with an increase in the emission of small particles and nitrogen dioxide [1].
In China, with the atmospheric pollution from heavy industries, came extreme air quality problems that became so critical the government had to apply several different measures to decrease the pollutants emissions and the exposure of the population to it, with observed success [2]. Considering this, China increased the control on the industries emissions and announced stricter ambient air quality standards [3] and has been investing heavily in nuclear and in renewable energy such as hydro, wind and solar, and in natural gas power plants (that have the advantage of having lower emissions of particulate matter than conventional liquid fuels or coal) [4].
Adverse effects to human health have been extensively observed in populations living in places with low air quality [5], such as cancer, problems of the respiratory tract, heart diseases, fertility problems and even higher levels of psychological distress [6]. In fact, the knowledge of the real risk of living in lower air quality environments is still being assessed and improved, with recent studies suggesting that the number of deaths caused by air pollution in Europe might be more than twice the number of deaths accounted in former reports [7]. Thus, it is of great importance that countries commit to improving their air quality indexes, considering not only the human health and quality of life but also considering the added economic pressure and investment the treatment of these diseases entails and all the social repercussions these problems create in their respective societies.
There is still a long way to go in solving this issue, not only in the cities, with a needed decrease in particulate matter emissions and other pollutants, but also in the rural areas, with pollutant gases like ammonia, associated with the farming sector.
The pollutant gas being addressed in this dissertation is Ammonia (𝑁𝐻3). The main emission sources of
Ammonia are in the agriculture sector (particularly livestock production) and still lack a spacially detailed characterisation because this pollutant is not usually monitored in most air quality stations. The interest in monitoring this pollutant arises from the fact that it acts as a precursor to secondary inorganic aerosols and particulate matter (mainly PM2.5), which in turn are very harmful to human health and biodiversity. This pollutant also has a major role in the increasing problems of acidification and eutrophication, resultant from its dissociation and dispersion through the atmosphere. It can also react in the atmosphere, transforming to ammonium nitrate, which can then split, when at high temperatures and low altitudes, in nitric acid and ammonia. These can be quickly deposited on the earth’s surface. This deposition acts as a fertiliser to some plants that are well adapted to a nitrogen-rich climate. Although this might look, at first sight, as a good outcome, the truth is that this is leading highly specialised flora that is adapted to low-nitrogen climates to wither. Besides, this also increases the problem of acidification of the soil and eutrophication of marine climates, also increasing nitrous oxide emissions [8]. In case of direct inhalation of gaseous ammonia (which usually only happens near the source of emission because ammonia is a short-lived chemical), the acute exposure guideline levels set by the U.S. Environmental Protection Agency for 8 hours of exposure are of 30 ppm for mild irritation, 110 ppm for acute irritation (eyes and respiratory tract) and 390 ppm being the threshold of lethality [9]. According to OSHA (Occupational Safety and Health Administration) [10], the exposure limit values are of 25 ppm for 8 hours and of 35 ppm for 10 minutes.
Considering the above mentioned, this dissertation will focus on the development of a portable, low-cost monitoring station, with the capability of building the basis module of a network for air pollutants characterisation, in this case focusing on ammonia.
1.2.
Objectives
The objective of this dissertation is to study, build and test the viability and validity of a low-cost air quality monitoring station (AQS) that focuses on the monitoring of 𝑁𝐻3 (Ammonia). In addition, it
monitors complementary variables that affect the quality of the acquired data, such as the ambient temperature (T) and relative humidity (RH). The AQS developed in this thesis is to be portable (for ease of transport and installation) and send the relevant data to an SD card to be articulated with a GIS program in order to have a spatial perspective of the distribution of emission sources. The idea of the developed AQS is to support in the future other air quality pollutants sensors, which can be used as nodes of an air quality monitoring network.
The study of the quality of the acquired data will focus on studying several phenomena associated with the normal functioning of the systems, such as the existence of electromagnetic, physical or chemical interferences or the warm-up time of the system. The developed AQS will be tested in six types of environments: a supposedly zero NH3 environment, air salon environment with hair dyes, public toilets,
horse stable yard, near busy roads and in a poultry farm. This will allow testing the AQS sensitivity to different environments. Lastly, this thesis will study the response of the built system and the influence
1.3.
Structure of The Thesis
The present dissertation has six main chapters, starting with the necessary surrounding framework and going through the several stages of the conceptualization, assembly and testing of the low-cost air quality station named QAPT (which stands for “Quality of Air For All” or in portuguese “Qualidade de Ar Para Todos”), ending with a note of recommendations for future improvements and with the code, that is the backbone of QAPT, in the appendix.
2.
Literature Review
2.1.
Research Variables
2.1.1.
Ammonia
Being one of the most important nitrogen species in the atmosphere, besides N2, ammonia (𝑁𝐻3) is
emitted in gaseous form and has a low residence time (thus only found near the emission sources). It is readily transformed in fine particulate 𝑁𝐻4+ salts by reacting with acidic substances such as sulfuric
acid, nitric acid, nitrous acid, and hydrochloric acid. The fine particulate ammonium sulphate [(𝑁𝐻4)2𝑆𝑂4 ] and ammonium nitrate [𝑁𝐻4𝑁𝑂3 ] have prolonged atmospheric residence times (approx.
6 days) and can be transported to very large distances (thousands of kilometres) [11]. In fact, several studies in Chinese and northern European cities show the real impact of this transport in urban air quality, having studied smog episodes related to far away agricultural enterprises from the North China Plain (in the case of Beijing [12]) and rises in particulate matter in some cities in Sweden [13] derived from neighbouring countries such as Germany and Poland. The large residence time and dispersion of the fine particulate ammonium salts allied to the fact that these fine particles are of very small dimension (PM2.5 and PM10) makes this an ever-increasing transboundary problem. As such, many countries have signed treaties and protocols like the Guthenberg protocol, in order to limit their national emission quotas for transboundary pollutants. Portugal has also adhered to this protocol, making its own limits (National Emission Ceilings) and to the Convention on Long-Range Transboundary Air Pollution, complying with the EMEP program (European Monitoring and Evaluation Program).
𝑁𝐻3 is mainly emitted by the agricultural sector (with the use of 𝑁 rich fertilizers), animal feedlot
undertakings (volatilization from animal waste) and biomass burning (ex: forest fires, which have been a recurrent problem in Portugal in the past years). This fact makes it very difficult to diminish ammonia emissions due to the need to grow more and more food to support the exponential growth of the human population; as so, ammonia emissions have been slowly increasing in the past six years [14], as shown in Figure 1. Together, these emission sources account on average for 80% to 99% of ammonia emissions in Europe [15]. Therefore, most of the studies of ammonia emissions are focused in rural areas, making the study of other areas necessary for a better understanding of the current panorama. Other emission sources are also known, even though at a much smaller scale, such as road traffic (because of the ammonia slip and poor combustion on automotive Otto cycle engines), industries and human waste (volatilization). In fact, recent studies show that the role of road traffic 𝑁𝐻3 emissions in cities is more
significative than previously assumed. Such has been demonstrated in several megacities in China [12] [16]. For example, in Shanghai, it was estimated that vehicle emissions contributed with 12.6% to 24.6% of the atmospheric ammonia in the urban area and between 3.8% and 7.5% for the whole Shanghai area. Interestingly, another source that might have more influence than previously assumed is the human waste, particularly biological sources like garbage containers and wastewater or solid waste treatment plants, as observed in Barcelona, particularly in more densely populated areas with a dense urban architecture that attenuates air recirculation [17].
Figure 1- Development in EU-28 emissions, 2000-2016 (% of 2000 levels) – reproduced from [14]
The impact of ammonia emissions does not stop at being a health hazard because of the inhalation of fine particles of ammonium salts or at irritating the respiratory tract when inhaled directly, but instead, it also has a huge eutrophication and acidification potential. Both the ammonium sulphate and ammonium nitrate release the ammonium ion when they are deposited in the soil, forming a small amount of acid. This reduces de pH of soil and water and ultimately leads do acidification, which harms both plant and animal life [14]. The ammonium ion will also cause eutrophication because of the excess deposition of nutrient nitrogen, which will aggravate a situation that is already critical, since EMEP estimated that the limits for eutrophication (critical loads) were exceeded in the vast majority of the European countries, with more than 61% of the European area in this situation [14].
For all the factors mentioned above, it becomes of imperative importance to reduce ammonia emissions. This reduction can be facilitated by investing in further studies, planning and characterising the emission sources and their behaviour. Some works already pave this way: a recent study [18] suggests that the most efficient season to diminish 𝑁𝐻3 emissions in order to attenuate their effects is, surprisingly, in winter, when there are naturally fewer emissions (due to a lesser deployment of fertilisers than in summer) and less volatilisation (because of lower temperatures). Considering this, the most effective reduction should happen in the agricultural sector, since it is responsible for the biggest share of emissions in winter. This study also found that by applying this and other methods to reduce ammonia to half of its actual emissions, the total amount of PM2.5 could be reduced to ¾ of its value, which would be a tremendous improvement in air quality. In the path to a better characterisation of emission sources, a biological option is being studied: the use of nitrophytic and nitrophylic lichens to monitor the spatial distribution of ammonia sources, with confirmed application [19].
2.1.2.
Temperature and Relative Humidity
These parameters affect the human levels of comfort, food supplies and many other aspects of life directly and, as such, have been subject to interest since the dawn of civilisation. The interest of this study comes in their direct impact on the measurements of ammonia concentration, because of the sensibility of the sensor to temperature and relative humidity variations. This sensibility is due to the variation of the internal resistance (𝑅𝑠) with both parameters and the respective change in calculated
ammonia concentration. This dependency can be shown in Figure 2, from the sensor's datasheet [20]. It is easily observed in the figure that small variations in temperature and humidity can lead to huge alterations of the sensor's values, being more accentuated with from -10 to 20℃.
Figure 2 - Typical dependence of the MQ137 on T and RH [20]
2.2.
Existing AQS
It is considered in this context, as a simplification, that there are nowadays three main types of air quality stations: gadget like stations, small stations, and reference stations.
The gadget like stations are portable, having been recently introduced in the markets. They are very small and lightweight, which facilitates their transport. Their cost is very low (usually bellow 200€), and their small size allows them to be transported by anyone in their quotidian. Many have built-in apps in order to visualise the data in real-time, but the measured data is usually of qualitative order because of the low accuracy of the sensors. These usually measure only one type of pollutant but are a good step in fomenting a rise in the awareness of the population concerning air quality. Examples of these stations are the British company CleanSpace [21] and the North-American AtmoTube [22].
Another type of stations are the so-called small stations, such as the station being built and studied in this dissertation. These are portable, and usually, have lesser mobility than those of the first type mentioned above. They also have more accurate sensors and usually measure several pollutants (2 or 3 pollutants concentrations in ppm or ppb). Since these stations are portable and much less expensive than the reference stations (below 2000€, although the objective in this thesis is to be even lower, below
their much larger drift), the needed adjustments to cope with the interference of other pollutants or even of electronic “noise” (electromagnetic interferences). An example of this type of stations are the Decentlab [23] stations.
Lastly, the air quality reference stations are usually implemented at a national or governmental level (ex.: in Portugal the monitorization is done with reference stations from APA and IPMA – Environmental Portuguese Agency [24] and Portuguese Institute of the Sea and Atmosphere, respectively), being organized in large networks of very low spatial density, see Figure 3 [25]. This low spatial density is mainly due to the fact that these systems are very expensive (usually far more expensive than 20 000€ because of the use of complex instrumentation) and of very large size and weight, also making them impossible to be portable. These stations produce data of very high reliability and accuracy. They measure many pollutants of interest to the human health and climate, although some of the less-studied pollutants, like ammonia, are usually not in the scope of these stations. Most of the air quality monitoring reference stations in Portugal are from APA (71 stations in total [26]), and only a few are rural stations. The spatial dispersion of the existing monitoring network is so big that there is only one station for every 1299 km2 at a national level. The spatial distribution of the stations is not
homogeneous, being concentrated in the two main CCDR [27]: Lisboa e Vale do Tejo (with one station for every 452 km2) and Norte (with one station for every 887 km2). Of this network, only two (in
Alfragide and Monte Velho), that belong to the AirBase network, are nowadays monitoring ammonium in PM2.5 and PM10 and reporting to EEA (European Environment Agency). Their available online data of ammonia measurements is flawed, being inexistent for the last eight years, excluding one value for one hour of the year 2016 in which they supposedly measured 2.44×10⁻⁴ ppmand 1.58×10⁻⁴ ppm,
respectively. IPMA, in charge of the EMEP stations in Portugal, has only three EMEP rural background stations, of which at least one monitors atmospheric ammonia along with other pollutants. The situation of ammonia monitorization in Portugal, which seems already poor given the low number of stations monitoring ammonia, is aggravated because IPMA does not possess enough qualified personnel to correctly monitor the few EMEP stations it has [28].
The stations that measure NH3 are rural background stations and they usually measure ammonia
concentrations in 𝜇𝑔/𝑚3. According to [29], the maximum value measured in these stations was of less than 10 𝜇𝑔/𝑚3 between 2013 and 2014, which is equivalent to 0.0141 𝑝𝑝𝑚 of NH3, whilst the minimum
value was of 0.20 𝜇𝑔/𝑚3, which is equivalent to 2.27×10⁻⁴𝑝𝑝𝑚 of NH
3. These values are much lower
than those measured by the QAPT station, due to the short lifetime of ammonia in the outdoor environment. Therefore, the station is best suited to measure indoor ammonia concentrations or outdoor concentrations very near emission sources, being more useful to identify emission sources than to do static monitoring of ammonia concentrations at a national level.
Regarding indoor environments, the limits are:
Table 2.1 - NH3 concentration limits and effects, adapted from [9], [30] and [31]
Concentration
Evidence
< 25 ppm
People notice the presence of ammonia at 1ppm
25 ppm for 8 hours
NIOSH’s Time-weighted average limit
35 ppm for 15 minutes
NIOSH’s and ACGIH’s short-term exposure limit50 ppm for 8 hours
Current OSHA’s time-weighted average permissible exposure limit80 ppm from 30 minutes to 2 hours
NCBI: moderate to highly intense irritationAs such, the QAPT can be used in the monitorization of these limits as its range is from 5 ppm to 200 ppm of ammonia.
3.
Methodology
This chapter will focus on the explanation of the several steps and procedures implemented during the course of this thesis. For a brief exposition on the followed methodology, consult Annexe B.
3.1.
Component Selection and Operation
In this section, a comparison is presented of various available options for the QAPT subsystems (sensors, air intake, wiring, data presentation) and the selection process of the used devices is explained.
3.1.1.
𝑵𝑯
𝟑Sensor
There is a wide option of techniques for 𝑁𝐻3 detection, but most belong to three main categories: solid-state sensing methods, optical methods and other methods [10] as can be seen in Figure 4. The sensing method used in the air quality system studied falls under the first category, with the use of a metal-oxide based sensor (MOS).
Figure 4 - NH3 sensing methods and techniques - reproduced from [10]
The MOS have been mass-produced because of their low cost, robustness, and flexibility in fabrication. The most widely used metal oxides used for 𝑁𝐻3 detection are 𝑆𝑛𝑂2, 𝑍𝑛𝑂, 𝑇𝑖𝑂2 and 𝑀𝑜𝑂3 [10]. These
sensors rely on changes in the semiconductor's conductance when exposed to reducing gases like ammonia. Unfortunately, these use high temperatures and lack enhanced selectivity and as such, it may be sensitive to other reducing gases, therefore creating “false positives” in their presence [32]. This problem can be attenuated by controlling the range of temperatures at which the sensor is working, by
NH3gas sensing methods Solid-state sensing methods Metal-oxide based sensors Conducting polymer sensors Optical Methods Tunable diode laser spectroscopy Other Methods Electrochemical sensors Surface Acoustic Wave sensors Field effect transistor sensors
creating alloys with the metal-oxides and noble metals or by adding structures of nanocomposites to the top layer of the metal-oxides, enhancing sensing performance towards 𝑁𝐻3.
The sensor used in this work is the 𝑀𝑄137 (see Figure 5) which uses 𝑆𝑛𝑂2 as semiconductor. This is a
non-transition-metal oxide. Its work is based on redox reactions between the surface of the metal and the measured gas. The molecules of 𝑂− react with the gas and alter the resistance of the sensor (𝑅𝑠),
which in turn results in a change in the voltage between the analogue signal and the ground pin (see electric scheme in Figure 6).
Figure 5 - MQ137 Ammonia Sensor Module Figure 6 - Electric Scheme of MQ sensors modules
The MQ137 sensor was chosen for its good price-quality ratio, getting reasonable measurements with a small initial investment. A very sturdy sensor that is easily and affordably accessible (easier to replace when needed), the MQ137 is also Arduino compatible (analogue output), which was another reason for its choice. Besides, by developing the connections to this sensor, QAPTs use can be easily extended to other sensors of the MQ sensor family, allowing it to measure various other air pollutants, which makes the QAPT a possible universal air quality monitoring system, being an important feature of the developed system. This sensor can measure ammonia concentrations from 5 to 200 ppm. These concentrations are quite high when compared to those measured in reference air quality stations, as was mentioned in sub-chapter 2.2. As such, it is evident that this sensor is best suited for indoor measurements and characterisation of emission sources (that naturally present much higher concentrations of ammonia), such as industry or poultry farms.
3.1.2.
Development Board
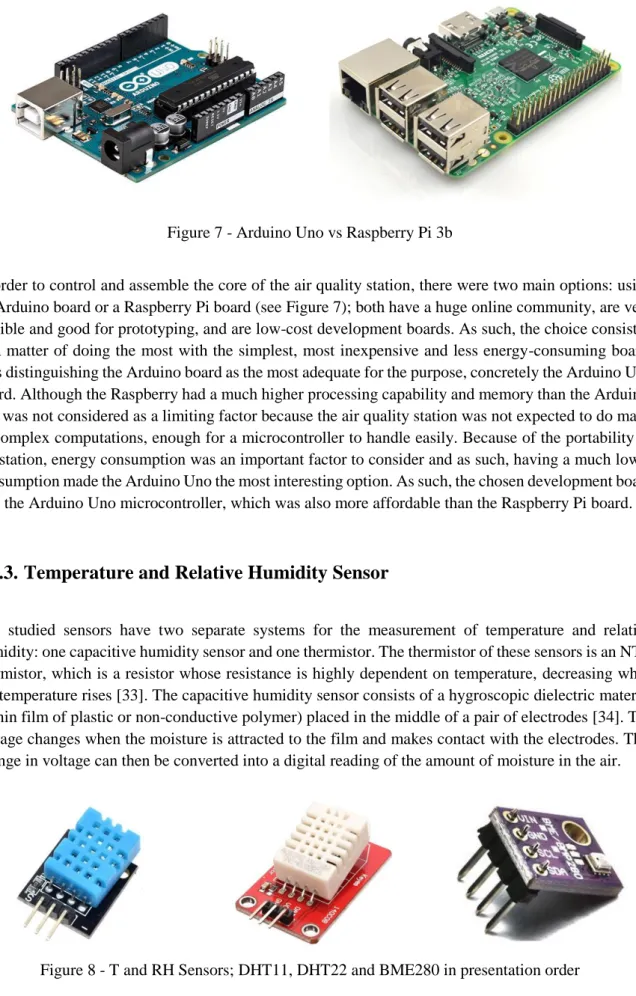
The Arduino Uno is an Italian microcontroller development board based on the ATmega328P that is open-source and prototype oriented. With 14 digital pins and six analogue pins, this small board is capable of running a simple program (always one at a time) written in its own editor, the Arduino IDE, in the LUA programming language, that is somewhat similar to the C language. This board has a relatively slow Clock (16MHz) and supports I2C and SPI protocols. It can be powered directly from a computer USB port, from an external power source by a DC jack or by the Vin pin.
Figure 7 - Arduino Uno vs Raspberry Pi 3b
In order to control and assemble the core of the air quality station, there were two main options: using an Arduino board or a Raspberry Pi board (see Figure 7); both have a huge online community, are very flexible and good for prototyping, and are low-cost development boards. As such, the choice consisted of a matter of doing the most with the simplest, most inexpensive and less energy-consuming board, thus distinguishing the Arduino board as the most adequate for the purpose, concretely the Arduino Uno board. Although the Raspberry had a much higher processing capability and memory than the Arduino, this was not considered as a limiting factor because the air quality station was not expected to do many or complex computations, enough for a microcontroller to handle easily. Because of the portability of the station, energy consumption was an important factor to consider and as such, having a much lower consumption made the Arduino Uno the most interesting option. As such, the chosen development board was the Arduino Uno microcontroller, which was also more affordable than the Raspberry Pi board.
3.1.3.
Temperature and Relative Humidity Sensor
The studied sensors have two separate systems for the measurement of temperature and relative humidity: one capacitive humidity sensor and one thermistor. The thermistor of these sensors is an NTC thermistor, which is a resistor whose resistance is highly dependent on temperature, decreasing when the temperature rises [33]. The capacitive humidity sensor consists of a hygroscopic dielectric material (a thin film of plastic or non-conductive polymer) placed in the middle of a pair of electrodes [34]. The voltage changes when the moisture is attracted to the film and makes contact with the electrodes. This change in voltage can then be converted into a digital reading of the amount of moisture in the air.
In order to measure the temperature and relative humidity, there were three main options: the DHT11 sensor, the DHT22 sensor, and the BME280 sensor (see Figure 8). The two first ones differed mainly in the response speed and slightly in the accuracy, a factor that, at first, pointed at a superiority of the DHT22 over the DHT11. Even so, being both very popular amongst the online maker community and costing approximately the same, they were both considered of interest to the subsequent studies. The BME280 had more supporters in the online maker community and not only measured temperature and relative humidity but also the atmospheric pressure, ergo also the approximate altitude, and was in the same price range as the other two sensors. As such, this was, from the beginning, considered the most promising sensor.
In order to establish which was the most appropriate sensor for the QAPT AQS, a comparison experiment was undertaken: 2 sensors of each sensors family (2 DHT11, 2 DHT22 and 2 BME280) and one reference sensor (GE Telaire 7001) monitored, for a period of 3 days, the ambient temperature and relative humidity and proceeded to the respective data logging.
The Telaire sensor had its own separate data logging system and as such, no additional connections were needed besides the connection to a computer. In order to do the data logging of the remaining sensors data, an SD card module was connected to the Arduino and the corresponding code was written in the Arduino IDE. This code occupied more of the microprocessors storage than expected, making the system unstable and as such, the code was subject to several stages of optimisation for the problem to be solved. These optimizations were mainly simplifications of mathematical functions (ex: using power function instead of logarithmic function), of the monitored data storage usage (ex: treating data as ints instead of floats) and reduction of the number of “heavy” storage usage functions (ex: reduction of the number of strings used in the code). For the connection and communication of the BME280 sensors with the microcontroller, the need for an I2C multiplexer arose and as such this element was introduced in the
systems circuits configuration.
Another requirement for the data logging was the use of an RTC in order to have the timestamps associated with the measured data and be able to compare the data of the different sensors. The measurements were performed with a set interval of 1 minute, which was considered a reasonable interval taking into account the temperature and relative humidity velocity of variation in the enclosed environment being monitored. This experiment was conducted from 13 of April to 16 of April 2019. The acquired data from the six sensors being tested was linearly interpolated in order to be compared with the reference sensor as the measurement interval had some lag derived from the Arduino processing. The small lag distributed across the monitoring interval acquired a larger significance (total of 42 seconds difference in the end) and had to be addressed.
The final wiring diagram of the experiment can be seen in Figure 9 and the reference sensor and datalogger in Figure 10, respectively.
Figure 9 - T and RH experiment wiring diagram made on Fritzing
Figure 10 - Telaire 7001 sensor kit
3.1.4.
Real-Time Clock
A real-time clock (RTC) is an inexpensive integrated circuit that keeps the time and date updated, being usually found in most computers and servers. Much like an everyday wristwatch, the RTC maintains track of time by counting the cycles of an oscillator – a piezoelectric crystal – usually quartz. This information is then transmitted to a microprocessor by an SPI or I2c serial bus and can be readily converted to time, date, day of the week, day of the month or even gap years.
One of the essential features of this integrated circuit is its ultra-low power consumption. This allows the circuit to run with only a coin battery for long periods of time and gives it autonomy from the power
source of the main circuit, allowing the RTC to keep running with the updated time and date even when and after the main circuit is turned off.
The RTC module used in the AQS in study is the Tiny RTC (see Figure 11), which is based on the clock chip DS1307 that communicates with the I2C protocol.
Figure 11 - Tiny RTC module back and front views
Initially, the RTC used in the AQS was a DS1302 RTC module. This module, acquired online, was used in the first experiments and presented stability problems, such as stopping for a little time and then continuing. This led to the acquisition of another RTC, the DS1307 Tiny RTC module. This new module did not present problems and needed less Arduino pins because it communicated through I2C protocol
and was connected to the TCA9548A I2C multiplexer breakout board.
3.1.5.
I2C Multiplexer Breakout Board
An I2C multiplexer breakout board is an integrated circuit that allows a microprocessor to communicate with several same-address I2C devices. These breakout boards have multiple I2C addresses (multiple SDA and SCL pins) that can mask the original I2C address of the connected devices, allowing for a clear communication between the microprocessor and, for example, several sensors of the same family. Besides, when using microprocessors with limited I2C compatible pins (the Arduino Uno has 2 SDA pins and 2 SCL), this board increases the amount of I2C devices one can connect to the microprocessor. The multiplexer used in this dissertation is the TCA9548A (see Figure 12), which has eight different I2C addresses.
3.1.6.
Micro Diaphragm gas pump
A micro gas pump is a pump of very small dimensions that is built to work with a small flow rate of gas - in this case, a small flow rate of air. The most common types of pumps for this small size and flow rates are diaphragm pumps, peristaltic pumps, and linear pumps. These micro pumps are lightweight, which is an important factor in systems of reduced dimensions. The micro diaphragm gas pump does not need lubricants and as such, it has a contamination-free pumping. This kind of pumps is more resistant to corrosion than other pumps (important because the air samples might have considerable amounts of corrosive fluids) and has a long service life.
Diaphragm pumps use pressure or vacuum to transfer the fluid between the inlet and outlet valves. This pressure/vacuum is created by the upwards and downwards movement of a diaphragm (see Figure 13) that is clamped to an eccentric connection rod, connected to the axis of a dc motor.
The micro eccentric diaphragm gas pump used in the AQS in study is an RS D series pump (see Figure 14 - RS D series pump) with an adjustable flow rate that can be controlled with a simple difference in the voltage applied to the pumps terminals (input voltage from 3V to 4.5V). It is of small size and weight, which is important for the portability of the whole system.
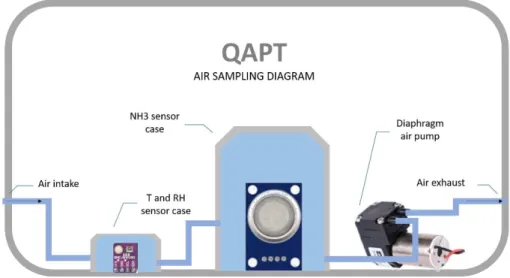
In its initial configuration, the air sampling system was not separated from the electrical system, and the air inlet was made through inlet fins and the use of a fan. This caused some problems to arise: the heat from the circuitry would heat up the enclosed air and as such, the temperature would rise and the relative humidity would fall. The study of the distribution of the system’s temperature was made by conducting a series of infrared thermographies to the QAPT’s interior, for the different types of power connections, as can be consulted in annexe D. It was also impossible to change the flow of air being analysed. As an improvement, the two systems were separated by making use of a micro diaphragm gas pump. Therefore, the system became capable of sampling the outside air having accurate outside air temperature and humidity measurements, also becoming able of, if needed, varying the sampling flow, by changing the voltage at the terminals of the pump, for example by using a digital potentiometer (of interest to maintain the isokinetism of the flow in moving measurements in future works). Besides, the pump also had the advantage of being able to extract air without the risk of having lubricants interfering
Figure 13 - Internal mechanisms of a diaphragm
with the measurements of the analysed air samples. The air sampling system diagram, which can be seen in Figure 15, shows that the air goes first through the temperature and relative humidity sensor and only after that through the ammonia sensor. This order was implemented since the ammonia sensor has a resistance that dissipates heat and it would otherwise interfere with the measurements of the temperature and relative humidity sensor.
3.1.7.
Visual interface
In order for the user of the AQS to interpret with ease and have real-time access to the most relevant measured data, two systems were installed: an LCD and an RGB LED. The LCD communicates with the microcontroller through the I2C protocol. The installed LCD (see Figure 16) allows writing digits in two rows and sixteen columns, which is enough to write some initial indications of the AQS status and other relevant data. The RGB LED has the ability to give a qualitative character to the information by adjusting its colour with the concentration of ammonia.
3.2.
Sensor Tuning and Calibration
3.2.1.
MQ137
For the lack of a reference 𝑁𝐻3 sensor, the calibration procedure followed in this work was the
application of the factory parameters. This mathematical method of calibration has inherent errors because the factory results are for a generalised conception of the MQ137 family sensors in very restrict testing environments. As such, given that each sensor should be individually calibrated for its own errors, this procedure will have some limitations.
The MQ137 sensor, being an analogue sensor, had to have its output (analogue variation in the Arduino pin) converted to meaningful variables. As such, firstly the output had to be converted to a voltage variation with (3.1),
𝑀𝑄137 𝑣𝑜𝑙𝑡𝑎𝑔𝑒𝑜𝑢𝑡𝑝𝑢𝑡 = 𝑎𝑛𝑎𝑙𝑜𝑔𝑜𝑢𝑡𝑝𝑢𝑡× ( 5
1023) (3.1)
and, with equation (3.2), to a physical variable, the 𝑅𝑠, which is the resistence of the sensor when exposed to a certain amount of 𝑁𝐻3.
𝑅𝑠=
5×𝑅𝐿
𝑀𝑄137 𝑣𝑜𝑙𝑡𝑎𝑔𝑒𝑜𝑢𝑡𝑝𝑢𝑡− 𝑅𝐿 in 𝑘Ω (3.2)
Where 𝑅𝐿 is the resistance load of the MQ137 module, in this case, 1 𝑘Ω.
The baseload resistance (𝑅0) of the sensor had to be known to calculate the concentration of ammonia.
For this, the sensor had to be heating two days in a row in a 0 ammonia environment in order to calculate the 𝑅0 with the R0 code in annexe, through a series of monitoring loops to average the 𝑅0 value. Knowing
R0, it was then possible to calculate the concentration of the gas (in this case 𝑁𝐻3 in ppm) by following
the equation that depends on the 𝑅𝑠/𝑅0 ratio, which was deduced from the sensors datasheet graphic in
Figure 18 - Typical sensitivity characteristic of the MQ137 to NH3 – reproduced from [36]
The equation obtained from the power regression was a good fit to the points taken from the datasheet (𝑅2= 0.9986) and so, solving for the concentration of ammonia, equation (3.3) was used in the code,
as can be seen in annexe.
[𝑁𝐻3] = ( [𝑅𝑠 𝑅0] 0.587) −0.2571 in ppm (3.3)
The MQ137 sensors are extremely dependent on temperature and relative humidity variations, a factor that led to their monitorization in the station in order to attenuate the effect with data calibration. This calibration was done by consulting the graphic in Figure 2 from the MQ137 datasheet [20] and plotting the data, finding the equations to the variation of 𝑅𝑠/𝑅0 with T and RH through second order
polinomial interpolations. The routine written in the code in annexe was created using intervals of action (from 0 to 59% of RH and from 59% upwards) in order to follow one or another of the two possible equations (see equation (3.4) and (3.5) for the calibration with temperature and humidity (variation based on the 33%RH equation or the 85%RH equation).
{ 𝑅𝑠 𝑅033%= 0.0003𝑇1 2− 0.0255𝑇 1+ 1.4004 , 𝑖𝑓 0% < 𝑅𝐻 < 59% 𝑅𝑠 𝑅085% = 0.0003𝑇1 2− 0.0231𝑇 1+ 1.2808 , 𝑖𝑓 𝑅𝐻 ≥ 59% (3.4)
y = 0.587x
-0.257R² = 0.9986
0.000 0.100 0.200 0.300 0.400 0.500 0.600 0.700 0 50 100 150 200 250 Rs /R0 [NH3] in ppm{ 𝑅𝑠 𝑅0 𝑐𝑎𝑙𝑖𝑏𝑟𝑎𝑡𝑒𝑑33%= 𝑅𝑠 𝑅0𝑚𝑒𝑎𝑠𝑢𝑟𝑒𝑑 𝑅𝑠 𝑅033% , 𝑖𝑓 0% < 𝑅𝐻 < 59% 𝑅𝑠 𝑅0 𝑐𝑎𝑙𝑖𝑏𝑟𝑎𝑡𝑒𝑑85%= 𝑅𝑠 𝑅0𝑚𝑒𝑎𝑠𝑢𝑟𝑒𝑑 𝑅𝑠 𝑅085% , 𝑖𝑓 𝑅𝐻 ≥ 59% (3.5)
For the calculation of the calibrated ammonia concentration equation (3.3) is still used, with the only difference being the use of the calibrated air fraction, instead of the originally calculated without accounting for temperature nor relative humidity.
3.2.2.
BME280 sensor
The comparison experiment with temperature and relative humidity sensors allowed, amongst other things, for a comparison with a reference sensor. As such, the chosen sensor was calibrated in relation to the reference sensor. For this, the mean error between them was calculated for both variables and added to the values of temperature and relative humidity in order to approximate the BME280 readings to the correct values.
Therefore, the final values of T and RH present in the code in annexe follow the following equations (3.6):
{
𝑇𝑐𝑎𝑙𝑖𝑏𝑟𝑎𝑡𝑒𝑑= 𝑇𝑚𝑒𝑎𝑠𝑢𝑟𝑒𝑑+ 𝑇̅̅̅̅̅̅̅̅𝑒𝑟𝑟𝑜𝑟
𝑅𝐻𝑐𝑎𝑙𝑖𝑏𝑟𝑎𝑡𝑒𝑑 = 𝑅𝐻𝑚𝑒𝑎𝑠𝑢𝑟𝑒𝑑+ 𝑅𝐻̅̅̅̅̅̅̅̅̅̅𝑒𝑟𝑟𝑜𝑟 (3.6)
3.3.
Data Logging and Presentation Systems
Initially, the data logging was to be made by two means: locally, to an SD card, and to the cloud through wi-fi with the aid of a wi-fi module or 2G with the aid of a GSM/GPRS module. The local data logging was successfully implemented and its code, for which the work of [37], [38], [39] and [40], served as stepping-stones, can be consulted in annexe. As for the communication to the cloud, several problems arose, causing various delays in the process, which in turn difficulted the possibility to establish this way of communication of the monitored data. The Arduino Uno does not have embedded wi-fi communication and therefore, the use of a module was required. The chosen wi-fi module was the
responding as they should, tested for all available baud rates, many attempts were made trying several set procedures, like, for example, flashing the ESP8266 module). Leaving the wi-fi module, another option was explored: 2G communication through the SIM900 GPRS module. This module had the advantage of having better documentation and being able to communicate to the cloud even in most remote locations (2G network is a vast network, although it is slowly being decommissioned). This module was more expensive than the first one and had a much higher power consumption. Unfortunately, the delays caused by the ESP8266 esp-01 did not leave much time to explore this line of work and as such, the communication to the cloud feature was not achieved in due time. Some alternatives were already explored (e.g.: using a Raspberry Pi board) and are listed in Chapter 5. However, upon studying the autonomy of the system in chapter 3.6, with and without this feature, it was verified that the communication to the cloud feature would undermine the viability of the station, diminishing its autonomy dramatically, which in turn diminished the system’s portability.
For ease of interpretation of the locally presented data in real-time, an RGB LED (see Figure 17) was installed to use visual cues. The LED communicates with the microcontroller through three digital pins. These visual cues consisted of the LED varying its colour with the concentration of ammonia, emitting red light for high concentrations (above 80 ppm of 𝑁𝐻3), green light for low concentrations (below 25
ppm of 𝑁𝐻3), and blue light for the values in between (from 25 to 80 ppm of 𝑁𝐻3). These visual cues
allow most of the people to understand their situation because the colours are intrinsically associated with good (green) or bad (red) feelings, bypassing the need to understand the quantitative meaning of the presented data. For a local quantitative display of the information, the LCD displays the waiting time and the three main variables being monitored: temperature, humidity and ammonia concentration; communicating through the I2C protocol and thus being connected to the I2C multiplexer breakout board.
3.4.
Wiring
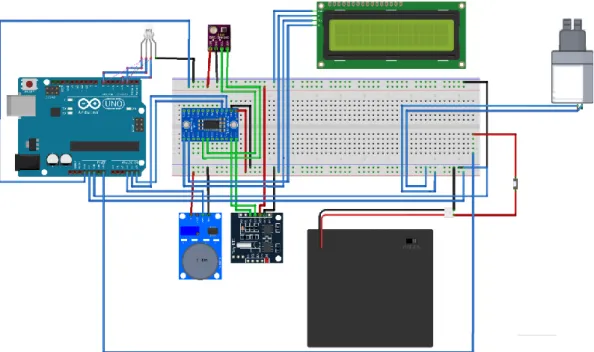
The electric system of the QAPTs AQS started out as many prototypes do for testing: with a simple breadboard and jumpers to connect the various devices. This first form was good for experimenting when learning how to make the necessary connections but, as the circuit started to incorporate more devices, it became very intricate because of the number of jumpers used. This not only made the system very sensitive to movements in the device (the jumpers could easily be inadvertently disconnected from their places in the breadboard) but it also made it difficult to do trouble solving if any of the jumpers were unintentionally pulled. The electric circuit using the breadboard went through several stages of tests and devices used, having ended up as can be seen in Figure 19. This system included the following devices: an Arduino Uno board, an RGB LED, an MQ137 module, a BME280 sensor, a TCA9548A I2C multiplexer breakout board, a 16 × 2 LCD, a Tiny RTC module, a pack of eight AA batteries connected in series, an on/off switch and a micro diaphragm air pump.
Figure 19 - Electric diagram of the QAPT using the breadboard (made in Fritzing)
In order to make the circuitry more robust, enabling the QAPT to be used in field conditions, for example, being carried or monitoring in movement, the breadboard and jumpers connections were replaced by a PCB (printed circuit board). This PCB occupied a smaller volume in the case and was designed in Fritzing, being made using a transference method with acetone from the paper to the copper sheet. The paint from the paper was transferred and protected the copper from being etched by the ferric chloride bath, leaving only the finished PCB circuit. The PCB was drilled according to the needed connections and the devices were then soldered into it. The process can be seen in Figure 20.
Figure 20 - PCB creation process
3.5.
Prototype Case Design and Build
In order to have efficient space utilisation and meet all its specific needs, the case of the QAPT AQS was designed from scratch using SketchUp. This allowed to easily create the three-dimensional design of the case, which went through several forms that varied mainly in the type of air inlet. The two main case types were 3D printed: the case with inlet fins, that was adapted to the use of a fan, and the case with the small opening, adapted to the use of the micro diaphragm pump for the closed air sampling system (see photos in annexe C). The latter case, as seen in Figure 21, was printed in several segments in an Anet A6 3D printer (printing time of approximately 22 hours), which can be seen in Figure 22.
Figure 21 - QAPTs case with a computer for scale Figure 22 - Anet A6 3D printer
The printed case has a slot for the battery pack, making it easily accessible from the bottom in order to change the batteries if needed, without giving access to the interior of the station. The case is divided into two parts: the main body and lid. This lid is made so as to when removed, expose both the back and the upper side of the QAPT AQS in order to facilitate access to the interior. This makes the monitoring and exchange of sensors and other devices easier.
The case is more resistant to corrosion than normal metallic cases because it is made of a very durable plastic: PLA (Polylactic Acid). This plastic is biodegradable and can easily be recycled because it is a “thermoplastic” polyester, maintaining its properties without significant degradation when melted for other uses. This case allows the QAPT to be connected to a computer or be autonomous and has a switch that allows the user, when in autonomous mode, to turn the station on or off. As a detail, it has the name of the station inlaid in the front of the case.
3.6.
Power Systems
The QAPT station was initially powered only via a USB B cable connected to a computer. This alone did not allow the system to be portable and, as such, other alternatives were studied to complement the power system. Given that the Arduino needs a power source with a voltage of approximately 9 to 12V when powered through the Vin pin, the first portable solution for the system was a simple 9V battery.
This had the inconvenient of lasting very little time, which compromised the portability of the system, and of being a costly battery. Moving on, two other alternatives were studied: the use of a solar power bank and the use of a battery pack.
The solar power bank, as most of the power banks, had an output voltage of 5V and a maximum current of 2100mA, with the connection to the Arduino being made through the USB port. As expected, the power bank took a long time to charge with the sunlight, which could be a problem because the system consumed power faster than it recharged. As such the battery pack was also added and incorporated in the QAPT station, as a backup system with 8 rechargeable AA batteries connected in series (9,6V total voltage and 2500mAh capacity). The three possible vias to supply power to the QAPT are shown in Figure 23.
Figure 23 - 3 possible ways to supply power to the QAPT
The total current drawn by the QAPT AQS was measured with a multimeter in series, being of 270mA. With this value and with the capacity of the power bank and battery pack, the autonomy of the system was calculated: with both systems fully charged the QAPT AQS had an autonomy of approximately 28 hours of continuous monitoring.
In order to do the dimensioning of the system for future communication to the cloud, it was observed that the autonomy of the system would be much lower in this situation. This is true be it with the use of a GPRS module (consumption of approximately 2.1A) or with the use of a Raspberry Pi board (“Rasp”), as will be further discussed in chapter 5 (consumption of approximately 2.5A). The vast differences in autonomy can be seen in Table 3.1.
Table 3.1 - Autonomy of the different power systems for several communications arrangements
Capacity
Autonomy
Autonomy
with GPRS
Autonomy
with “Rasp”
9V battery
550 mAh 2.0 h 14 min 12 minSolar Power
Bank
5000 mAh 18.5 h 2.1 h 1.8 hBattery Pack
2600 mAh 9.6 h 1.1 h 56 minPower Bank
plus batteries
7600 mAh 28.1 h 3.2 h 2.74 h3.7.
Performance Trials
Tests to the response time, to the heating time and to the stability of the ammonia sensor were made. These led to the subsequent improvements of the code that allowed to achieve more significant results in the monitoring process, such as making an arithmetic mean of three seconds to lower the effect of the MQ137 instability in the monitored data or implementing a waiting period of 15 minutes before starting the measurements for the sensor's resistance to heat up.
In order to perform tests with the QAPT in real-life scenarios, 5 locations/trial situations were chosen: public toilets, near road traffic, horse stable yard, poultry farm, and a hair salon. These trial scenarios were chosen because they had eventually higher amounts of ammonia.
The two first scenarios (near road traffic and public toilets) were tested in one trial that combined both in a walk along a busy road ending in a public bathroom. This walk had a duration of approximately 50 minutes of monitoring.
The horse stable yard was visited on a cold and windy day. The horse's stables were located on a porch inside a farm. They were cleaned every morning and the experiment consisted of monitoring with the AQS the stables for approximately one hour in which the horse's beds were tested as well as the area around their stables.
The hair salon was studied in a period of monitorization of approximately 2 hours in which most of the time the QAPT was static, having only been displaced when a different product was used or when moving from a less ventilated room to another with better ventilation in order to study the influence on ammonia concentrations.
Finally, the poultry farm was visited on a warm day and the monitorization was carried out in a space with thousands of poults that had been in that same space for approximately four weeks. The trial was again done in motion to study the spatial distribution of the monitored data.
The data from the monitorization of the different scenarios was logged to the SD card and later studied and used in the following sub-chapter.
3.8.
GIS Integration
Two of the trials, the first one and the one at the hair salon, were made with a simple addition: the use of a cellphone GPS. The phone recorded the locations and their respective timestamps during the monitorization. This data was logged to a CSV file which was later complemented with the data logged data from the QAPT. The file was then used as an input in the free GIS program QGIS. In the program, it was then possible to map the monitoring route and show the spatial distribution of the measured concentrations of ammonia.
![Figure 1- Development in EU-28 emissions, 2000-2016 (% of 2000 levels) – reproduced from [14]](https://thumb-us.123doks.com/thumbv2/123dok_us/11083710.2995050/19.892.117.770.114.544/figure-development-eu-emissions-levels-reproduced.webp)
![Figure 2 - Typical dependence of the MQ137 on T and RH [20]](https://thumb-us.123doks.com/thumbv2/123dok_us/11083710.2995050/20.892.193.699.336.612/figure-typical-dependence-mq-t-rh.webp)
![Figure 3 - APA Reference Air Quality Stations in Portugal [25]](https://thumb-us.123doks.com/thumbv2/123dok_us/11083710.2995050/21.892.270.625.689.1073/figure-apa-reference-air-quality-stations-in-portugal.webp)
![Figure 4 - NH 3 sensing methods and techniques - reproduced from [10]](https://thumb-us.123doks.com/thumbv2/123dok_us/11083710.2995050/23.892.129.745.511.1051/figure-nh-sensing-methods-techniques-reproduced.webp)