DEVELOPMENT OF NEW KNOWLEDGE
DISCOVERY TOOLS TO EXPLORE BIOMEDICAL
DATASETS IN BREAST CANCER
Nathan Stuart Hill
PhD
January 2009
Tenovus Centre for Cancer Research
Welsh School of Pharmacy
Cardiff University,
Cardiff
CF10 3NB
UK
UMI Number: U584574
All rights reserved
INFORMATION TO ALL USERS
The quality of this reproduction is dependent upon the quality of the copy submitted. In the unlikely event that the author did not send a complete manuscript and there are missing pages, these will be noted. Also, if material had to be removed,
a note will indicate the deletion.
Dissertation Publishing
UMI U584574
Published by ProQuest LLC 2013. Copyright in the Dissertation held by the Author. Microform Edition © ProQuest LLC.
All rights reserved. This work is protected against unauthorized copying under Title 17, United States Code.
ProQuest LLC
789 East Eisenhower Parkway P.O. Box 1346
Summary
The explorative power o f high throughput technologies in cancer research has become well
established in recent years, exemplified by diverse gene microarray studies. However,
development o f the necessary biomedical data analysis tools has historically been confined to
a commercial environment, while comprehensive, user-friendly analysis approaches are still
needed. Availability of freely-available software, notably the ‘R’ project statistical
programming language, allowed development of a user-friendly multivariate statistics
application - Informatics Tenovus (I-10) - in this project. I-10 provides a platform through
which powerful existing and future ‘R’ project statistical analysis methodologies can be
applied, without prior programming knowledge. The new system was tested in the context of
exploring antihormone resistance in breast cancer, analysing microarray datasets from in vitro
models of acquired Tamoxifen (TAMR) or Faslodex resistance (FASR) versus endocrine
responsive MCF-7 cells. The analysis not only revealed known de-regulated genes, but also
further potential future markers/targets for endocrine response/resistance. The advantages of
the ‘R’ programming environment together with Microsoft Visual Basic.net technology for
producing user-friendly biomedical analysis tools facilitated subsequent development of a tool
which could explore SEER cancer patient datasets. This new cancer query survival tool
-Superstes -allows detailed statistical modelling of the impact that multiple patient attributes
(in this instance derived from the SEER breast and colorectal cancer datasets) have on patient
survival. The versatility of ‘R’ was additionally demonstrated in further exploring classifiers,
where it was able to interface with the sophisticated, freely available machine learning
application ‘Weka’. Using ‘R’ and Weka, breast cancer patient survival was modelled using
equivalent patient attributes to the Nottingham Prognostic Index and a 10 year survival subset
of the SEER breast cancer dataset. Several machine learning methodologies were compared
for their ability to accurately model survival, with their value in routine clinical use for
prediction of patient survival then critically evaluated.
Acknowledgements
I would like to thank Dr Paul Lewis, Dr. Julia Gee and Professor Robert Nicholson for giving
me the opportunity to study at the Tenovus Centre for Cancer Research as well as their expert
support and guidance throughout this study.
Funding from the Tenovus Cancer research charity was gratefully acknowledged as well as
the ability to attend conferences and meetings.
Special thanks to all Tenovus staff, Welsh School of Pharmacy and colleagues at the Swansea
Medical School, Swansea University who have helped make my study a highly enjoyable and
memorable experience.
Declaration
This work has not previously been accepted in substance for any degree and is not
concurrently submitted for any degree.
S
i g
n
e
d
. . . .
(candidate)
Date...
I ! . t ^ / . Z
Statement 1
The thesis is being submitted in partial fulfilment of the requirements for the degree of PhD.
Signed....
(candidate)
...
Statement 2
This thesis is the result o f my own independent work/investigation, except where otherwise
stated. Other sources are acknowledged by explicit references.
Signed
(candidate)
Date
...
Statement 3
I hereby give my consent for my thesis, if accepted, to be available for photocopying and for
inter-library load, and for the title and summary to be made available to outside organisations.
Publications
Hill N, Gee JMW, Quirk P, Sharma-Oates A, Nicholson RI, Thomas G, Leonard R, Wagstaff
J and Lewis P (2007). Superstes: cancer survival query tool.
Eur J Cancer
(submitted)
Lewis P, Hill N, Gee J, Nicholson RI, Leonard R (2007). SUPERSTES - breast cancer
survival query and report system. NCR! conference abstracts, (poster)
Contents
Summary
.
.
.
.
.
.
.
.
.
.
i
Acknowledgements .
.
.
.
.
.
.
.
.
ii
Declaration
.
.
.
.
.
.
.
.
.
.
iii
Publications .
.
.
.
.
.
.
.
.
.
iv
Contents
.
.
.
.
.
.
.
.
.
.
v
Abbrevi at i ons.
.
.
.
.
.
.
.
.
.
xi
Chapter 1: Introduction
1.1 Current breast cancer prognostic factors, impact of treatment strategies and
limitations
.
.
.
.
.
.
.
.
.
.
3
1.2 Approaches to discover improved prognostic markers and treatments for breast
cancer.
.
.
.
.
.
.
.
.
.
.
6
13 High-throughput technologies and associated bioinformatics for maker discovery
.
.
.
.
.
.
.
.
.
.
.
.
S
1.3.1 Microarray technology and experimental design
.
.
.
9
1.3.2 Improving quality of microarray experiments
.
11
1.3.3 Microarray analysis suite 5.0
12
1.3.4 PMA c
a
l l ... 15
1.3.5 Data analysis-normalisation .
16
1.3.6 Statistical testing-differential gene expression
17
1.3.7 Class Discovery.
.
19
1.3.7.1 Hierarchical clustering
21
1.3.7.2 K - M e a n s ... 22
1.3.7.3 Partitioning Around Medoids (PAM).
.
.
.
23
1.3.7.4 Self Organising Maps (SOM).
.
.
.
.
24
1.3.7.5 Fuzzy Clustering
.
.
.
.
.
.
24
1.3.8 Class Prediction.
.
.
.
.
.
.
.
25
1.3.8.1 Principal components analysis
.
.
.
.
26
1.3.8.1 Multidimensional Scaling
.
.
.
.
.
26
1.3.9.1 Database, Annotation,Visualisation and Integrated Discovery (DAVID)
resource
.
.
.
.
.
.
.
28
1.3.9.2 Babelomics
.
.
.
.
.
.
.
29
1.3.10 The limitations of existing microarray analysis software - a brief review 31
1.4 Application of high-throughput technologies to determine gene signatures
predictive of prognosis and response in breast cancer
35
1.4.1 Class discovery applied to clinical breast cancer
35
1.4.2 Prediction of breast cancer survival outcome using microarray derived
prognosis systems and limitations
.
.
.
.
.
39
1.4.3
In vitro
studies
.
.
.
.
.
.
.
49
1.5 Data mining large clinical sets for application of bioinformatics classification
methods to reveal improved clinocopathological prognostic indices in non-microarray
datasets
.
.
.
.
.
.
.
.
.
52
THESIS AIMS AND O B J E C T I V E S ...53
Chapter 2 - Informatics system Tenovus - ‘1-10* development
2.1 Background
.
.
.
.
.
.
.
.
.
56
2.2 - Graphical user interfaces
.
.
.
.
.
.
.
56
2.3 - Application development technologies
2.3.1- T h e ‘R’ project
.
.
.
.
.
.
.
58
2.3.2-Bioconductor .
.
.
.
.
.
.
.
60
2.3.3-Microsoft Visual Basic (VB) .
.
.
.
.
.
60
2.4 - Interface connectivity .
.
.
.
.
.
.
.
62
2.4.1 - R - ( D ) C O M ...62
2.4.2 - Web services .
.
.
.
.
.
.
.
63
2.4.3 - Database (OLEDB) connectivity
.
.
.
.
.
63
2.5 - Microsoft Excel
.
.
.
.
.
.
.
.
64
2.6 - Microsoft Access and Microsoft SQL server .
.
.
.
.
65
2.7 - Three Dimensional visualisation technologies - OpenGL and DirectX
67
2.9 - Technology selection
.
.
.
.
.
.
.
.
70
2.10 - Overview o f Informatics Tenovus (I-10)
2.10.1-T h e rationale for I-10
.
.
.
.
.
.
71
2.10.2-D esign o f I-10
.
.
.
.
.
.
.
73
2.10.3-Overview o f I-10 capabilities
.
.
.
.
77
2.10.4-Database development
.
.
.
.
.
.
82
2.11 - 1-10 coding development
2.11.1-V isual basic general principals
.
.
.
.
.
84
2.11.2 - Syntax alterations from Visual basic to ‘R’ .
85
2.11.3-E x cel sheet component data handling
.
.
.
.
86
2.11.4-Profile viewer
.
.
.
.
.
.
.
88
2.11.5-Three dimensional plotting using OpenGL .
.
.
.
89
2.11.6 - Principal components analysis
.
.
.
.
.
99
2.11.7- S e l f organising maps.
.
100
2.11.8-Hierarchical clustering
102
2.11.9-F uzzy clustering analysis
.
.
.
.
.
.
103
2.11.10-Partitioning around medoids (PAM)
105
2.11.11-K-M ean s
... 106
2.11.12-Multidimensionalscaling .
.
.
.
.
.
106
2.11.13-Correspondents analysis
107
2.11.14-Clusteringtechnique comparison .
108
2.11.15 -CIValid
.
112
2.12-1-10 application compilation for distribution .
118
2.13- I - 10 Installation
.
119
2.14-Discussion
.
.
.
.
.
.
.
.
.
120
Chapter 3 - Application of 1-10 to
in vitro
endocrine response and
resistance microarray data
3.1-Background
.
.
.
.
.
.
.
.
.
123
3.2-Phenotype of MCF7 models
.
124
3.3 - Confirmation of quality of Affymetrix samples through I-10 .
125
3.4-Data reduction using significant analysis of microarray through I-10 .
129
3.5 - Chromosomal distribution
129
3.6-Exploration o f broad clustering trends in the data using I-10
.
132
3.7 - Optimal clustering method assessment.
134
3.7.1-Internal validation o f clustering methods
134
3.7.2 - Stability of clustering methods
137
3.7.3 - Biological validation .
.
.
.
.
.
.
141
3.8 - Exploring hierarchical clustering membership
3.8.1 - Broad clustering of dataset and subsequent sub clustering to reveal patterns
and robust genetic changes
144
3.9 - Ontological exploration to reveal potential signalling targets in resistance
156
3.9.1 - Cluster 9 - Tamoxifen resistance and faslodex resistance suppressed genes 157
3.9.2 - Cluster 12 - Ontology of Tamoxifen resistance and Faslodex resistance
induced probes
.
.
.
.
.
.
.
.
161
3.9.3 - Summary o f remaining cluster ontologies taken to most significant level
163
3.10 - Comparison o f cluster 9 suppresses versus cluster 12 induced results of TAMR and
F A S R ...167
3.11-Conclusion
.
.
.
.
.
.
.
.
.
168
Chapter 4 - Superstes - Development of a clinical cancer survival query
tool
4.1 - Background
4.1.1 Prognostic indices in cancer
171
4.1.2 The SEER d a t a s e t ...172
4.1.3 Prognostic tools developed using SEER data .
172
4.2 - Analysis of survival data
.
.
.
.
.
.
.
174
4.2.1 Parametric and non parametric statistics
174
4.2.2 Kaplan Meier survival curves .
175
4.2.3 The log rank test
.
.
.
.
.
.
.
177
4.2.4 Cox proportional hazards model
178
4.3 - Aims and objectives
.
.
.
.
.
180
4.5.1 Providing a cancer patient data resource
181
4.5.2 SEER patient dataset transformation - preparation for database storage
182
4.5.3 Visual basic.net and visual studio
184
4.5.4 R - ( D ) C O M ...185
4.5.5 Web service development
185
4.5.6 User interface design and statistical capabilities o f Superstes .
192
4.5.7 Creating a single cohort query .
196
4.5.8 Creating a two cohort query
.
.
.
.
.
.
203
4.6 - Example usage of Superstes - breast cancer
4.6.1 - Breast cancer case study 1 - single cohort query
205
4.6.2 - Breast cancer case study 2 - two cohort query
207
4.7 - Example usage o f Superstes - colon cancer
4.7.1 - Colon cancer case study 1 - single cohort query
208
4.7.2 - Colon cancer case study 2 - two cohort query
211
4.8 - Discussion
.
.
.
.
.
.
.
.
.
212
4 .8 .1 - Impact of Superstes on prognostic marker discovery in cancer research 214
4.8.2 - An international cancer patient data resource
216
Chapter 5 - Assessment of survival using machine learning algorithms
based up on the Nottingham Prognostic Index (NPI) covariates using the
SEER dataset, ‘R’ and Weka
5.1-Background
.
.
.
.
.
.
.
.
.
218
5.2- Data mining
.
.
.
.
.
.
.
.
.
220
5.2.1 Logistic regression
.
.
.
.
.
.
.
220
5.2.2 Decision trees
.
.
.
.
.
.
.
.
222
5.2.3 Support vector machine ( SVM) .
.
.
.
.
.
223
5.2.4 Boosting and Adaboos t .
.
.
.
.
.
.
224
5.2.5 Bagging .
.
.
.
.
.
.
.
.
226
5.2.6 Random Forest .
.
.
.
.
.
.
.
227
5.2.7 The Naive Bayes classifier
.
.
.
.
.
.
228
5.2.8 Supervised learning - classification to model survival.
229
5.2.10 Assessing an accurately predicted outcome - confusion matrix/kappa stats 231
5.3 - Using ‘R’ and machine learning algorithms through ‘Weka’ .
232
5.4 - Exploring the SEER dataset using the Nottingham Prognostic index .
233
5.5 - Aims of the chapter
.
.
.
.
.
.
.
.
236
5.6-Strategy .
.
.
.
.
.
.
.
.
.
236
5.6.1 - Predicting patient survival using different statistical and machine
learning methodologies
.
.
.
.
.
.
.
237
I - Multiple logistic regression
.
237
II - J48 decision tree .
.
.
.
.
.
.
245
III-Application of Support Vector Machine
247
IV - Boosting .
.
.
.
.
.
.
.
249
V - Bagging .
.
.
.
.
.
.
.
257
VI - Creating new classifiers using Weka w ith‘R’ .
261
5.6.3 Summary - cross comparison of machine learning performance to predict
survival or death
.
.
.
.
.
.
.
.
263
VII - Probability o f death or survival using NBTree.
264
5.7 - Discussion
5.7.1 Nottingham prognostic index applied to the SEER breast cancer dataset
268
5.7.2 Modelling survival
.
.
.
.
.
.
.
269
Chapter 6 - Discussion
6.1 - Aim 1 - Development of a user friendly Asymetrix microarray suite
273
6.2 - Aim 2 - Demonstrate the capability of the developed I-10 software to identify
differential gene expression in order to assist further understanding of resistance to Tamoxifen
dr Faslodex
.
.
.
.
.
.
.
.
.
.
278
6.3 - Aim 3 - Develop a patient and oncologist analysis tool to investigate the effect of
multiple prognostic factors which have an impact on survival and patient quality of life based
on a published breast and colorectal cancer data set .
.
291
6.5 - Aim 4 - Using advanced computational techniques to improve survival prediction 294
6.6 - Conclusion
.
.
.
.
.
.
.
.
.
298
Abbreviations
ASCII
American standard code for information interchange
ANOVA
analysis of variance
APN
average proportion of non-overlap
AD
average distance
ADM
average distance between measures
ASCO
American society of clinical oncology
AU
approximately unbiased
BHI
biological homogeneity index
BSI
biological stability index
BP
bootstrap probability
BRCA
breast cancer susceptibility protein
CoA
correspondence analysis
DAVID
database, annotation visualisation and integrated discovery
DCOM
distributed component object model
DMT
data mining tool
DNS
domain name server
EST
express sequence tags
FISH
fluorescence in situ hybridisation
FOM
figure of merit
HCA
hierarchical cluster analysis
LINUX
operating system created by Linus Torvalds
PAM
partitioning around medoids
OLEDB
object linking and embedding database
ORF
open reading frame
portable document format
ER
oestrogen receptor
ERa
oestrogen receptor alpha
HER2
human epidermal growth factor receptor 2
QPCR
quantitative polymerase chain reaction
IDE
integrated development environment
PCA
principal components analysis
RMA
robust multi-array
RNA
ribonucleic acid
RT-PCR
reverse transcriptase PCR
SAM
significant analysis of microarray
SAGE
serial analysis of gene expression
SERM
selective oestrogen receptor modulator
SOM
self organising maps
SQL
structured query language
SVM
support vector machine
MAS5.0
microarray suite 5.0
MDS
multidimensional scaling
GCRMA
GC robust multi-array
UCLA
university of California, Los Angeles
VB
Visual Basic programming language
Chapter 1
Introduction
1 Introduction
Breast cancer is the second most prevalent type o f cancer throughout the world after lung cancer, with an incidence rate in women in the UK o f 1 in 9, according to cancer research UK (Office for National Statistics, 1999) [1]. The majority (95%) o f breast cancers are sporadic, yet a small proportion are familial where 5% o f these may relate to loss o f function o f the genes BRCA 1 and 2 (Thompson et al, 2008) [2]. Breast cancer is a multifaceted disease in terms o f genetic, phenotypic and clinical characteristics, where decision making by oncologists for the most effective treatment regime depends upon clinical and pathological prognostic and predictive factors. Importantly, significant improvements have been made in the way breast cancer is diagnosed and treated. Improvements are due to new research discoveries which have improved survival by over 20% in the last 10 years (Rakha et al, 2008) [3]. For example, improved mammographic screening resulted in detection o f the onset o f early invasive disease and also ductal carcinoma in situ, a pre-neoplastic condition with the potential to progress to invasive disease (Yaffe et al, 2008) [4].
A further landmark has been discovery o f steroid hormone signalling via the oestrogen receptor- a (ER) playing a central role in the growth and development o f breast cancer (Yaffe et al, 2008) [4]. Epidemiological studies indicate that increased risk o f breast cancer is associated with cumulative life-time exposure to steroid hormone-related factors, having associations with an earlier menarche, late menopause and pregnancy. Discovery o f the importance o f such signalling has provided a mechanistic target to selectively treat and improve outcome for many patients through use o f various anti-hormonal agents (including anti-oestrogens such as Tamoxifen and Faslodex, and also oestrogen deprivation treatments notably aromatase inhibitors). Similarly, discovery that c-erbB2 amplification can contribute to growth and aggressive behaviour o f some tumours has resulted in Herceptin (Trastuzumab) antibody therapy (Kapp et al, 2006) [5].
Historically, there has been a good overall association between the standard clinico-pathological covariates currently used in breast cancer management and patient’s outcome. Prognostic factors enable identification o f patients whose prognosis is either good enough to not warrant adjuvant systemic therapy after local surgery o f the tumour or poor enough to justify a more aggressive
adjuvant approach. Secondly, covariates can be predictive, enabling selection o f patients whose tumours are more likely to be responsive or resistant to a particular type o f therapy. O f considerable interest in the latter regard is steroid hormone receptor status, where ER+ tumours (a feature o f -7 0 % breast cancer patients) are enriched for anti-hormone responses, which are largely absent within ER negative (ER-) patients. Equally, responses to Herceptin are confined to patients whose tumour cells have amplification o f the c-erbB2 gene.
Unfortunately however, significant proportions o f patients relapse following treatment, and ultimately will die from progression o f the disease (Slamon et al, 1987) [6]. There is therefore an increasing need for additional prognostic and predictive factors both to improve patient risk accuracy, to improve targeting o f existing treatments to those who will truly benefit, and equally to determine further tumour targets for development o f new therapies.
1.1 Current Breast Cancer Prognostic Factors, Impact on Treatment
Strategies, and Limitations
Histopathology supplies a substantial amount o f information through routine examination o f breast cancer (and associated lymph node) sections allowing generation o f morphological prognostic factors such as tumour size, differentiation in terms o f histological type and grade, as well as lymph node stage and vascular invasion. Prognostic groups according to such measurements have been created which can subset patients according to their chance o f survival over a 10 year period. The Nottingham prognostic index (NPI) is a clinicopathological classification system based specifically on tumour size, histological grade, and lymph-node status (Galea et al, 1992) [7]. The higher the NPI value the worse the prognosis. It was one o f the first systems to be developed to show a correlation between the three different parameters and adverse outcome. It was developed before high throughput technologies such as microarray analysis became available in the late 1990’s and subsequent studies confirmed the value o f the combination o f lymph node stage, histological grade, tumour size could improve prediction o f prognosis. The NPI system is still widely used throughout the UK for breast cancer prognostication (Galea et al, 1992) [7].
However, it is acknowledged that histopathological parameters are also associated with certain limitations, e.g., many histopathological variables (such as grade) are subject to significant pathologist variability even after many attempts o f standardisation (Yu et al, 2004) [8], and appropriate cut-off points are often difficult to define when the histopathological parameter being measured is scored over a continuous range o f values (Yu et al, 2004) [8]. Indeed, there is still little general agreement as to which tumour prognostic factors should be used routinely in clinical practice. The only factor used consistently as a guide for therapy to date has been lymph node status however this alone is incapable o f identifying patients who have 100% risk o f death from breast cancer. The inaccuracies o f such prognostic indices is further confirmed by several studies that have shown that approximately one-third o f lymph node-negative breast cancer patients who are classified within a ‘good prognostic group’ actually go on to develop disease recurrence (Feng et al, 2007) [9], while a similar proportion o f node-positive patients paradoxically remain free from development o f distant metastases (Feng et al, 2007) [9]. Prognosis o f breast cancer also depends upon the presence o f distant metastases, and evaluation o f intrinsic biological characteristics to further indicate aggressive behaviour o f the tumour, for example by examining growth rate (e.g. using Ki67 immunostaining), may also be important (He et al, 2006) [10]. In total, taking all these parameters into account suggest an improved prognostic index may need to include both time-dependent and biological information. Indeed, it is becoming increasingly established within the breast cancer research community that current prognostic factors fail to adequately reflect the clinical and molecular heterogeneity o f the disease, and in some instances prove inaccurate when used to direct management decisions (Rakha et al, 2008) [3]. O f note, clinical studies o f individual gene expression has revealed there are distinct sub-classes o f breast cancer (Perou et al, 2000) [11], with the concept o f sub-classes being re-capitulated at the protein level (Yu et al, 2004) [8] and where such sub-classes appear to have bearing on prognosis (Modlich et al, 2006) [12]. Such concepts will be discussed in detail in a later section.
Clinically, the NPI has also proven valuable in assessing criteria for receiving adjuvant systemic antihormone therapy in primary operable breast cancer. If patients fall into a good prognostic group, Tamoxifen treatment has shown to give a good survival outcome. However due to certain side effects such as increases in endometrial hyperplasia and occasionally endometrial cancer; it could be argued that there may be patients with an inherently good prognosis where Tamoxifen
treatment could be withheld. In the poor and moderate prognostic groups revealed by the NPI, additional factors are taken into consideration notably ER status and menopausal status. For example pre-menopausal, ER+ patients can receive ovarian suppression using Zoladex and tamoxifen in combination (Gnant et al, 2008) [13]. Post-menopausal, ER+ tumours receive adjuvant tamoxifen (or increasingly aromatase inhibitors). ER- patients would receive chemotherapy treatment as they predominantly lack the target receptor for anti-hormones; however those patients too weak to receive chemotherapy may be given hormone therapy as up to 5% response rates can occasionally be observed in ER- disease. O f note, treatment for tumours also over expressing c-erbB-2 protein can include Herceptin which also serves to increase sensitivity to chemotherapy, inducing apoptosis more readily (Dahabreh et al, 2008) [14]. However, again the prognostic factors prove inaccurate. 40% o f ER+ tumours fail to respond to anti-hormones and have an inherently poorer prognosis (Harris et al, 2007) [15], while a proportion o f initially responsive patients subsequently relapse during treatment despite retention o f ER positivity, again an event ultimately associated with poorer outlook (Belkhiri et al, 2008) [16]. There are clearly further factors determining growth and progression o f some E R+tumours and hence durable response to anti-hormonal agents. Equally, responses to Herceptin are confined to ~30% o f er62?2-overexpressing patients with relapses again a problem in these initial responders (Belkhiri et al, 2008) [16].
Together with using the NPI system, the St Gallen and NIH conference has also outlined guidelines for the eligibility o f adjuvant chemotherapy, again based on tumour histological and clinical characteristics in relation to predicting outcome after diagnosis (Modlich et al, 2006) [12]. Results according to these guidelines showed that along with lymph node positive disease, up to 90% o f lymph node negative early breast cancer patients are candidates for consideration o f adjuvant systemic treatment. However studies have shown that many would remain disease free, where such over treatment may incur unwanted side effects (Van’t Veer et al, 2002) [17].
Clearly, there are inherent inaccuracies in the current prognostic indices and also limitations in their effectiveness in predicting treatment. However, there is considerable scope to improve upon the NPI and existing prognostic factors used to select patients for therapy using new computational techniques as applied to microarray data and expanded datasets offering extra
covariate information such as that available through the SEER program in the USA (Edwards et al, 2005) [18].
1.2 Approaches to Discover Improved Prognostic Markers and Treatments for
Breast Cancer
It has become clear that patients with similar clinical and pathological features may show distinct prognostic outcomes and also vary in their response to therapy. Recent advances in biomedical data modelling and high throughput technology may improve understanding o f these phenomena.
The phenotype o f cells - encompassing growth, differentiation and migratory behaviour o f malignant (versus benign) cells- can classically be measured through protein expression studies, often examining individual or small numbers o f proteins (e.g. using immunohistochemistry and western blotting) which can be used as prognostic/predictive markers (e.g. ER and HER2 measurement), as well as to understand mechanisms underlying response and failure to current therapies and to derive new drug targets. Many research groups are active in this area, drawing on clinical material and in some instances experimental models. For example, in vitro examination o f ER+ breast cancer cell lines such as MCF-7 have confirmed the importance o f ERa, a nuclear transcription factor, and shed light on its signalling mechanism (Lisztwan et al, 2008) [19]. Scientists in the Tenovus centre for cancer research, Cardiff University, have derived a model from the ER+ MCF-7 breast cancer cell line in vitro to understand resistance to Tamoxifen (TAMR cell line). The TAMR cells have a very aggressive phenotype showing increased growth rate, motility and invasiveness (a feature that can be associated with antihormone resistance in the clinic) and has been found to rely on the tyrosine kinases EGFR, erbB2, IGFR and c-Src signalling (Frasor et al, 2006) [20]. It appears that a network o f receptor tyrosine kinase signalling contributes to breast cancer growth and progression with pathways, interacting with ER when this is present. Consequently, it should be o f no surprise that drugs which inhibit the candidate EGFR, erbB2, IGFR and c-Src pathways results in inhibition o f TAMR cells in vitro. Research within the Tenovus Centre has provided proof o f principal that useful biomarkers (e.g. erbB receptors such as erbB2 and EGFR) and targeted therapies (e.g: erbB and kinase inhibitors)
can result from in depth study o f breast cancer growth signalling biology in the TAMR cells (Nicholson et al, 2005) [21].
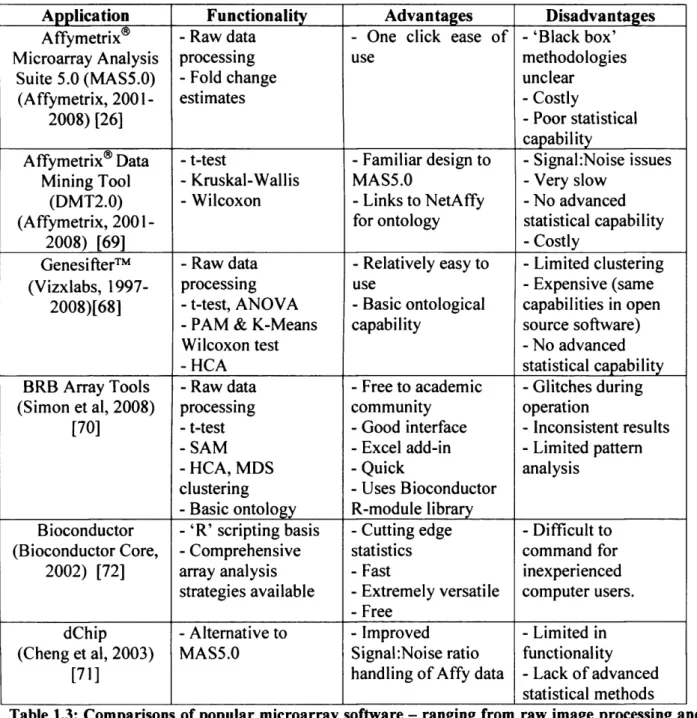
The emergence o f genomic technologies since the turn o f the century has facilitated exploration o f multiple genes and associated pathway information to further explain the progression and development o f breast cancer. Three key multigene tests have been developed which can be routinely used for analysis. These are summarised and compared in table 1.1.
The prognostic value o f Immunohistochemistry (IHC) is well established for testing o f ER, PgR, HER2 and the proliferation marker Ki-67. Fluorescence in situ hybridization (FISH) differs in that it is generally used to determine the copy number o f the HER2 gene for treatment selection processes with Herceptin, for example. Quantitative PCR (QPCR) is very reliable due to its sensitivity o f detecting RNA from very little starting material (Lisztwan et al, 2008) [19]. The quantitative polymerase chain reaction (QPCR) technique has the added advantage over the other techniques o f being able to assess multiple biological processes simultaneously such as hormone receptor status, proliferation and HER2 pathway information. It has been extensively used to predict overall prognosis and response to hormonal therapies (Lisztwan et al, 2008) [19].
Platform
IHC
FISH
PCR
Microarray
Number of
genes tested:
Small Small Intermediate Large
Type of
measurement
Semi quantitative Semi quantitative Quantitative Quantitative
Statistical
algorithm
complexity
Simple Simple Complex Highly complex
False Discovery
risk
Low Low Intermediate High
Ability for
Multiple
pathway
discovery
Low Low Intermediate High
Individual
prognostic value
Established Established Established Established
Standardisation
ability
Low Low High High
Although algorithms based on basic clinico-pathological data are now routinely used to define prognostically significant groups and to tailor systemic therapy for breast cancer patients (for example, Adjuvant! Online), further improvements are required. Combination studies o f small numbers o f existing markers stemming from techniques such as ISH, FISH and QPCR could have potential to reveal improved prognostic groupings when analysed using clustering techniques. This is particularly evident o f the interaction between c-erbB2 and also c-myc - an effect which is not seen in profiling o f the individual genes - only in combination (Fei et al, 2002) [23]. Exploration o f the combination effect that existing biomarkers can have could potentially be very effective.
As a result o f human genome sequence completion, it is feasible that many more assayable markers o f relevance to cancer behaviour and prognosis may be revealed through high throughput profiling o f the whole molecular signature o f human tumours. This is feasible through Microarray technology where a complete set o f genes (up to ~40,000) can be measured in a single hybridisation experiment, in contrast to techniques such as Quantitative PCR which can only measure at best several hundred genes at a time. The microarray approach has the potential to reveal a detailed molecular description o f malignant tumours which ultimately may lead to novel tumour markers and classification algorithms. In turn, these factors can be evaluated for their ability to improve prediction o f clinical behaviour and potentially could encompass targets for new therapeutic approaches.
1.3 High-throughput Technologies and Associated Bioinformatics for Marker
Discovery
High-throughput approaches using microarrays require robust bioinformatics strategies in parallel for successful and meaningful data analysis if we are to determine genes that can refine prediction o f prognosis and treatment outcome, as well as provide targets to augment treatment regimes. An inherent goal o f array analysis is the need to maximise the biological data that can be obtained from microarray technology. This requires optimisation o f the identification o f significantly differentially-expressed genes from microarrays, including consideration of
microarray platform, experimental design, expression call and normalisation. Data reduction to determine significantly different genes which encompasses filtering for false positives and inability to more efficiently obtain comprehensive gene annotation is also important. Additionally, array results are viewed in a way that differs to other more molecular views in that maps drawn from results show order and logic o f the genetic ‘program’ as opposed to the order in which genes appear on individual chromosomes (Brown et al, 1999) [24]. The representation is the cornerstone o f the value which microarray results can yield - association o f individual genes with others showing similar expression patterns. Complex analysis strategies are involved; however there is considerable potential to assign signature components within regulatory pathways using different analysis methods, albeit as determined at the transcriptional level.
1.3.1 Microarray technology and experimental design
Multiple types o f microarray platform exist. The technology roots are largely based in cDNA library and differential display studies which ultimately led to the first nylon and plastic microarrays. As engineering for array technology improved, whole genome microarrays have been developed; however, custom designed arrays using the Cy3/Cy5 system remain popular in the biological research community- particularly for smaller genome organism studies such as in the Fugu fish (Bassett, 2001) [163].However, in the cancer research setting, well developed commercial platforms such as whole genome arrays from Affymetrix facilitate maximum exploration (Robinson et al, 2007) [25]. Disease specific arrays from Affymetrix (such as breast cancer) are also taking high throughput exploration to a further level o f performance. The quality benefits o f the Affymetrix technology are widely publicised stemming from its fundamental principle o f utilising perfect match and mismatch oligonucleotides. The present/marginal/absent (PMA) expression call performs as an intrinsic quality control step as well as being an inherent part o f the quantification technique (Robinson et al, 2007) [25]. The Affymetrix approach also is reported to be able to reveal weakly expressed mRNA species more accurately.
To produce robust results from a microarray, a number o f fundamental steps need to be monitored starting with sample preparation. RNA is initially extracted from the samples under test, from which cDNA is then reverse transcribed, with subsequent hybridisation o f the samples
to a chip such as the A ffy m etrix H G U -1 3 3 A chip (H o m o sapiens). An o v e rv ie w o f this process is show n in figure 1.1. S can n in g o f the array occ u rs in a specialist facility w ith high resolution scanners a p proved by A ffy m etrix using A ffy m etrix software. A d o p tin g this approach, the co m p a n y believes ‘quality can be a s s u r e d ’ with potential c o nsistency b etw e en array runs and facilities (R obinson et al, 2007) [25].
Total RNA » AAAA —• AAAA • AAAA COMA f J
§
InVHn TTlnfln u r m i r i cflNA 4 * Q m C M p ' ' ' ' F ra g m a n ta tto n / C s. cRNA >F igure 1.1: An overview of the A ffym etrix process and a typical im age o f a chip a fte r scanning. (A ffym etrix, 20 0 1 ) [26]
Initial experim ental design is very im portant w hich e n c o m p a sse s the initial m icroa rray tech n o lo g y choice and in particular the n u m b e r o f replicates required o f sam ples to be arrayed. S ubsequent analysis o f m icroarray d ata c o n c ern s determ in in g genuine ex pression level cha nges from ‘n o is e ’ inherent in any assay. T h e w a y in w hich experim ental bac k g ro u n d ‘n o is e ’ is filtered from true genetic results is the first step for all array analysis. A lthough the A ffy m e trix system deliv ers the lowest signal to noise ratio o f all the available A rray platform s due to 11 sequences p er g en e including m ism a tc h e s (“ gene p robe set” ), d e p e n d en cy on a single replicate w o u ld still p ro v e unreliable (R ob in so n et al, 2007) [25]. Careful cost analysis versus optimal n u m b e r o f re plic ates is often a difficult yet im portant balance to ac h ie v e due to the potential substantial ben e fits and research value array d ata can yield. C o m p ro m ise s m ad e at this point could poten tially je o p a r d ise the analysis w hich could result, as a w o rst case scenario, in further sam ple sets h a v in g to be prepared and sam ples h av in g to be re-arrayed. This can p rove costly overall, e spe cially i f o n ly an additional replicate w a s required.
A minimum o f three replicates is generally advised by the literature; however recent experience has shown a need to calculate exactly the optimum number o f replicates needed encompassing economic feasibility (Black et al, 2002) [27]. The way in which the optimal number o f replicates is calculated varies according to the type o f statistical testing which would be envisaged for a particular array results set. Two key calculations are widely accepted depending upon whether parametric or nonparametric statistics will be applied. Parametric methods, utilising traditional sample statistical analysis methods such as the t-test, follows the theory that gene expression data are normally distributed. In comparison, the Wilcoxon test is a non-parametric method based on ranking observed gene expression levels. A method outlined by Black and Doerge is widely accepted as a way o f calculating the ideal number o f replicates if only parametric methods are to be used (Black et al, 2002) [27]. However, for the ultimate in sensitivity and comparison, some studies suggest there may be more benefit in comparing results from an alternative array system to increasing replicate numbers beyond three (Pedotti et al, 2008) [28].
1.3.2 Improving quality of microarray experiments
Early pioneers o f Microarray technology, although obtaining interesting research findings, as exemplified in clinical breast cancer microarray studies by Van’t Veer et al (Van’t Veer et al, 2002) [17], noted that there were certain shortfalls in the technique. Results have proven difficult to reproduce with many reasons to explain this occurrence including a lack o f exact information as to how sample material was prepared, the number o f replicates, and data preparation prior to statistical analysis. Consequently, the Microarray and Gene Expression Data (MGED) Society was formed to strive to improve quality and consistency o f results in microarray experiments. The MGED society is an international organization o f computer scientists, biologists, and data analysts that aims to facilitate the sharing o f data generated particularly using microarray technology for a variety o f applications including expression profiling (Brazma et al, 2001) [29]. The key emphasis is establishing standards for data quality, management, exchange and annotation whereby facilitating the creation o f tools that enable these standards to be achieved (Brazma et al, 2001) [29].
As previously stated, the prime goal for using high throughput approaches is to maximise the biological data that can be obtained from any given sample. Often this involves refining the process to identify significantly differentially-expressed genes, for example improving the filtering procedure for false positives, detailed pattern discovery and approaches which more efficiently perform comprehensive gene annotation. This was one o f the motivations for MIAME standardisation. To aid future design o f MIAMI compliant array experiments, it is mandated that the inclusion o f several pieces o f minimum information is required to accompany a dataset o f published results. These include:
I. Array design description information - type o f array, chip information. II. Experimental design - Authors, type o f experiment, number o f replicates III. Samples used, extract preparation and labelling - Cell type, labelling protocol
IV. Hybridisation procedure and parameters - Sample and corresponding Array information V. Measurements data and specifications o f data processing - Image quantification and
Normalisation
Without inclusion o f such information, it will be harder in future for referees to accept microarray based research for publication in scientific journals.
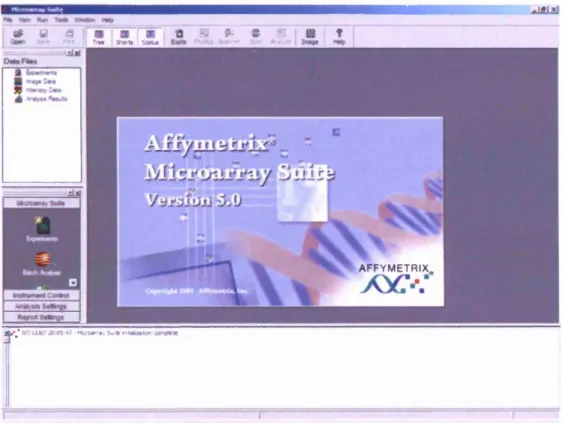
1.3.3: Microarray analysis suite version 5.0 (MAS5.0)
Affymetrix recommends that scans created by the Affymetrix scanner are converted into a tabular form of individual intensity values using a software package called ‘Microarray Analysis Suite 5.0’ (MAS5.0). This was a current version o f the application at the start o f this project. Recent versions o f an equivalent application offered by Affymetrix at the time o f writing include the Affymetrix® Expression Console™ software. To date, this algorithm is still referred to as the ‘MAS5.0’ algorithm in current Affymetrix applications which perform this process. The algorithm uses a multistage process which uses fundamental design properties o f an Affymetrix array. It was first launched with the release o f the MAS5.0 application suite and remains routinely used in more recent software releases from Affymetrix (Affymetrix, 2001) [26].
The MAS5.0 algorithm transforms the scanned image light intensities (encompassing every probe) into a series o f numbers using a file type called a CEL file produced by the Affymetrix scanner. The intensity o f light emitted from a particular chip at different areas when scanned with a laser directly relates to the amount o f expression o f a particular gene in a particular sample at a particular moment in time. The software produces a table o f this data in the form o f a spreadsheet summarising the samples arrayed and the individual Affymetrix gene ID’s to which each spot on the chip corresponds.
The MAS5.0 algorithm uses a multstage process. Firstly, background correction is performed by dividing the array into 'zones' and calculating an average background intensity. The design of an Affymetrix array having Mismatch (MM) and Perfect Match(PM) probes is also fundamental to the process. Each mismatch probe provides a direct measure o f background and stray signal (due to cross hybridisation) for its perfect match partner. However the mismatch intensity can be higher than its perfact match value or lower. The algorithm uses smoothing so that there are not jumps in values between large and small values. As a result o f all these features on an array, the Tukey biweight algorithm is then used to calculate a robust average signal from each probe. A log base 2 o f the values is taken with an additional step to prevent any zero values. Finally, in case o f slight manufacuturing variances and other experimental factors, results are scaled by ignoring the top and bottom 2% o f expression value and a mean intensity calculated for those that remain. (Affymetrix, 2001) [26]. The resulting summary is usually produced in a tab-delineated format (figure 1.2) which can be viewed using spreadsheet applications such as Microsoft Excel. For example, in Tenovus samples representing different treatments/resistant or responsive states would have been arrayed (with replicates) as part o f the experimental design and consequently there is a need for the information to be subsequently collated and stored in a database, for quick retrieval for detailed analysis.
p't* || Tt*t 9 M ; statu* | f \ r 4 u Scanner 9 M tnH fit
AFFYMETRIX,
jtfW*/ O ' U O ' kO:05:-»' W joarre* Sj* ^ D a ^ a to r
F igure 1.2: O p e n in g screen o f A ffym etrix m icroarray su ite version 5.0 (M A S 5 .0 ) (A ffy m etrix , 2001) [26]
4 ) ? * E d t view Graph Rur, Took AVsJow Hefe
- l a i x i . j a j x ] * H Open Seve P m t
a
m □U Shorts g a s sS te o e ! Evxrtt R utfcs Scanner Stop B Analyze S3 1 i« a g e f 1 H e* ---. j ^ t i Sort 1 5 - 5 : 5 - I j s
N de rtd e Unhide j Option* : d e a r ScatterEl
& Image i t La«o D a t a F i le s FtXJ S r o Intenatv 1 ■ k n a p Data
J ) kta nsty Data 4 ) Vtatyve Result
?*l *
M l u m M l C O lM
ASPCA1 Senatrve Desciiptions Signtf [ Detection j Detection p-vatue
AFFX-Bio8-5_at 0012547 AFFX-Boe-M.at 7 P 0000501 AFFX-8o6-3_at 5 2 7 P 0009337 AFFX-BioC-5_et 150.4 P 0 000446 AFFX-8«iG3_al 1 0 0 3 P 0001249 AFFX-BioDn-5_at 107.1 P 0000169 A FFX*oOn-3_al 8 4 a 9 P 0 000195 AFFXOeX5_at 110 6 3 P 0000044 AFFX-OeX-3_ot 2007 9 P 0000044 AFFXOepX-5_el 7 0 A 0 3 1 3723 AFFXBapX-M.at 1 1 5 A 0105131 A F F X O « X - 3 > 1 6 A 0 014869 AFFX4j*X5_al 9 5 A 0313723 AFFXLy«X-M_«t 101 A 0 529760 A FF X -LyiX 3> 0 9 A 0712257 AFFX-PheX-5_at 0 7 A 0891021 AFFX-Phtft-M.et 3 3 A 0 724854 A ffX -P h#!-3.«t 3 9 A 0 834139 AFFXThtXA.al 2 9 A 0760937 AFFXTtnX-M.et 9 3 A 0 617401 AFFX-THA<-3_it 3.0 A 0 760937 A F F X Fipr*5_«l 1 7 A 0 645547 AFFX-T ipnX-M_at 1 4 A 0 953518 AFFX-T ipnX-3_et 0 3 A 0 953518 AFFX-HUMISGF3A/M97935 5 el 29 3 P 00 1 5183 1J » K A n a * — w te \M o W c » \ * ■ « / l « j . . . . i^r1 (Row: 22283
/ , 0 ?! 13/07 20:08:47 • Mcroarrav S u t t n tta te abon com pete
Figure 1.3: Screen cap tu re sh o w in g the resu ltin g ou tp u t o f M A S 5.0 co n v ertin g in d iv id u a l m icroarray ch ip
1.3.4: PMA call
As shown previously in figure 1.3, it is clear from the figure that not only is an intensity measure for each probe is created, however also a p-value and uniquely a Present, Marginal and Absent (PMA) expression call produced as a result o f information read from the scanner microarray 'C E L ’ files.
Each gene is represented a certain number o f times (“probe set”) resulting in expression values typically eleven times for each gene. The amount o f light emitted represents whether there is RNA being expressed for a particular gene in a particular sample on the chip. For every correct gene sequence there is a mismatch, the same sequence with one change in the middle (25mer) (Robinson et al, 2007) [25]. The true expression value assigned depends on the mismatch expression for that gene and the expression across the test sequences. Essentially, the PMA call is a voting system as to whether a particular gene is likely to be really expressed in that sample and depends whether or not expression is above a certain level in the MAS5.0 application algorithm. If the algorithm statistically decides whether the expression is really a true expression level and not an artefact, it will call it ‘present’. Although, the p-value for this call can be adjusted, PMA is usually related to a statistically significant p-value cut-off o f 0.05. If slightly elevated, it falls into the category marginal however the exact way in which marginal is determined is unclear. It is important to stress that it is different to the flag scoring system o f a Cy3/Cy5 array which looks at spot shape, size, area, and other components which are issues which do not affect the Affymetrix system (Lee et al, 2007) [30].
PMA call from Affymetrix microarrays can be used as an initial filter before differential gene expression analysis. There are two main benefits o f considering PMA call. Firstly, a degree o f quality control is imposed by the software in terms o f whether a particular result actually shows any real change on the chip and therefore whether or not it should be included for analysis. Secondly, filtering using PMA call is a quick and easy way o f initially filtering the data, thereby eliminating subsequent excessive and uninformative statistical testing. However, in some instances use of PMA call may be undesirable as a feature for initial filtering during analysis of
data. It could exclude potential genetic targets o f interest shown through reverse transcription polymerase chain reaction (RT-PCR) to have low expression levels which the Affymetrix process would otherwise exclude. This could be a consequence o f the stringent thresholds which MAS5.0 assigns internally as part o f the normalisation process for a particular probe which determines whether they are present or absent (versus the mismatch controls).
1.3.5: Data analysis - normalisation
Microarray chip normalisation can be a daunting process due to the multitude o f procedures in which it can be achieved. As previously introduced, inherent to the Affymetrix system, to minimize mis- and cross-hybridisation problems, the technology includes perfect match (PM) and mismatch (MM) probe pairs as well as multiple probes per gene (Lim et al, 2007) [31]. Consequently to obtain a single signal intensity result for each probe, many calculations are required before an absolute expression level for a specific gene is produced. Such data pre processing steps which combine multiple probe signals into a single value is known as normalisation. They usually involve three steps: (a) background adjustment, (b) normalization and (c) summarisation. In a recent review by Lim et al, four popular normalisation methods were compared - namely MAS5, RMA, GCRMA and Li-W ong (Lim et al, 2007) [31]. These are summarised in table 1.2.
Algorithm [Reference] Background correction Normalisation Summarisation
MAS5.0
(Hubbell et al, 2002)[32]
Ideal MM subtraction Constant Tukey biweight
RMA
(Irizarry et al, 2003) [33]
Signal and noise close- form transformation
Quantile Median polish
GCRMA
(Wu et al, 2004) [34]
Optical noise, probe affinity and MM adjustment
Quantile Median polish
Li-Wong
(Wong et al, 2001)[351
None Invariant set Multiplicative
model fitting Table 1.2 - Summary of four popular normalisation procedures showing how each differs in the way background correction, normalisation and summary of an individual chip is calculated. MM=Mismatch (Lim et al, 2007) [31]
Depending upon which measure and comparison is made each method has its advantages. However, the RMA and Li-Wong methods tend to produce similar results, with MAS5.0 and
GCRMA exhibiting the largest difference overall in performance. However GCRMA has raised concerns when assessing correlation artefacts where it performs poorly in comparison to the other techniques available. This is particularly concerning if subsequent analysis methods which rely on an accurate measure o f gene-pair expression profile correlation are to be used such as the clustering technique hierarchical clustering. It is thought the way in which GCRMA handles background correction is thought to affect its performance and therefore a flaw in the technique in comparison to RMA, for example. Furthermore, in relation to producing false positives, the GCRMA technique appears to introduce a high number in comparison to the MAS5.0 method which performs well in this regard. Consequently it could be argued that studies using the GCRMA could potentially have flawed results (Lim et al, 2007) [31].
Further normalisation o f a different type also takes place when arrays are compared with each other to address a particular experimental hypothesis. Although transformation procedures are recommended to be kept to a minimum to preserve originality o f the data distribution, log (base 2) transformation is performed initially. Also, for hierarchical clustering, gene median centering followed by sample median centering is also performed to align data before clustering (Eisen et al, 1998) [36].
1.3.6 Statistical testing: Differential gene expression
Following from normalisation (and any filtering based on PMA call), it is important to determine if there are any significant gene expression differences present within the data (“feature selection”). Robust identification o f significant gene changes will allow subsequent pattern analysis to reveal potential signatures o f interest. Once a feasible number o f genes are generated, identification o f individual genes known to play key biological roles in a resistance versus response environment, for example, could be identified within clusters and could potentially become therapeutic targets. Initial identification o f significant differences can be assessed in a multitude of statistical ways. The motivation o f such a step is to filter and discard genes which are unchanged between two different samples. The significant subsets o f genes which remain are taken further for subsequent detailed pattern discovery.
![Table 1.1 - Comparison of available breast cancer multi-gene predictor platforms (Ross et al, 2008) [22]](https://thumb-us.123doks.com/thumbv2/123dok_us/10155950.2917382/21.898.78.798.717.1103/table-comparison-available-breast-cancer-multi-predictor-platforms.webp)


![Table 1.7: Comparison of Oncotype DX and M ammaprint (Ross et al, 2008) [22].](https://thumb-us.123doks.com/thumbv2/123dok_us/10155950.2917382/62.892.39.757.160.537/table-comparison-oncotype-dx-m-ammaprint-ross-et.webp)


