Mining Group Nonverbal Conversational Patterns
Using Probabilistic Topic Models
Dinesh Babu Jayagopi and Daniel Gatica-Perez
, Member, IEEE
Abstract—The automatic discovery of group conversational be-havior is a relevant problem in social computing. In this paper, we present an approach to address this problem by defining a novel group descriptor called bag of group-nonverbal-patterns (NVPs) defined on brief observations of group interaction, and by using principled probabilistic topic models to discover topics. The pro-posed bag of group NVPs allows fusion of individual cues and fa-cilitates the eventual comparison of groups of varying sizes. The use of topic models helps to cluster group interactions and to quantify how different they are from each other in a formal probabilistic sense. Results of behavioral topics discovered on the Augmented Multi-Party Interaction (AMI) meeting corpus are shown to be meaningful using human annotation with multiple observers. Our method facilitates “group behavior-based” retrieval of group con-versational segments without the need of any previous labeling.
Index Terms—Discovery, group behavior descriptor, meetings, nonverbal cues.
I. INTRODUCTION
C
HARACTERIZING small groups using nonverbal be-havior helps understand and model relationships between the members and a group as a whole. Groups can be analyzed to infer whether its members are engaged in cooperative or com-petitive behavior, to study leadership skills, and in certain cases irresponsible behaviors. In order to do this, various nonverbal cues are known to contain useful information and have been extensively documented in the social psychology literature [19], [27], [31], [33]. Though the verbal channel is the primary mode of communication, the nonverbal channel has very useful and honest (difficult to fake) information, which could be used to predict social attributes like interest, influence, or outcomes of specific interactions [37].The methods to investigate small group research has mostly used manual coders and self-reported data. Recently, with the advent of cheap audio and video sensors and improved perceptual processing methodologies, computational models of social interactions are beginning to appear, particularly using nonverbal cues [15]. The Wizard of Oz type techniques have the potential of being replaced by sensor-based infrastructure
Manuscript received December 23, 2009; revised July 05, 2010; accepted July 12, 2010. Date of publication August 09, 2010; date of current version November 17, 2010. This work was supported in part by the EU project AMIDA and the Swiss NCCR IM2. The associate editor coordinating the review of this manuscript and approving it for publication was Prof. Shrikanth Narayanan.
D. Jayagopi and D. Gatica-Perez are affiliated jointly to the Idiap Research Institute, Martigny, Switzerland, and Ecole Polytechnique Fédérale de Lausanne (EPFL), Lausanne, Switzerland (e-mail: [email protected]; [email protected]).
Color versions of one or more of the figures in this paper are available online at http://ieeexplore.ieee.org.
Digital Object Identifier 10.1109/TMM.2010.2065218
like smart meeting rooms [34] for studying groups offline [9], and for regulating groups online using multimodal visualization [13], [39], [47], interactive furniture [1] or wearable devices [26].
While modeling individuals allows to study dominance [23], [43], status [21], roles [11], [48], personality [38], modeling groups could reveal group interest [16], interactivity and cen-trality in groups [36], and identify cooperative groups against competitive groups [24]. The methods studied so far in the com-putational literature have mostly used supervised learning ap-proaches. In this work, we propose an unsupervised discovery approach to automatically mine group behavior patterns in con-versation, in a robust and data-driven fashion.
This paper addresses the problem of automatically discov-ering group conversational patterns from nonverbal cues ex-tracted from brief observations (here called slices) of interac-tion. We propose and analyze a novel descriptor of interaction slices—a bag of group nonverbal patterns. This group descriptor captures the behavior of the group as a whole and integrates its leader’s position in the group. Using principled probabilistic topic modeling on the group descriptors, we are able to dis-cover group interaction patterns in an unsupervised way. We have used the publicly available Augmented Multi-Party Inter-action (AMI) meeting corpus [7] as our data. We have also car-ried out an objective evaluation of our framework using human judgment with multiple annotators.
The specific contribution of this work is as follows. First, we address the largely unexplored problem of discovering group nonverbal patterns in an unsupervised fashion using proba-bilistic topic models, and more specifically Latent Dirichlet allocation (LDA). Second, we define a new group behavioral descriptor on slices of group conversational data that is robust to several factors occurring in realistic interactions. Third, we study interaction slices of varying duration to understand the discovery process at different time scales. Fourth, we propose new topic-based ways of characterizing groups by aggregating group behavior over multiple interactions. Finally, we show that the topics discovered by our model are meaningful using ground-truth produced from external observers of the interac-tion.
The paper is organized as follows: Section II reviews the literature on automatic modeling of behavior in small groups. Section III introduces our approach. Section IV describes the cue extraction process, the definition of the NVPs, and the LDA model. Section V introduces the data set used in the experi-ments. Section VI presents and discusses the experimental re-sults. Section VII summarizes the findings of our work and pro-vides concluding remarks.
II. RELATEDWORK
In the following subsection, we briefly review the literature on face-to-face group interaction in social psychology and in computing that relates to our work.
A. Group Interaction in Social Psychology
Small group research has a long history in social psychology [2], [32]. The 1951 work by Bales developed a systematic method of observing and describing groups emphasizing that the mental processes of individuals take place in systematic contexts which can be measured and hence allow for explana-tion and predicexplana-tion of behavior in a more exact way. In another pioneering work, McGrath gave special emphasis to temporal processes in group interaction and task performance. Some of the more recent reviews on small group literature include [28] and [40]. Poole et al. [40] identify multiple theoretical perspectives from which small groups have been examined in the literature so far: including among others psychodynamic, functional, temporal, conflict-power-status, and social network. Overall the field is clearly active, and of particular importance for our work are the connections between small groups and nonverbal communication in the workplace [42].
Nonverbal cues have been known to be important in the study of relationship of individuals in groups and group behavior as a whole [19], [27], [31], [33]. Nonverbal cues include prosody, speaking turns, gestures, moves, gaze, etc. Various nonverbal cues correlated with social constructs like dominance, status and power [18] and individual constructs like personality have been extensively studied [25], [44]. Floor occupation patterns (like total speaking time and interruptions), gazing, smiling, touching, and various body positions can be used to infer so-cial verticality in human relations [18].
B. Computational Modeling of Group Interaction
In this section, we summarize the existing literature on in-dividual and group behavior modeling in group conversations using both supervised and unsupervised approaches.
1) Supervised Approaches: Regarding individual behavior modeling, attempts have been made to predict dominant be-havior, certainpersonality traits, and certain roles in which indi-viduals are involved.Dominancecan be defined as a personality trait or behavior involving the motive to control others, the self-perception of oneself as controlling others, and/or as a behav-ioral outcome (success in controlling others or their resources) [18]. In [43],dominant behaviorwas predicted by computing speaking turns based features (like total speaking time, turns, successful interruptions) using manual annotations of speaking turns on the M4 meeting corpus. The work in [23] studied au-tomatic prediction of dominant behavior using speech activity and motion activity based cues on the AMI meeting corpus. The work also established the possibility of improving the predic-tion performance by fusion of individual cues. Personality traits, specificallyextraversion(sociable, assertive, playful) versus in-traversion(aloof, reserved, shy) were predicted using support vector regression and applied to 1-min sequences of the Mis-sion Survival (MS) Corpus [38]. In the work in [11], functional roles in meetings related to tasks and socio-emotional roles were
predicted using a multi-class support vector machine (SVM) on the MS Corpus. Finally, in [14] and [48], adhoc roles in broad-cast video and the AMI corpus were predicted using dynamic Bayesian models.
Regarding group behavior modeling, group activities have been characterized employing layered sequential approaches [either hidden Markov models (HMM) or dynamic Bayesian networks (DBN)], where the first layer modeled the individ-uals’ behavior, and the second layer the activity (monologue, presentations, or discussions) in [8] and [50] or conversational regimes (convergence or monologue, dyad-link and divergence) in [35]. While [8] and [50] employed speaking-activity and motion-activity in terms of blobs as the features, [35] em-ployed speaking-activity and visual gaze. The latter work was also extended to predict interpersonal influence [36]. Group interest was investigated by segmenting meetings temporally into high or neutral interest level in an HMM based supervised framework and fusing audio-visual cues in [16]. Group dy-namics emerging out of groups that differ in their objectives are distinct [32]. Inspired by this observation, the work in [24] classifies two types of groups differing in the nature of their objective—cooperative versus competitive by fusing var-ious speaking-activity based nonverbal cues. Recently, group discussion dynamics was studied further with two different corpora (in two different languages) and the group performance was predicted by inspecting the nonverbal patterns of the group interaction [12].
2) Unsupervised Approaches: Unlike the previous methods, unsupervised approaches do not need labeled training data. Re-garding individual behavior modeling, the pair-wise influence between participants in a group was predicted using a dynamic Bayesian approach [3]. The observations were speaking activity features and influence was estimated using a variation of the coupled HMM called the influence model. On the AMI corpus, two facets of social verticality [18], i.e., role-based status and dominance, was predicted, by employing speaking turns as well as visual attention based cues [21]. On the Augmented Multi-Party Interaction with Distance Access (AMIDA) corpus, the remote participant in a remote meeting was predicted [45]. In another study, on a corpus collected from a TV show, the task was to predict the participant who would be fired from the group [41]. The above two works employed speech activity based cues. In all the cases excepting the influence model, the best single features for the prediction tasks were investigated.
Regarding group behavior modeling, various prosody related cues correlated with interesthot-spots, where the interest level of the meeting participants was perceived to be high was studied in [49]. Other works have also attempted to quantify interac-tivity and centrality in meetings [36].
Our work differs significantly from the approaches men-tioned so far. We propose an unsupervised discovery method to extract group conversational patterns. We characterize robustly meeting time slices in terms of group behavior de-scriptors (bag-of-NVPs) and employ principled probabilistic topic models to extract topics. We later interpret if the discov-ered topics have a semantic meaning that human observers can indeed appreciate. The bag framework facilitates the cue integration task. Unlike supervised approaches which need
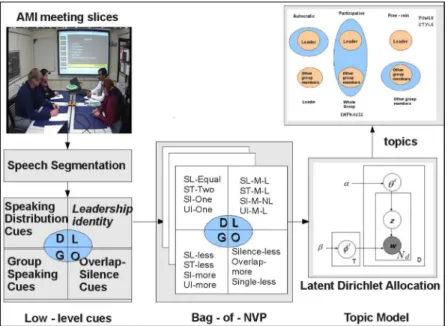
Fig. 1. Overview of the group NVP discovery process using topic models.
extensive annotation for training purposes which might be diffi-cult to produce in real-life group interactions, our approach uses annotation only for evaluation purposes leading to significant simplification of annotation efforts, while we could work on a large data set (17 h of meeting data). By carefully designing the nonverbal cue set, the framework can be used to query a large meeting database to retrieve specific meeting slices exhibiting “group behavior” of interest to the user. A preliminary version discussing a small part of the work presented here was reported in [22].
III. OURAPPROACH
Different individuals have different speaking, gesturing, and gazing styles. Group dynamics evolve out of these individual styles constrained by social rules. While some groups speak or interrupt a lot, others tend to be more silent. While some groups are more egalitarian either in nature or due to the performed task, some other groups have status differences leading to differences in the level of participation.
In order to capture such differences in a data-driven fashion, we first define group descriptors (bag-of-NVPs) and then cluster them. So our approach consists of two stages. First, analogous to how topics could be inferred from a text collection by rep-resenting documents in a corpus as histograms of words (so-called bags-of-words), we propose to discover the group be-havior patterns by characterizing the group dynamics in terms of bag-of-group NVPs or bag-of-NVPs for short. In a second stage, we use the LDA topic model to discover topics by con-sidering co-occurence of NVPs, i.e., NVPs that tend to co-occur get clustered as NVPs belonging to the same topic. It is impor-tant to note that the topics discovered by LDA are not to be con-fused with the actual topic that the group discusses. We hypothe-size that there is enough structure in the behavioral patterns that by clustering them by a method that exploits co-occurrence, we would observe meaningful “group behavior topics”. Following
our analogy with text, in our analysis and discussion, we inter-changeably use “words” and “NVPs” to refer to the group non-verbal behavior descriptors.
Fig. 1 shows the overview of our work. First, we ex-tract low-level nonverbal cues from interaction slices of small-group meetings. We then quantize these cues to pro-duce a bag-of-NVPs. Finally, we mine the collection of bags-of-NVPs using a probabilistic topic model to discover joint patterns of group conversational behavior. We experiment with meeting slices of different duration, to study the effect on the bag representation and the discovery process.
Various nonverbal cues are known to be correlated with in-terpersonal relations [18]. Building our group behavioral de-scriptor as a bag-of-NVP has the following advantages:
• it facilitates fusion of individual cues;
• through aggregation over people and time, the cues are made more robust compared to low-level individual cues; • the use of group NVPs facilitates the eventual comparison
of groups of varying sizes;
• it allows for the usage of principled methods for unsuper-vised learning.
The proposed bag-of-NVPs includes two types of patterns:
generic group patterns and leadership patterns. The generic group patterns are descriptors about the group as a whole without taking the identity of the interactions into account. The leadership patterns are descriptors about the “leader” in the group, assuming that such a role is played by a team member (a situation that is pervasive in the workplace). In other words, the generic group patterns can describe any group, whereas the leadership patterns apply to those groups with a leader. In our study, such a split allows us to consider the effect of the predominant person of the group. Though in this work, we con-sider conversational patterns alone for our bag-of-NVPs, this framework can be easily extended to include various other mul-timodal descriptors—like gazing or “looking-while-speaking” patterns as well.
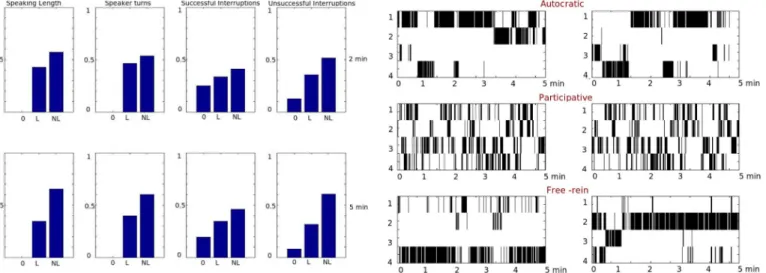
Fig. 2. Diagram showing the features to characterize individual and group behavior (generic-based and leadership-based) extracted in our approach. See main text for details.
IV. LOW-LEVELCUEEXTRACTION, BAG-OF-NVP GENERATION,AND THETOPICMODEL
A. Low-Level Nonverbal Cue Extraction
We extract the following speaking activity based cues (see Fig. 2). For each interaction slice from a given group conver-sation recorded with close-talk microphones, we first perform a binary speech versus silence segmentation for the group members at each time step (five frames per second). Tradition-ally, speaking status is computed from the speaking energy, by thresholding the energy values. In our work, we employ an im-proved approach which deals with the presence of cross-talk ef-ficiently [10]. This binary variable indicates the speaking/non-speaking (1/0) status of each person at each time step. Alter-natively, the speaking status could also be obtained by speaker diarization on far-field microphone data.
Next, we extract low-level individual cues that are related to conversational floor occupation. It is well known that these cues signal various facets of social verticality [18] and other phe-nomena such as group interest [16] and interactivity [36], etc.
The individual cues include:
• Speaking Length (TSL(i)): This feature considers the total time that person speaks according to the speaking status. • Speaking Turns (TST(i)): We define a turn as a contin-uous period of time for which the person’s speaking status is “true”. TST is accumulated over the entire meeting for person .
• Successful Interruptions (TSI(i)): The cumulative number of times when person starts talking while another person speaks, and finishes his or her turn before does, for all , , i.e., only interruptions that are successful are counted.
• Unsuccessful Interruptions (TUI(i)): The cumulative number of times while the person is speaking, another person starts talking, and finishes his or her turn before does, for all , , i.e., only unsuccessful interruptions by someone else are counted. Some of these unsuccessful interruptions likely include backchannels as well. We do
not differentiate them from unsuccessful interruptions in this work.
The group cues are of three types.
1) Speaking Distribution Cues: LetTSLdenote the vector composed of elements, whose elements are TSL for each participant after normalization (elements sum up to one). We employ an analogous notation forTST,TSI, andTUI.
2) Overlap-Silence Cues:From the speaking status of all the participants, the following features were computed:
• Fraction of Overlapped Speech (FO): ; • Fraction of Silence (FS): ;
• Fraction of Non-Overlapped Speech (FN):
where is the total number of frames in a meeting, is the number of frames when no participant speaks, is the number of frames when only one participant talks and is the number of frames when more than one participant talks.
3) Group Speaking Cues: From speaking length, turns and interruptions of each of the group members, the following ad-ditional features are computed to characterize their joint group behavior.
• Group Speaking Length (GSL): This feature mea-sures how much the group speaks per unit time
.
• Group Speaking Turns (GST): This feature mea-sures how many turns the group takes per unit time
.
• Group Successful Interruptions (GSI): This feature mea-sures how many interruptions the group makes per unit
time .
• Group Unsuccessful Interruptions (GUI): This feature measures how many unsuccessful interruptions the group
makes per unit time .
• Group Successful Interruptions-to-Turns Ratio (GIT): This feature measures the ratio of total successful in-terruptions the group makes to the total turns they take
.
• Group Unsuccessful Interruptions-to-Turns Ratio (GUT): This feature measures the ratio of total unsuccessful inter-ruptions the group members make to the total turns they
take .
B. Bag-of-NVPs Generation
We then quantize these group cues to produce a bag-of-NVPs. Our bag model includes two types of patterns. The generic group patterns characterize the group conversational behavior whereas the leadership patterns characterize the leader’s conversational behavior.
1) Generic Group Patterns: The generic group patterns themselves are of three types—Speaking Distribution patterns
describe whether all the group members get equal opportunities to occupy the floor, etc. Overlap-Silence patterns capture the behavior about the competition to capture the floor, and finally theGroup Speaking patternscapture the fact whether a particular group speaks, interrupts, etc., more or less compared to the average level. We explain the construction of each of the patterns in the following.
Speaking Distribution Patterns: We quantize each of the vectorsTSL,TST,TSI, andTUIdirectly into one of the five
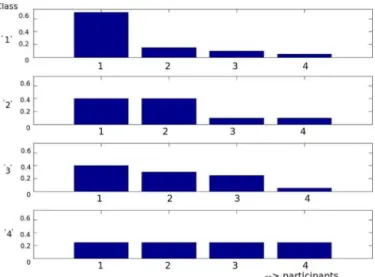
Fig. 3. Example joint histograms for each of the speaking distribution NVPs other thanSilence.
classes—Silence, One, Two, Rest, and Equal—to describe a group. The class depends on whether silence (“0”), one-person (“1”), two-person (“2”), three or more (“3”), or all people (“4”) share most of the probability mass for a particular nonverbal cue. We expect egalitarian groups to belong to class “4”. The goal is to map a joint cue over an interaction slice (e.g., speaking length) into a prototypical case (e.g., an interaction pattern in which all people talk about the same time, one person spoke most of the time, etc.) where people identity is not important, and therefore makes the description generic. The actual rule is described as follows: Let
represent the input vector corresponding to an individual nonverbal cue after sorting it in descending order. The output class is “1” if the first element of satisfies the
condition . The output class is
“2” if and
the output class is “4” if , where
represents a small interval like 0.05 or 0.1 (representing the minimum probability mass value that a person should have so that the interaction belongs to class “4”). Finally, the output class “3” is used as a catch-all class. Fig. 3 shows an example histogram for each of the classes other than silence for a group with .
The 20 words corresponding to the egalitarian speaking patterns are SL-Silence, SL-One, SL-Two, SL-Rest,SL-Equal;
ST-Silence, ST-One, ST-Two, ST-Rest, ST-Equal; SI-Silence,
SI-One, SI-Two, SI-Rest, SI-Equal; and UI-Silence, UI-One,
UI-Two,UI-Rest,UI-Equal.
Overlap-Silence Patterns:We quantize each of Fraction of Overlapped Speech, Fraction of Silence, and Fraction of Non-Overlapped Speech into one of two classes—moreandless. This quantization depends on the relative value of the considered group conversation to the average value computed over the en-tire conversation dataset. If the current value is more than the average, we quantize it asmore. Otherwise, we quantize asless. The six words corresponding to the Overlap-Silence patterns are
Overlap-more,Overlap-less,Silence-more,Silence-less, Single-more, andSingle-less.
Group Speaking Patterns: We quantize each of Group Speaking Length, Group Speaking Turns, Group Speaking In-terruption, Group Unsuccessful Interruptions, Group Speaking Interruption-to-Turns Ratio, and Group Speaking Backchan-nels-to-Turns Ratio into one of two classes—more andless, similar to the extraction of Overlap-Silence patterns explained in the previous paragraph. The 12 words corresponding to the Group Speaking patterns areGSL-more,GSL-less,GST-more,
GST-less,GSI-more,GSI-less,GUI-more,GUI-less,GIT-more,
GIT-less,GUT-more, andGUT-less.
2) Leadership Patterns: As discussed in Section III, very often there are meetings with a designated leader (e.g., a manager). Social verticality in groups has been shown to be correlated to floor occupation related nonverbal cues [18]. Previous works have shown that the person with the highest speaking time correlates with the most dominant person [23], highest number of speaking turns correlates with role-based status [21], and highest number of successful interruptions signals real status and power [41]. In order to capture the leader’s position in the group, we add three more words to the NVP vocabulary for each of the four sets of features to indicate whether the designated leader (“L”) or someone else (“NL”) is the one who has the maximum. When the interaction slice is silent, we mark the class as silence (“Silence”). For example, the presence of SL-M-L means that in this time slice, the leader has the maximum speaking length and the presence of
SL-M-Silencemeans that no one speaks in this interaction slice. Together with the words that characterize the generic group patterns, these words describe the position of the leader. The 12 words corresponding to the leadership patterns are SL-M-Si-lence, SL-M-L, SL-M-NL; ST-M-Silence, ST-M-L, ST-M-NL;
SI-M-Silence, SI-M-L,SI-M-NL; UI-M-Silence, UI-M-L, amd
UI-M-NL. Please note thatSL-M-Lis not equivalent toSL-One. WhileSL-M-L says the leader speaks the most,SL-One says there is one person dominating the discussion. Consider this typical scenario where a leader is challenged by another par-ticipant. In this case, the leader could speak the most (pattern
SL-M-L appears). But the discussion involves two people, hence patternSL-Two(instead ofSL-One) also co-occurs.
The overall size of the NVP-bag vocabulary is 50 and each document (i.e., group interaction slice) contains exactly 12 words. A significant advantage of our representation is that it is robust to the number of participants and hence allows the comparison of groups of different sizes. Also, the framework easily allows the possibility of increasing the size of the vocab-ulary by considering more nonverbal cues that are of behavioral interest, in a similar fashion.
Robustness of Bag-of-NVPs: By construction, the bag-of-NVPs is tolerant of minor variations in the observed low-level cues. So, the bag-of-NVPs are robust with respect to slight vari-ation in individual cues, relative proportion of the group cues, and number of participants. We illustrate this using simple ex-amples. Consider a group of four participants interacting for 5 min (300 s), and let the speaking turns of individual participants be distributed as follows: (40, 10, 10, 6). The group speaking turns for the four participants is 66/300. Let us now assume that the average group speaking turns estimated from the corpus is 40/300. Then this group interaction is mapped toST-more. Also,
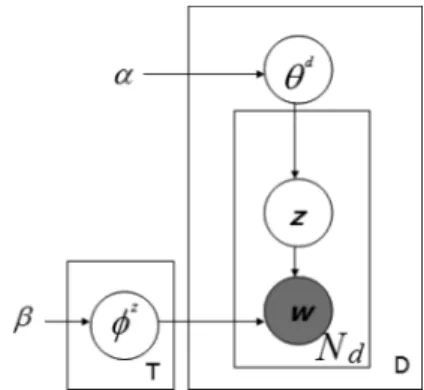
Fig. 4. Latent dirichlet allocation (LDA) model.
it is mapped toST-One, showing that there is one person dom-inating the interaction as he has more than 60% of the turns. Now, consider the following perturbations in
1) individual cues: Even when we perturb the individual cues to say (35, 10, 10, 6), this interaction still is mapped to
ST-moreNVP.
2) relative proportion of the group cues: If we perturb the pace of the interaction, resulting in more turns (1.5 times) for each of the participant obtaining (60, 15, 15, 9) as com-pared to (40, 10, 10, 6). These cues are again mapped to
ST-One, which means that there is still one person domi-nating. These egalitarian cues capture the status hierarchy independent of the pace of the interaction.
3) number of participants: Consider the scenario of adding another participant and let the speaking turns then be (38, 8, 8, 8, 4), this interaction would still be mapped toST-more
andST-OneNVPs.
As the example shows, the bag is insensitive to situations, like the above, which occur often in group conversations.
C. Latent Dirichlet Allocation (LDA) Topic Model
Topic models are probabilistic generative models that were originally used in text modeling. In Latent Dirichlet allocation [4], a text document is modeled as a distribution over topics, and a topic as a multinomial distribution over words. The topics discover patterns based on word co-occurrence.
Let there be documents in a corpus and let a document con-tain words. Let denote the total number of unique words in the corpus. The probability of a given word assuming
topics is , where is
a latent variable indicating the topic from which the th word was drawn. Each document is generated by choosing a distribu-tion over topics . Each topic is characterized by a word distribution over the vocabulary of words . In LDA, is a Dirichlet and is a Dirichlet
, where and are hyperparameters (see Fig. 4). Given and , the joint distribution of the set of all words , topics for each of the words , , , in a given document is given by
(1)
where is the topic assignment of the th word.
We first infer the posterior distribution over for a given doc-ument ( is given) by marginalizing over and , then esti-mate parameters and using word-topic and document-topic counts. Later we interpret the topics using the top words (with highest probability) and the documents as mixture of these topics [17], [46]. To estimate , we use Gibbs sampling (a Markov chain Monte Carlo (MCMC) type method [30]) where we sample sequentially each component, , conditioned on the rest of the components, :
(2) The numerator of (2) can be further expanded as
(3) By integrating over , we can derive
. The assumption of a Dirichlet prior for and the Dirichlet distribution being the conjugate prior for multinomial distribution helps us obtain in closed form. By integrating over , we can obtain , the second term in (3). Following a similar procedure, the denominator of (2) can also be obtained. After a burn-in period, this procedure of sampling sequentially all the compo-nents of yields a stationary distribution which corresponds to the probability distribution . For more details about implementing the Gibbs sampling procedure for an LDA topic model, the readers should refer to [20] and [46].
D. From Interaction Slices to Group Characterization
Using the notations in the preceding subsection, any meeting slice can be represented by its topic distribution . When multiple slices of interaction are available for a particular chosen group g, , the aggregated group description can be ex-pressed as
(4)
This distribution can then be used to characterize and com-pare groups.
V. MEETINGDATA
We use meetings from the AMI corpus [7]. The room contains a table, slide screen, and white board. A circular microphone array containing eight evenly distributed sources is set in the middle of the table, and one with four microphones is set at the ceiling. Participants were also asked to wear both headset and lapel omni directional microphones, which were attached via long cables to enable freedom of movement around the room. Three cameras were mounted on the sides and back of the room to capture mid-range and global views, respectively, while four
Fig. 5. Examples of the seven camera views available in the meeting room. The top row shows the right, center, and left cameras while the bottom row shows the view from each of the close-up cameras.
additional cameras mounted on the table captured the individ-uals (see Fig. 5).
From the AMI data, we used 37 meetings for our meeting data, consisting of ten different sets of participants (i.e., groups which do not have any member who is common). Each group consisted of four participants, who were given the task of designing a remote control over a series of meeting sessions. The level of previous acquaintance among the group mem-bers varied from being completely unacquainted to knowing each other well. Each participant was assigned distinct roles: “Project Manager”, “User Interface Specialist”, “Marketing Expert”, and “Industrial Designer”. During each meeting ses-sion, the team was required to carry out certain tasks, such as a presentation on particular subjects related to the task, or a discussion about a particular aspect. To encourage natural behavior, the meetings were not scripted and the teams met over four sessions each of 20–30 min so that they achieved the common goal. For three groups, the data from one of the four meeting session could not be used (due to recording issues).
VI. EXPERIMENTS ANDRESULTS
The 37 meetings constitute 17 h of recorded data. From this large pool of conversational data, we sampled meeting slices of various durations. We used the audio from the head-set mi-crophones to compute our low-level cues and the bag-of-NVPs. First, we analyze the distribution of our bag features at var-ious time scales to understand the effect of the time-slice dura-tion on the bag features. Later we report and analyze the topics using certain combinations of the bag features. Though we ex-perimented with all the possible combinations with the four sets of patterns discussed in Section IV-B—Speaking Distri-bution,Overlap-Silence,Group Speaking, andLeadership pat-terns—due to space reasons in this section, we report the results with only those combinations that bring new and different in-sights to understand conversational group behavior. Also, our method discovered topics for the selected combinations at two representative time-slice durations—one short (2-min) and an-other long (5-min) to understand the difference in the topics dis-covered at these two different time scales. We report results on
Fig. 6. Empirical distribution of Speaking Distribution patterns at different time scales (from 30-s to 5-min).x-axis of each of the sub-figure is the classes andy-axis is the probability of the particular class.
topic discovery for multiple time scales only for the first com-bination [the Speaking Distribution-Leadership (DL) combina-tion]. For the rest of the combination, we report the discovery results only at 5-min scale due to space reasons.
A. Bag-of-NVPs Over Varying Slice Duration
We visualize the distributions of theSpeaking Distribution
patterns and theLeadershippatterns among the various classes. The distributions ofOverlap-SilenceandGroup Speaking pat-terns are not considered because they are equally distributed among the two classes—moreandless—and it is related to the way features are constructed.
Fig. 6 visualizes the distributions of the Speaking Distribu-tion patterns ofTSL,TST,TSI, andTUIamong the five classes (“0” to “4”) at different time scales. It is interesting to observe that the group interactions look more like a monologue at finer time scales (e.g., 1-min) and like a discussion at coarser time scales (e.g., 5-min) (looking at the probability mass of classes 1, and 4 for speaking length and speaker turns). A gradual transi-tion between these patterns can be observed as the slice duratransi-tion increases. Also, successful interruptions are not very common at fine time scales, as seen by the significant probability mass at class 0. 1-person, 2-people, 3-people or all participants in-terrupting are more or less equiprobable at 5-min scale. Single person getting interrupted unsuccessfully looks common at all scales (as the probability mass at class 1 is quite significant).
Fig. 7 shows the distribution of leadership patterns at two dif-ferent time scales. If all the four participants had equal status (egalitarian groups), the probability mass at “L” (resp. “NL”) would be close to 0.25 (resp. 0.75). Qualitatively, the distribu-tion shows that the average statistics of AMI data are close to uniform at some time scales, though individual leaders could have different styles, which we discover using the LDA model.
B. LDA-Based Pattern Discovery
In our LDA experiments, we use 5-min and 2-min scales as representative examples and consider meeting slices from the 37 AMI meetings with overlap. The number of documents for
Fig. 7. Empirical distribution of leadership patterns at two different time scales (2-min and 5-min).x-axis of each of the sub-figure is the classes andy-axis is the probability of the particular class. “0” corresponds to the case when there is silence, “L” (resp. “NL”) when leader (resp. someone else) has maximum feature value.
Fig. 8. Leadership styles by Lewinet al.The blue envelope shows the emphasis (in terms of power) that is placed on the various group members.
5-min slices is 873 and 2-min slices is 947. We set (intro-duced in Section IV-B) as 0.05. Steyverset al.explain the role of the parameters and of the LDA model in [46]. For text collections, they use symmetric Dirichlet distribution for and , with each of the and . For our application and corpus, we also used a symmetric Dirichlet distribution with set to 3 and set to 0.01. Several other tested values , 2, 4, 5 or , 1 returned similar results.
1) LDA-Based Pattern Discovery at 5-Min Scale: We first present results for our group descriptor that contains both Speaking Distribution and Leadership patterns (DL combina-tion). We applied our LDA-based discovery procedure varying the number of topics ; we report the results using
topics. Though we fixed the number of topics as three, the number of topics can be increased to get a more detailed understanding of group behavior topics. Table I shows the resulting top seven words for each of the topics. Looking at the top words of Topic 1 (SL-M-L,ST-M-L,SI-M-L,UI-M-Lterms which means that the leader speaks and interrupts the most, and gets the interrupted unsuccessfully the most), it resembles a
Fig. 9. Speech segmentation of two sample 5-min meeting slices for each of the three topics—autocratic,participativeandfree-rein. The four participants are marked 1, 2, 3, and 4 along they-axis. The position marked 1 corresponds to the leader (project manager) in all cases.
TABLE I
LDA BASEDTOPICDISCOVERY AT5-MINSCALE(DL COMBINATION)
meeting where the leader is dominant or autocratic (talks more, more often, and interrupts more) and hence the titleautocratic. Topic 2 seems to characterize an egalitarian or participative meeting (top words beingST-Equal,SL-Equal,SI-Equal—all participants speak and interrupt equally), whereas Topic 3 represents a meeting where there is a single dominant person who, interestingly, is not the leader (top words beingSL-One,
SI-One, UI-M-NL, SL-M-NL, ST-M-NL, SI-M-NL—meaning someone other than the leader speaks and interrupts the most). Based on manual inspection, these patterns for the project managers of AMI meeting slices discovered for topics seem to resemble the three classic leadership styles of Lewin
et al.[29] as illustrated in Fig. 8. The three styles—autocratic
(when the decisions are determined by the leader), partic-ipative (when the leader encourages group discussion and group decision making), and free-rein (when the group or an individual has complete freedom to decide without leader participation)—differ according to the emphasis (in terms of power) it places on the leader, the whole group, or the rest of the group. The speech segmentation of two examples from each of the three topics are visualized in Fig. 9.
2) Objective Evaluation: To evaluate how meaningful the discovered topics are, we carried out human annotations.
TABLE II
EVALUATION: CONFUSION MATRIX BETWEEN THEGROUND-TRUTH AND THEMODELOUTPUT
Fig. 10. Topic distribution over groups at 5-min scale (DL combination).
We adopted the following protocol, as the cost of annotating the whole corpus is extremely large. For each of the three topics—autocratic,participative, andfree-rein—we ranked the meeting slices according to and picked the top eight documents. Each of these 24 meeting slices were annotated by three independent annotators. In the protocol, an annotator annotates a particular group only once to avoid potential bi-ases by observing the same group for the second time. The ground-truth is the class that the majority of the annotators agreed. The instructions given to the annotators appear in the Appendix.
On this data, we see that the prediction accuracy of our model for theautocraticclass is 62.5%,participative class is 100%, andfree-reinis 75%. The confusion matrix is shown in Table II. The results suggest that leaders in the AMI corpus do not show a strong autocratic nature, as seen by the prediction accuracy as well as the top words of theautocratictopic. Whilefree-rein
case has words likeSL-One,ST-Oneas top words, the autocratic case has onlySI-TwoandST-Restwords as top words (which implies that though the leader speaks the most, he lets others participate as well).
3) Characterizing Groups: Using the above representation and (4) in Section IV-D, we estimate the topic distribution for each of the ten groups of participants and show it in Fig. 10. As one can observe, different groups have different signature distribution of topics. For example, groups 1, 2 seem to have a leader who is less participative as compared to the leader in groups 5, 9, 10.
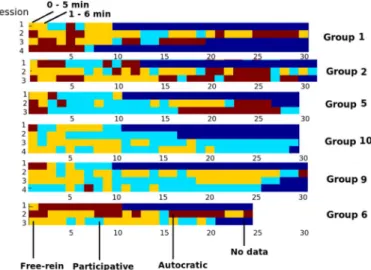
It is also interesting to visualize the topic evolution of several groups with respect to time (Fig. 11). The topic shown is the topic with the maximum probability for that meeting slice. Each
Fig. 11. Topic evolution for selected groups at 5-min scale (DL combination). The topics are color coded—autocraticin red,participativein light-blue, free-reinin yellow. Thex-axis represents time. They-axis represents meeting ses-sions.
TABLE III
LDA BASEDDISCOVERY AT2-MINSCALE(DL COMBINATION)
Fig. 12. Topic distribution over groups at 2-min scale (DL combination).
of the six meeting slices have an overlap of 4 min with the next meeting slice. The -axis represents time and the -axis is the session number (explained in Section V). It is interesting to ob-serve that while the leader in group 1, 2, 6 does not show partici-pativestyle, group 5 does not showfree-reinstyle and group 10, 9 does not showautocraticstyle. Also,autocratictopic seems
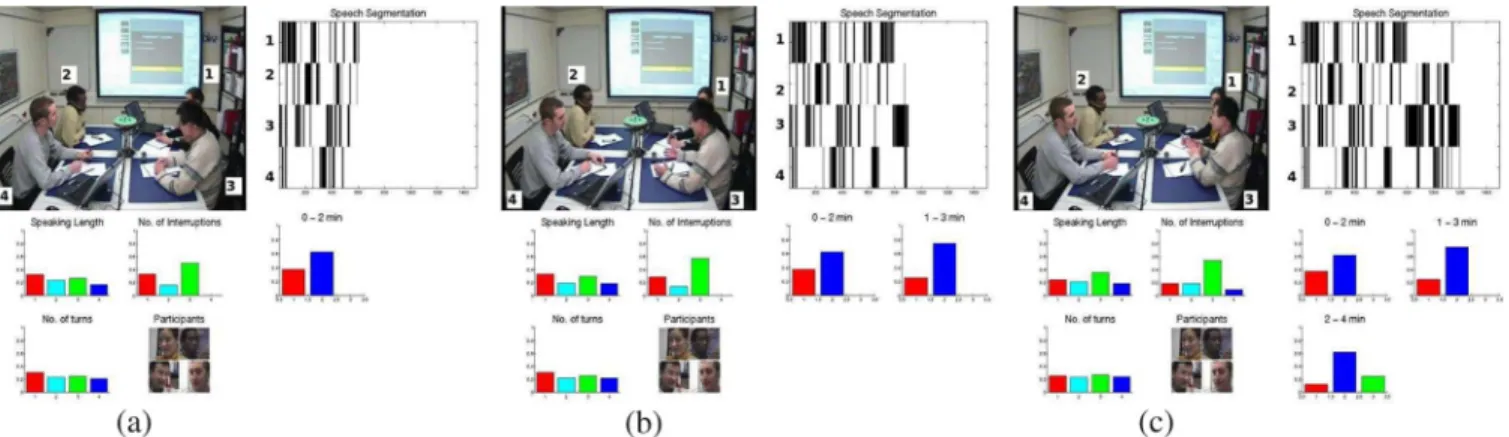
Fig. 13. Three snapshots of a group interaction—at 2-min, 3-min, 4-min—with the top left panel showing the center view camera, the top right showing the speech segmentation evolution w.r.t time inx-axis and the participants in they-axis, the bottom left panel showing the low level cues for each of the participant, and the bottom right panel showing the topic distribution—red beingautocratic, blue beingparticipativeand green beingfree-reinfor the intervals 0–2 min, 1–3 min, and 2–4 min. This meeting slice corresponds to group 5, which isparticipativeat both 2-min and 5-min time scales.
more common in the beginning and the end of the meeting ses-sion, whereas theparticipativetopic appears more often during the middle.
4) LDA-Based Pattern Discovery at 2-Min Scale: The same experiments were repeated with topics on 2-min meeting slices (see Table III). We observe that the same three topics emerge, with some differences. For the case of the free-rein
topic, the top four words are also present in the 5-min case as well. A new wordSI-Silencebecomes significant at the 2-min scale. For the other two topics, we observe that the words in au-tocraticandparticipativetopics are also similar to those of the 5-min case (SL and ST related words are the same).
Fig. 12 shows the topic distribution for the ten groups of par-ticipants at 2-min scale. As compared to the 5-min case, the dis-tribution seems to be more balanced across the three topics. This suggests qualitatively that the interaction styles (as defined here in terms of discovered topics) seem to be captured more strongly over longer intervals of time. Such a conclusion is only qualita-tive due to the fact that the “interaction styles” are intrinsically sensitive to time granularity. Nevertheless, in a few cases, some trends are stable. For instance, groups like group 5, which are moreparticipativethan other groups at both 5-min and 2-min scales, make a more egalitarian group, as compared to for in-stance group 1 which looksautocratic at both scales. Fig. 13 shows some snapshots of automatic group behavior discovery. Additional material illustrating our group behavior discovery can be found at http://www.idiap.ch/~djaya/TranMM10/.
5) LDA-Based Pattern Discovery for Alternative Bags of Nonverbal Behavior: Next we analyze the Overlap-Silence Leadership (OL) combination to understand the relationship between the leader behavior and the competition to occupy the floor. For space reasons, we discuss only the 5-min results.
Table IV shows the resulting top seven words for each of the topics. The first topic corresponds to the case when the leader dominates (talks more, more often, interrupts more, and gets unsuccessfully interrupted the most—indicated by words likeSL-M-L,ST-M-L,SI-M-L, andUI-M-L) but the group also has many silent frames, showing that the leader might not be leading to an interactive group behavior. The second topic char-acterizes a group which is interactive with presence of
overlap-Fig. 14. Speech segmentation of two sample 5-min meeting slices for each of the three topics—leader-domination,group Interaction, andmonologue. The
x-axis indicates time. The four participants are marked 1, 2, 3, and 4 along the
y-axis. The position marked 1 corresponds to the leader (project manager) in all cases.
ping frames, and less cases of silence (indicated by words like
Overlap-moreandSilence-less). The third topic characterizes a presentation type meeting slice, where there is a single person who is not the leader talking most of the time and there is not much of interaction among the group members (indicated by words likeSingle-more,Overlap-less). Overall, the patterns ex-tracted with this bag are different than the ones exex-tracted using the DL combination. The speech segmentation of two examples from each of the three classes are visualized in Fig. 14.
Finally, we analyzed the Overlap Silence-Group Speaking-Speaking Distribution (OGD) combination to understand the common topics by clustering the generic group patterns. This combination is useful to analyze groups that do not have a des-ignated leader.
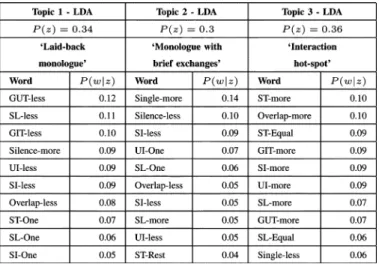
Table V shows the resulting top ten words for each of the topics. The first topic corresponds to the case when the group speaks less (is laid-back—indicated by words likeSilence-more,
TABLE IV
LDA BASEDDISCOVERY AT5-MINSCALE(OL COMBINATION)
Fig. 15. Speech segmentation of two sample 5-min meeting slices for each of the three topics—laid-back monologue,monologue with brief exchanges, and
interaction hot-spot. Thex-axis indicates time. The four participants are marked 1, 2, 3, and 4 along they-axis. The position marked 1 corresponds to the leader (project manager) in all cases.
there is a single speaker and indicated by words like SL-One,
ST-One). The second topic characterizes a group where there are two others who challenge the presenter (the presence of the wordSL-Oneindicates that there is one person who speaks more than half of the total speaking time and ST-Rest indi-cates that three people get significant speaking turns). The third topic characterizes an interactionhot-spotwhere there is lots of interaction (indicated by the presence of words likeST-more,
SL-more, Overlap-more) and everyone is participating (indi-cated by words likeST-Equal,SL-Equal). The speech segmen-tation of two examples from each of the three classes are visu-alized in Fig. 15.
VII. FINALDISCUSSION ANDCONCLUSION
Overall, our work has shown a way of discovering conversa-tional group behavior in a data-driven approach. Our method to characterize group behavior by defining group descriptors and then mining them using topic models is promising, allowing for the possibility of learning models to analyze group behavior on large meeting corpora in an unsupervised way, and therefore saving a potentially huge annotation effort (compared to super-vised approaches).
TABLE V
LDA BASEDDISCOVERY AT5-MINSCALE(OGD COMBINATION)
The proposed bag-of-NVPs described the group in an inter-pretable and robust fashion, allowing fusion of individual cues, and allowing the comparison of groups of different sizes. The current definition of the bag-of-NVPs could be further extended in the following way. The quantization procedure to generate the bag now depends on the relative feature values of the consid-ered group conversation compared to the average feature values computed over the entire conversation corpus. By using a large corpus constructed to be statistically representative, such a defi-nition could be further strengthened. Another possibility would be to learn the NVP vocabulary via a more elaborate quantiza-tion procedure, e.g., as currently investigated in computer vision for visual representation problems [5]. Though in this paper we defined and analyzed group conversational patterns derived only from the audio modality, the bag approach can be extended to in-clude multimodal features—e.g., combining prosodic cues and visual attention-based cues, among others. This is planned to be investigated as part of future work.
The LDA model automatically discovered the topics based on co-occurence of bag-of-NVPs, and any meeting slices can be described as a probabilistic mixture over the discovered topics. Using the combination of egalitarian and leadership patterns, our method was able to discover group interaction patterns that resemble prototypical leadership styles—autocratic, participa-tive, andfree-rein—proposed in social psychology. An objec-tive evaluation of our methodology involving human judgment and multiple annotators, showed that the learned topics indeed are meaningful. One problem not addressed here is model selec-tion (i.e., how many topics are needed). In order to evaluate the number of topics and the consistency of the NVP distributions of topics, a variety of other approaches could also be considered [6]. Finally, we could investigate other models, for instance to jointly discover group patterns and the groups that best fit them. All these are separate research issues that would be better inves-tigated as part of future work.
In terms of applications, our work allows for retrieval of group conversational segments where semantically meaningful group behaviors emerge. Our framework can also help char-acterize groups by aggregating group behavior over multiple interaction slices. This might help understand how groups are
different from each other in a formal probabilistic sense. We also showed the possibility of visualizing group behavior over time, which could open interesting application options. For instance, in the case of discovering leadership styles, we could understand how the manager employs different leadership styles during different phases of a meeting series. Investigating these aspects in further detail is also the subject of future work.
APPENDIX
In this Appendix, we provide the instructions given to the external observers for the experimental evaluation in Section VI-B.
Lewinet al.(1948) describes three classic leadership styles as illustrated in Fig. 8. The three styles—”autocratic” (A), “partic-ipative” (P), and “free-rein” (FR)—differ according to the em-phasis (in terms of power) placed on the leader, the whole group, or the rest of the group.
• TheAutocratic style corresponds to the case when the leader makes decisions himself.
• TheParticipativestyle refers to the case where the leader includes all the group members in the decision-making process.
• A leader using aFree-Reinstyle allows (consciously or unconsciously) the group members to make the decision. Kindly look at the meetings assigned to you and answer each of the following questions.
1) Which of the three categories do you think this meeting belongs to—autocratic, participative, or free-rein? Choose only one.
2) How confident are you about this decision?
3) Add any specific comments regarding the annotation of this meeting, if you want.
The instructions are based on the definition of the categories, but do not provide any information about the specific nonverbal behavior that the annotators should base their decision upon, or about the method that produced the dataset people are supposed to annotate.
ACKNOWLEDGMENT
The authors would like to thank all of the people who helped in the annotation process.
REFERENCES
[1] K. Bachour, F. Kaplan, and P. Dillenbourg, “Reflect: An interactive table for regulating face-to-face collaborative learning,” inProc. 3rd Eur. Conf. Technology Enhanced Learning: Times of Convergence: Technologies Across Learning Contexts, 2008, pp. 39–48.
[2] R. F. Bales, Interaction Process Analysis: A Method for the Study of Small Groups. Cambridge, MA: Addison-Wesley, 1950.
[3] S. Basu, T. Choudhury, B. Clarkson, and A. Pentland, “Towards mea-suring human interactions in conversational settings,” inProc. IEEE CVPR Workshop Cues in Communication, 2001.
[4] D. M. Blei, A. Y. Ng, and M. I. Jordan, “Latent dirichlet allocation,”J. Mach. Learn. Res., vol. 3, pp. 993–1022, 2003.
[5] Y. Boureau, F. Bach, Y. LeCun, and J. Ponce, “Learning mid-level fea-tures for recognition,” inProc. Int. Conf. Computer Vision and Pattern Recognition (CVPR), 2010.
[6] J. Boyd-Graber, J. Chang, S. Gerrish, C. Wang, and D. Blei, “Reading tea leaves: How humans interpret topic models,” Adv. Neural Inf. Process. Syst. (NIPS), vol. 31, 2009.
[7] J. Carletta, S. Ashby, S. Bourban, M. Flynn, M. Guillemot, T. Hain, J. Kadlec, V. Karaiskos, W. Kraaij, M. Kronenthal, G. Lathoud, M. Lin-coln, A. Lisowska, W. Post, D. Reidsma, and P. Wellner, “The AMI meeting corpus: A pre-announcement,”Lecture Notes in Computer Sci-ence, vol. 3869, pp. 28–28, 2006.
[8] A. Dielmann and S. Renals, “Automatic meeting segmentation using dynamic Bayesian networks,”IEEE Trans. Multimedia, vol. 9, no. 1, pp. 25–25, Jan. 2007.
[9] J. M. DiMicco, K. J. Hollenbach, and W. Bender, “Using visualiza-tions to review a group’s interaction dynamics,” inProc. Conf. Human Factors in Computing Systems, New York, 2006, pp. 706–711. [10] J. Dines, J. Vepa, and T. Hain, “The segmentation of multi-channel
meeting recordings for automatic speech recognition,” inProc. 9th Int. Conf. Spoken Language Processing, 2006.
[11] W. Dong, B. Lepri, A. Cappelletti, A. S. Pentland, F. Pianesi, and M. Zancanaro, “Using the influence model to recognize functional roles in meetings,” inProc. Int. Conf. Multimodal Interfaces (ICMI), Nagoya, Japan, 2007, pp. 271–278.
[12] W. Dong, A. Mani, A. Pentland, B. Lepri, and F. Pianesi, “Modeling group discussion dynamics,”IEEE Trans. Auton. Mental Develop., sub-mitted for publication.
[13] P. Dourish and V. Bellotti, “Awareness and coordination in shared workspaces,” inProc. 1992 ACM Conf. Computer-Supported Cooper-ative Work, Toronto, ON, Canada, 1992, pp. 114–114.
[14] N. P. Garg, S. Favre, H. Salamin, D. H. Tur, and A. Vinciarelli, “Role recognition for meeting participants: An approach based on lexical in-formation and social network analysis,” inProc. ACM Int. Conf. Mul-timedia, Vancouver, BC, Canada, 2008.
[15] D. Gatica-Perez, “Automatic nonverbal analysis of social interaction in small groups: A Review,”Image Vis. Comput.,Special Issue on Human Behavior, vol. 27, no. 12, pp. 1775–1787, Nov. 2009.
[16] D. Gatica-Perez, I. McCowan, D. Zhang, and S. Bengio, “Detecting group interest-level in meetings,” inProc. IEEE Int. Conf. Acoustics, Speech, and Signal Processing (ICASSP), 2005, vol. 1.
[17] T. L. Griffiths and M. Steyvers, “Finding scientific topics,”Proc. Nat. Acad. Sci., vol. 101, no. 1, pp. 5228–5228, 2004.
[18] J. A. Hall, E. J. Coats, and L. S. LeBeau, “Nonverbal behavior and the vertical dimension of social relations: A meta-analysis,”Psychol. Bull., vol. 131, pp. 898–924, 2005.
[19] R. R. Hassin, J. S. Uleman, and J. A. Bargh, The New Unconscious. New York: Oxford Univ. Press, 2005.
[20] G. Heinrich, Parameter Estimation for Text Analysis, 2005. [Online]. Available: http://www.arbylon.net/publications/text-est.pdf. [21] D. Jayagopi, S. Ba, J. M. Odobez, and D. Gatica-Perez, “Predicting two
facets of social verticality in meetings from five-minute time slices and nonverbal cues,” inProc. Int. Conf. Multimodal Interfaces (ICMI), New York, 2008, pp. 45–52.
[22] D. Jayagopi and D. Gatica-Perez, “Discovering group nonverbal con-versational patterns with topics,” inProc. Int. Conf. Multimodal Inter-faces (ICMI-MLMI), Boston, MA, Nov. 2009.
[23] D. Jayagopi, H. Hung, C. Yeo, and D. Gatica-Perez, “Modeling dom-inance in group conversations using nonverbal activity cues,”IEEE Trans. Audio, Speech, Lang. Process., vol. 17, no. 3, pp. 501–513, Mar. 2009.
[24] D. Jayagopi, B. Raducanu, and D. Gatica-Perez, “Characterizing con-versational group dynamics using nonverbal behaviour,” inProc. Int. Conf. Multimedia and Expo (ICME), New York, 2009.
[25] O. P. John and S. Srivastava, “The Big-Five trait taxonomy: History, measurement, and theoretical perspectives,” inHandbook of Person-ality: Theory and Research. New York: Guilford, 1999, vol. 2, pp. 102–135.
[26] T. Kim, A. Chang, L. Holland, and A. S. Pentland, “Meeting mediator: Enhancing group collaboration using sociometric feedback,” inProc. ACM 2008 Conf. Computer Supported Cooperative Work, New York, 2008, pp. 457–466.
[27] M. L. Knapp and J. A. Hall, Nonverbal Communication in Human In-teraction. New York: Holt, Rinehart and Winston, 1978.
[28] J. M. Levine and R. L. Moreland, “Progress in small group research,”
Annu. Rev. Psychol., vol. 41, no. 1, pp. 585–634, 1990.
[29] K. Lewin, R. Llippit, and R. K. White, “Patterns of aggressive behavior in experimentally created social climates,”J. Social Psychol., vol. 10, pp. 271–301, 1939.
[30] D. J. C. MacKay, Information Theory, Inference, and Learning Algo-rithms. Cambridge, U.K.: Cambridge Univ. Press, 2003.
[31] V. L. Manusov and M. L. Patterson, The SAGE Handbook of Nonverbal Communication. Newbury Park, CA: Sage, 2006.
[32] J. E. McGrath, Groups: Interaction and Performance. : , 1984. [33] D. McNeill, Language and Gesture. Cambridge, U.K.: Cambridge
Univ. Press, 2000.
[34] D. Moore, “The IDIAP smart meeting room,” inProc. IDIAP COM 02, vol. 7, no. 2002.
[35] K. Otsuka, H. Sawada, and J. Yamato, “Automatic inference of cross-modal nonverbal interactions in multiparty conversations: who responds to whom, when, and how? from gaze, head gestures, and utterances,” inProc. Int. Conf. Multimodal Interfaces (ICMI), Nagoya, Japan, 2007, pp. 255–262.
[36] K. Otsuka, J. Yamato, Y. Takemae, and H. Murase, “Quantifying inter-personal influence in face-to-face conversations based on visual atten-tion patterns,” inProc. CHI’06 Extended Abstracts on Human Factors in Computing Systems, 2006, pp. 1180–1180.
[37] A. S. Pentland, Honest Signals: How They Shape Our World. Cam-bridge, MA: The MIT Press, 2008.
[38] F. Pianesi, N. Mana, A. Cappelletti, B. Lepri, and M. Zancanaro, “Mul-timodal recognition of personality traits in social interactions,” inProc. Int. Conf. Multimodal Interfaces (ICMI), Chania, Greece, 2008, pp. 53–60.
[39] F. Pianesi, M. Zancanaro, E. Not, C. Leonardi, and V. Falcon, “Mul-timodal support to group dynamics,”Pers. Ubiq. Comput., vol. 12, no. 3, pp. 181–195, 2008.
[40] M. S. Poole, A. B. Hollingshead, J. E. McGrath, R. L. Moreland, and J. Rohrbaugh, “Interdisciplinary perspectives on small groups,”Small Group Res., vol. 35, no. 1, pp. 3–3, 2004.
[41] B. Raducanu, J. Vitria, and D. Gatica-Perez, “You are fired! nonverbal role analysis in competitive meetings,” inProc. IEEE Int. Conf. Acous-tics, Speech, and Signal Processing (ICASSP), 2009.
[42] M. Remland, Uses and Consequences of Nonverbal Communication in the Context of Organizational Life. Newbury Park, CA: Sage, 2006. [43] R. J. Rienks and D. Heylen, “Automatic dominance detection in meet-ings using easily detectable features,” inProc. Machine Learning and Multimodal Interaction (MLMI) Workshop, Edinburgh, U.K., 2005. [44] J. B. Rotter, Generalized Expectancies for Internal Versus External
Control of Reinforcement. Washington, DC: American Psychological Assoc,, 1966.
[45] D. Sanchez-Cortes, D. Jayagopi, and D. Gatica-Perez, “Predicting re-mote versus collocated group interactions using nonverbal cues,” in
Proc. Workshop Multimodal Sensor-Based Systems and Mobile Phones for Social Computing—Proc. Int. Conf. Multimodal Interfaces (ICMI-MLMI), Boston, MA, Nov. 2009.
[46] M. Steyvers and T. Griffiths, “Probabilistic topic models,” inLatent Semantic Analysis: A Road to Meaning, D. McNamara, S. Dennis, and W. Kintsch, Eds. Mahwah, NJ: Laurence Erlbaum, 2007, vol. 427. [47] J. Sturm, O. H. Herwijnen, A. Eyck, and J. Terken, “Influencing social
dynamics in meetings through a peripheral display,” inProc. 9th Int. Conf. Multimodal Interfaces, 2007, pp. 263–270.
[48] A. Vinciarelli, “Speakers role recognition in multiparty audio record-ings using social network analysis and duration distribution modeling,”
IEEE Trans. Multimedia, vol. 12, no. 6, pp. 1215–1226, Oct. 2007. [49] B. Wrede and E. Shriberg, “Spotting hot spots in meetings: Human
judgments and prosodic cues,” inProc. 8th Eur. Conf. Speech Commu-nication and Technology, 2003.
[50] D. Zhang, D. Gatica-Perez, S. Bengio, I. McCowan, and G. Lathoud, “Modeling individual and group actions in meetings with layered HMMs,”IEEE Trans. Multimedia, vol. 8, no. 3, pp. 509–520, Jun. 2006.
Dinesh Babu Jayagopireceived the B.Tech. degree in electronics from Madras Institute of Technology, Chennai, India, in 2001 and the M.Tech. degree in system science and signal processing from the In-dian Institute of Science, Bangalore, in 2003. He is currently pursuing the Ph.D. degree at Ecole Poly-technique Fédérale de Lausanne (EPFL), Lausanne, Switzerland.
Between 2003 and 2006, he worked as a Senior Re-search Engineer at Mercedes-Benz ReRe-search and De-velopment India. Since 2007, he has been a Research Assistant at Idiap Research Institute, Martigny, Switzerland. His research in-terests include human behavior analysis and modeling, machine learning, and signal processing.
Daniel Gatica-Perez(S’01–M’02) received the B.S. degree in electronic engineering from the University of Puebla, Puebla, Mexico, in 1993, the M.S. degree in electrical engineering from the National Univer-sity of Mexico, Mexico City, Mexico, in 1996, and the Ph.D. degree in electrical engineering from the University of Washington, Seattle, in 2001.
He is now a Senior Researcher with the Idiap Re-search Institute, Martigny, Switzerland, where he di-rects the Social Computing Group. His recent work has developed statistical methods to analyze small groups at work in multisensor spaces, populations using cell phones in urban environments, and online communities in social media. He has authored or coau-thored over 100 refereed papers in journals, books, and conferences in his re-search areas.
Dr. Gatica-Perez is an associate editor of the IEEE TRANSACTIONS ON
MULTIMEDIA. He currently serves as an associate editor ofImage and Vision Computing,Machine Vision and Applications, and theJournal of Ambient In-telligence and Smart Environments. He was the recipient of the Yang Research Award for his doctoral work.