Durham E-Theses
Modelling the Time Series Dynamics of Carbon
Emission Markets
SHI, YUKUN
How to cite:
SHI, YUKUN (2014) Modelling the Time Series Dynamics of Carbon Emission Markets , Durham theses, Durham University. Available at Durham E-Theses Online: http://etheses.dur.ac.uk/10563/
Use policy
The full-text may be used and/or reproduced, and given to third parties in any format or medium, without prior permission or charge, for personal research or study, educational, or not-for-prot purposes provided that:
• a full bibliographic reference is made to the original source • alinkis made to the metadata record in Durham E-Theses • the full-text is not changed in any way
The full-text must not be sold in any format or medium without the formal permission of the copyright holders. Please consult thefull Durham E-Theses policyfor further details.
Academic Support Oce, Durham University, University Oce, Old Elvet, Durham DH1 3HP e-mail: e-theses.admin@dur.ac.uk Tel: +44 0191 334 6107
Modelling the Time Series Dynamics of Carbon
Emission Markets
By
YUKUN SHI
A thesis submitted in partial fulfilment of the requirements for the degree
of Doctor of Philosophy in Finance
Durham University Business School
University of Durham
I
Abstract
Carbon emission markets, which are designed to reduce emissions of global greenhouse gases (GHGs), have experienced rapid ongoing development even during the recent recession and have attracted considerable attention from policy makers and investors. Therefore, it is important to understand the time series dynamics of carbon asset prices and the behaviour of trading activities in carbon emission markets. This thesis, using the second commitment period data of the European Union emission trading scheme (EU ETS), examines the underlying dynamics driving carbon emission markets, including the performance of state dependent hedge ratios, the impact of arbitrage opportunities on feedback trading activities, as well as the influence of carbon allowance submission deadlines on the relationship between carbon spot and futures markets.
The research models the relationship between carbon spot and futures markets by incorporating state dependent characteristics into the return and volatility processes, and finds that the class of regime switching hedging strategies, particularly the proposed new framework which combines regime switching behaviour and disequilibrium adjustment in the mean with state dependent dynamic volatility process, significantly outperform competing methods for all the measures considered, and for both in-sample and out-of-sample analysis. The results indicate that risk managers using Markov regime switching models to hedge the risk in carbon markets achieve greater variance reduction and better hedging performance. Secondly, this study extends Sentana and Wadhwani’s (1992) feedback trading model by allowing arbitrage opportunities to affect the demand of feedback traders in carbon markets. The results suggest that there is no evidence of feedback trading in the carbon market, where institutional investors dominate, although the effect persists in a few other energy markets.
II
This finding supports the view that institutional investors are not necessarily all feedback traders. Thirdly, when examining the influence of the carbon allowance submission deadline on the time series dynamics of carbon spot and futures markets, it is found that the equilibrium level, mean-reverting speed and no-arbitrage boundaries are affected by the submission deadline. However, the submission of allowances does not change the price discovery process of carbon emission markets, where this thesis finds that both the spot and futures markets Granger-cause each other. Furthermore, there is evidence that the volatility spillover process is different before and after the submission deadline, particularly from the spot market to the futures market. Therefore, in modelling the relationship between carbon spot and futures prices, the difference in the mean-reverting process of futures mispricing before and after the submission deadline should be accounted for. Overall, the thesis finds that the carbon emission markets yield different time series characteristics and trading behaviours from other financial markets. The findings of this thesis are of interest to risk managers, investors and arbitragers operating in the carbon emission market and could aid regulators in improving the mechanisms of the EU ETS in the next commitment period.
III
Table of Contents
Abstract ... I
Table of Contents ... III
List of Figures ... VI
List of Tables ... VII
Declaration ... IX
Statement of Copyright ... X
Acknowledgements ... XI
Chapter 1 Introduction ... 1
1.1. Focus of the thesis ... 1
1.2. Objectives of the thesis ... 3
1.3. Contributions of the thesis ... 7
Chapter 2 Overview of the Global Carbon Emissions Markets ... 11
2.1. Global warming and the Kyoto protocol ... 11
2.2. The EU ETS ... 13
2.3. The European carbon emission trading markets ... 16
2.4. Other emission trading markets... 19
Chapter 322 Hedging carbon emission allowances using Markov regime switching approaches ... 22
3.1. Introduction ... 23
3.2. Markov regime switching hedging strategies ... 28
3.2.1. Previous studies on regime switching hedging ... 28
3.2.2. The Markov regime switching model (MRS-LR-DCC) ... 30
3.3. Data and preliminary diagnostics ... 35
3.4. Estimation Results ... 37
IV
3.6. Additional analysis ... 49
3.7. Conclusion ... 53
Chapter 4 Arbitrage Opportunities and Feedback Trading: Evidence from Emissions and Energy Markets ... 68
4.1. Introduction ... 69
4.2. Related literature: Arbitrage opportunities and feedback trading ... 74
4.3. Feedback trading models ... 76
4.3.1. The SW feedback trading model ... 76
4.3.2. Feedback trading models with arbitrage opportunities ... 79
4.3.3. Conditional volatility specifications ... 82
4.4. Data and model selection ... 84
4.5. Empirical results... 86
4.5.1. Feedback trading evidence in emissions and energy markets ... 87
4.5.2. The effects of arbitrage opportunities on feedback trading ... 89
4.6. Robustness checks ... 92
4.6.1. Alternative measure of arbitrage opportunities ... 92
4.6.2. The effects of arbitrage opportunities on feedback trading across different market regimes ... 95
4.7. Conclusion ... 97
Appendix 4A: An overview of related literature on arbitrage opportunities and feedback trading ... 111
Appendix 4B: Summary of Key Results ... 120
Chapter 5 The impact of allowance submission in the European carbon emission markets ... 122
5.1. Introduction ... 124
5.2. The European Union emission trading scheme and the submission deadline ... 129
5.3. Related Literature ... 133
5.4. The Data ... 134
5.4.1. Constructing futures and spot price series ... 135
V
5.5. Impact of allowance submission ... 138
5.5.1. Impact of allowance submission on mispricing mean-reverting process ... 138
5.5.2. Impact of allowance submission on price discovery ... 148
5.5.3. Impact of allowance submission on volatility spillovers ... 150
5.6. Conclusion ... 154
Appendix 5A: Hochradl and Rammerstorfer’s (2012) Methodology ... 168
Appendix 5B: Robustness checks using different time frequencies ... 171
Appendix 5C: Estimation results of the TAR model using moving average thresholds .... 184
Chapter 6 Conclusion ... 188
6.1. Summary of the findings and the implications ... 188
6.2. Limitations and further research ... 192
VI
List of Figures
Chapter Two
Figure 2.1: Time series of the EUA prices (€ per CO2 ton, continuous futures contracts) 21
Figure 2.2: Market value of European carbon emission market ($ billion) 21
Chapter Three Figure 3.1: Spot-futures basis for carbon emission allowances 56
Figure 3.2: Smooth regime probabilities of MRS model for carbon emissions 57
Figure 3.3: Smooth regime probabilities of MRS-LR model for carbon emissions 58
Figure 3.4: Smooth regime probabilities of MRS-LR-DCC models for carbon emissions 59
Figure 3.5: Constant OLS, DCC-GARCH and MRS-LR-DCC hedge ratios for carbon emissions 60
Figure 3.6: MRS, MRS-LR and MRS-LR-DCC hedge ratios for carbon emissions 60
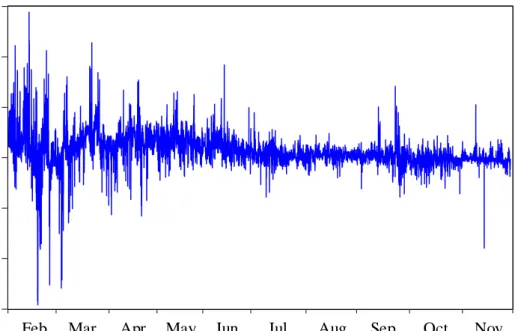
Chapter Five Figure 5.1: Time series of carbon futures mispricing using 15 min data 157
VII
List of Tables
Chapter Three
Table 3.1: Summary statistics, unit root and cointegration tests for spot and futures prices of carbon
emissions 61
Table 3.2: Estimation results of Markov regime switching model and Markov regime switching model with long run relationship for carbon emissions 62
Table 3.3: Estimation results of DCC-GARCH and Markov regime switching DCC model with long run relationship for carbon emissions 63
Table 3.4: Effectiveness of Markov regime switching hedge ratios against alternative hedge ratios in carbon emission markets 65
Table 3.5: Effectiveness long/short hedging positions of Markov regime switching hedge ratios against alternative hedge ratios in carbon emission markets 66
Chapter Four Table 4.1: Descriptive statistics of emission and energy futures returns 99
Table 4.2: Descriptive statistics of emission and energy basis and convenience yield 100
Table 4.3: Results of specification tests for various GARCH models 101
Table 4.4: Maximum likelihood estimates of the SW feedback trading model I 102
Table 4.5: Maximum likelihood estimates of feedback trading model II with basis 103
Table 4.6: Maximum likelihood estimates of feedback trading model III with basis 104
Table 4.7: Maximum likelihood estimates of feedback trading model II with convenience yield 105
Table 4.8: Maximum likelihood estimates of feedback trading model III with convenience yield 106
Table 4.9: Robustness checks results of model III with basis 107
Table 4.10: Robustness checks results model III with convenience yield 109
Table 4A.1: Summary of literature on arbitrage opportunities and feedback trading 112
Table 4B.1: Summary of feedback trading coefficients estimates in Table 4.4 to Table 4.10 121
Chapter Five Table 5.1: Summary statistics of carbon futures mispricing using 15 min data 161
VIII
Table 5.3: Estimation results of TAR model with dummies using 15 min data (Chan’s (1993)
procedure) 163
Table 5.4: Estimation results of QLSTR model with dummy variables using 15 min data 164
Table 5.5: Estimation results of Granger causality tests using 15 min data 166
Table 5.6: Estimation results of HAR model for volatility spillovers using 15 min data 167
Table 5B.1: Estimation results of ADF tests with dummy variables (alternative frequencies) 173
Table 5B.2: Estimation results of TAR model with dummies (Chan’s (1993) procedure, alternative frequencies) 175
Table 5B.3: Estimation results of QLSTR model with dummy variables (alternative frequencies) 177 Table 5B.4: Estimation results of Granger causality tests (alternative frequencies) 180
Table 5B.5: Estimation results of HAR model for volatility spillovers (alternative frequencies) 182
Table 5C.1: Estimation results of TAR model with dummies using 10 min data (moving average thresholds) 185
Table 5C.2: Estimation results of TAR model with dummies using 15 min data (moving average thresholds) 186
Table 5C.3: Estimation results of TAR model with dummies using 30 min data (moving average thresholds) 187
IX
Declaration
The material contained in the thesis has not previously been submitted, either in whole or in part, for a degree in this or any other institution.
X
Statement of Copyright
The copyright of this thesis rests with the author. No quotation from it should be published without the author's prior written consent and information derived from it should be acknowledged.
XI
Acknowledgements
It has been a long and frustrating undertaking for me to complete this thesis. I have encountered a number of difficulties in the four-year journey. I have dreamed so many times that I can draw a line under it, however endless it seemed. Finally, I am now about to submit the thesis, although I think it is still far from perfect. Firstly, I have to say, without the help, guidance, support and encouragement of my primary supervisor, Dr. Dennis Philip, it would have been impossible for me to fulfil this task. I would like to express my heartfelt thanks to him, who guides me in the academic world. We always have long meetings which inspire me with new research ideas. In addition, I am grateful to Professor Alessandra Guariglia, Dr. Frankie Chau, Dr. Jing-Ming Kuo and Dr. Wenxuan Hou for discussing research ideas and providing comments on my chapters, and for the help and guidance during my time as a PhD student.
Doing a PhD is a lengthy and lonely journey. I would like to thank all my friends at Durham, who have accompanied and supported me during the past four years. My life would be significantly different without the following professors, colleagues and friends I have met in the UK (in an arbitrary order): Dr. Jin Suk Park, Dr. Zhiyun Li, Dr. Guangxiang Li, Dr. Rataporn Deesomsak, Dr. Binghan Zheng, Dr. Qi Fang, Dr. Yongjie Xie, Dr. Zhimin Xiao, Dr. Boya Wang, Dr. Yang Fan, Dr. Xiong Wei, Dr. EY Oh, Ying Chen, Miao Han, Junhong Yang, Jia Luo, Zhenlong Li, Pei Liu, Jiayuan Xin, Nan Hu, Ziwei Zheng, Zhuang Zhang, Qingjing Zhang, Xiehua Ji, Yang Zhao, Yujie Hu, Yunhan Hu, Xuying Du, Yingying Huang, Jiankang Shi, Sheng Yang, and many significant others. In addition, I would like to thank all the staff of the Durham University Business School for their help and support.
XII
Last but not least, I owe my deepest gratitude to my beloved parents, Baohong Shi and Shexiang Wang. Their love and encouragement have provided the strong support that has enabled me to finish this thesis.
1
Chapter 1
Introduction
1.1.
Focus of the thesis
The international community has now reached a consensus that our world is experiencing
serious environmental problems caused by the emission of carbon dioxide (CO2) and other
greenhouse gases (GHGs). The level of greenhouse gases is expected to reach twice the level of pre-industrial times between 2030 and 2060 (Stern, 2007). This will increase the world average temperature by 2°C to 5°C by the end of the twenty-first century. Ice in Greenland and the Antarctic will melt dramatically, raising sea levels and disturbing the distribution of world ocean currents. More droughts and floods are likely, and more land will be under the threat of desertification, all of which will lead to significant detrimental economic and social consequences for humanity.
In addressing these international environmental issues, the United Nations (UN) instigated the Kyoto Protocol in 1997, which aims to reduce GHG emissions through international cooperation. Under this treaty, the Kyoto Protocol requires industrialised countries and countries in transition to reduce their collective greenhouse gas emissions by 5.2% of the level reached in 1990 before 2012 (UNFCCC, 1997). In order to improve the efficiency and reduce the costs of emissions abatement, the global GHG emission trading
2
markets, or the carbon emission markets, were launched under the framework of the Kyoto Protocol.
Global carbon emission markets have experienced rapid ongoing development and have attracted increasing investment since their inception. The total value of the markets stood at more than $175 billion in 2011, which is over 20 times higher than in 2005 (World Bank, 2012), and business activities in all sectors of the economy are influenced by carbon emission trading (Calel, 2013). Given the novel features and increasing importance of the carbon emission markets, there has been a growing body of literature studying the characteristics of
carbon emission allowance prices and the financial markets for carbon assets.1 The most
important carbon emission market is the European Union emission trading scheme (EU ETS), which is a “cap-and-trade” system requiring firms to surrender a certain amount of tradable permits corresponding to the firms’ GHG emissions by a specific deadline, otherwise they will incur a penalty. The EU ETS has three commitment periods (Phase I: 2005-2007; Phase II: 2008-2012; Phase III: 2012-2020), each with different characteristics. This thesis will focus on the issues associated with the second phase of the EU ETS.
It has been shown that carbon allowance prices experience price jumps, spikes and high volatility, and are very sensitive to government policies (e.g. Daskalakis, Psychoyios and Markellos, 2009; Benz and Trück, 2009). These irregularities demonstrate the importance of understanding the time series properties of carbon allowance prices. In addition, the unique regulatory framework of carbon emission markets may lead to different behaviours within trading activities in carbon emission markets. Therefore, the focus of this thesis is to
1 For example the determinants of carbon allowance prices (e.g. Alberola, Chevallier, and Chèze 2008; Creti, Jouvet and Mignon, 2012); the efficiency of carbon emission markets (e.g. Daskalakis and Markellos, 2008; Joyeux and Milunovich, 2010; Charles, Darné and Fouilloux, 2011); the comovement of carbon allowance prices and the prices of other financial assets (e.g. Chevallier, 2011a, b; Koch, 2011), etc.
3
investigate the time series dynamics of carbon allowance prices and trading behaviour in the carbon emission markets.
1.2.
Objectives of the thesis
As it is important to understand the underlying dynamics driving the carbon emission markets, attention has been increasingly drawn to the econometric analysis of carbon allowance prices. For example, Paolella and Taschini (2008) analyse the time series properties of carbon allowance prices and examine the fitness of a series of GARCH models.
It has been found that the GARCH model with generalised asymmetric t distribution
performs best in the in-sample fitness; however, none of the models considered can provide
accurate value of risk (VaR) forecasting. Other studies of time series analysis in carbon
emission markets mainly focus on modelling the relationship between carbon spot and futures
prices (e.g. Uhrig-Homburg and Wagner, 2009; Joyeux and Milunovich, 2010; Chevallier,
2010; Rittler, 2012, among others). Apart from these studies, a very important issue is the
impact of the regulations governing carbon emission markets on the time series characteristics of carbon allowance prices and the implications of these special properties for hedging, arbitrage and other trading activities in carbon emission markets. Therefore, it is useful to model the time series dynamics of carbon spot and futures markets by considering the special characteristics of carbon emission markets, and analyse how these models can be applied to trading activities.
Previous research has shown that carbon allowance prices experience frequent jumps and spikes and that the volatility of carbon emission markets is high compared to other financial markets (Daskalakis, et al., 2009; Benz and Trück, 2009). Thus, managing the financial risk in carbon emission markets is important for market participants. However, few studies have
4
been conducted to estimate the hedge ratios and to evaluate the hedging performance in carbon emission markets. Only Pinho and Madaleno (2010) and Fan, Roca and Akimov (2013) examine the effectiveness of conventional hedging strategies in European carbon emission markets, including the naive hedge, constant OLS, VECM and GARCH approaches. These hedging strategies fail to consider the special characteristics of carbon emission markets and therefore cannot achieve a significant improvement on the simple naive hedge approach.
Benz and Trück (2009) compare the usefulness of GARCH and regime switching approaches in modelling the dynamics of carbon allowance prices. The results show that the Markov regime switching model outperforms the GARCH model in both in-sample fit and out-of-sample forecasting. This is because the regime switching model can capture the economic and econometric characteristics of carbon allowance prices. From an economic perspective, the regime switching model can reflect the fluctuations in the demand and supply of carbon allowances based on different regulatory frameworks, production levels and weather conditions, by allowing a systematic switching between high variance (unstable) state and low variance (stable) state. In addition, the Markov regime switching models, in which the regimes are determined by an unobservable state variable, are more appropriate for carbon emission markets as several determinants of carbon allowance prices (e.g. the regulatory and sociological variables) are unquantifiable and unobservable. From an econometric perspective, the regime switching models which allow consecutive jumps and extreme values in asset prices can better capture the statistical characteristics of carbon allowance prices.
The findings above imply that the regime switching models may produce better hedging performance than the GARCH approaches as they can capture the dynamics of carbon
5
emission markets more effectively. Therefore, in Chapter 3, this thesis models the relationship between carbon spot and futures markets by considering state dependent properties in the return and volatility processes, and evaluates the performance of Markov regime switching and alternative hedging strategies. In particular, this chapter introduces a new framework with which to model the carbon spot and futures relationship, which incorporates regime switching behaviour and the long run disequilibrium adjustment in the mean with the state dependent dynamic volatility process. In assessing the effectiveness of competing approaches, this chapter uses a variety of hedging performance measures, including the variance of hedged portfolio, hedger’s utility and value at risk exposure. In addition, this chapter also considers the downside risk measures, different hedging positions and tests the statistical significance of improvements by using state dependent hedge ratios.
After evaluating the hedging performance of Markov regime switching models, the thesis turns its attention to attempting to understand the trading behaviour of investors in carbon emission markets, as they are governed by a different regulatory framework than other financial markets. The design and mechanisms of the EU ETS mean that the vast majority of investors in European carbon emission markets are institutional investors, which provides us with a unique and natural opportunity to investigate the institutional investors’ trading behaviour. In particular, feedback trading is an important trend chasing strategy which has attracted an increasing amount of attention in recent studies (e.g. Sentana and Wadhwani, 1992; Antoniou, Koutmos and Pericli, 2005; Laopodis, 2005; Salm and Schuppli, 2010; Chau, Deesomsak and Lau, 2011, among others). However, no previous study has examined feedback trading in carbon emission markets, where institutional investors dominate. This provides a motivation for examining whether there is significant feedback trading in carbon emission markets, and comparing the results with other energy markets, which is the second aim of the thesis.
6
Conventional feedback trading models assume that the feedback traders’ demand for shares is only determined by the return in the last period. However, it has been argued that arbitrage opportunities can also affect the trading behaviour of feedback traders. Arbitrage, which is a form of rational speculation, is among the most important factors contributing to feedback trading (De Long, Shleifer, Summers and Waldmann, 1990). In addition, it has been shown that arbitrage opportunities contain some predictive value for future price movements (e.g. Khoury and Yourougou, 1991; Knetsch, 2007; Gorton, Hayashi and Rouwenhorst, 2013). For the reasons outlined above, the thesis argues that, in addition to the last period’s return, potential arbitrage opportunities can also determine the demand function of feedback traders. Therefore, Chapter 4 extends Sentana and Wadhwani’s (1992) feedback trading model by allowing arbitrage opportunities to affect the feedback traders’ demand function, and examines whether there is significant feedback trading in carbon emission and energy markets. In the augmented feedback trading model, the demand from feedback traders is influenced by arbitrage opportunities, which is measured by using the spot-futures basis and the convenience yield, in both an additive and a multiplicative way. The chapter also tests whether the effects of arbitrage opportunities on feedback trading are different across bull and bear market conditions.
Beside the fact that carbon emission markets are dominated by institutional investors, there is another important characteristic of European carbon emission markets that needs to be addressed. Firms are required to submit a certain amount of their carbon allowances to the EU by a fixed deadline each year to comply with the EU ETS regulations; otherwise they will incur a heavy penalty. In order to avoid the fine, firms with insufficient carbon allowances need to purchase the rest of their allowances in the markets before the submission deadline. This causes trading to be more active before the submission deadline than after. After the submission, the total amount of carbon allowances in the markets is significantly lower than
7
before the submission deadline, which also means that investors’ trading activities differ before and after the submission deadline. Therefore, the time series dynamics driven by trading activities should have changed after the submission deadline. In order to observe the change intuitively, the author plots the time series of the difference between observed futures prices and theoretical futures prices derived from the cost of carry model. Persistent mispricing of carbon futures is observed before the submission deadline, which supports the previous argument. The reasons outlined above provide a strong motivation to examine the impact of the allowance submission deadline on the time series dynamics of carbon emission markets, which is the last objective of this thesis. In particular, in Chapter 5, this thesis examines the impact of the allowance submission deadline (30 April each year), set by the European Union emission trading scheme (EU ETS), on the relationship between carbon spot and futures markets. In particular, this chapter studies whether there is a shift in the mean-reverting process of the carbon spot and futures relationship, the price discovery process and volatility spillovers of carbon spot and futures markets before and after the submission deadline. The effects described above are examined by using intraday data with different time frequencies.
1.3.
Contributions of the thesis
By investigating the research objectives outlined above, the thesis makes unique contributions to the existing literature in the following respects.
Firstly, in order to model the joint distribution of carbon spot and futures prices, this thesis formulates a new framework in Chapter 3 which incorporates the concepts of regime switching, disequilibrium adjustment and volatility clustering. In particular, this approach
8
allows Markov regime switching (MRS) behaviour and adjustment to the long run equilibrium (LR) in modelling the relationship between spot and futures returns, and state dependent characteristics in the dynamics volatility process, which is modelled by Engle’s (2002) dynamic conditional correlation (DCC) GARCH (referred as MRS-LR-DCC). This is important because, if there is a long run relationship between spot and futures prices, overlooking the cointegration relationship will cause misspecification of the models and consequently the performance of the hedging strategy could be unsatisfactory (e.g. Kroner and Sultan, 1993; Lien, 1996). In addition, by allowing the conditional variance parameters to be state dependent, this thesis is the first to introduce the regime switching dynamic volatility process into the carbon emission markets. Previous studies only consider the state dependent characteristics in the return process of carbon allowances (e.g. Benz and Trück, 2009; Chevellier, 2011a, b). However, Chevellier (2011c) shows that the conditional variances of carbon asset returns exhibit strong shifts and instability. Therefore, it is important to allow regime switching in carbon asset volatilities.
The second contribution of the thesis is to demonstrate that the class of Markov regime switching approaches perform the best in hedging the financial risk in carbon emission markets. As Markov regime switching models can capture the economic and econometric properties of carbon allowance prices, the state dependent hedging strategies are expected to produce a superior performance. The class of Markov regime switching approaches outperform OLS and GARCH strategies in all the hedging performance measures considered, including variance reduction, hedgers’ utility and value at risk. White’s (2000) reality check is used to test the statistical significance of the improvement offered by the MRS-LR-DCC model over other approaches. The results show that the MRS-LR-DCC model significantly outstrips all the other strategies at conventional levels. Furthermore, the findings above are
9
still significant after considering the downside risk measures and the difference in long and short hedging positions.
Thirdly, this thesis finds that there is no significant feedback trading in carbon emission markets. This is important because most of the investors in carbon markets are institutional investors. The unique features of carbon emission markets make the results obtained in this thesis significant in understanding the trading behaviour of institutional investors.
Also, by examining the impact of arbitrage opportunities on feedback trading, this thesis contributes to a rising number of studies investigating how arbitrage opportunities affect investors’ trading behaviour. Arbitrage, which is regarded as a type of rational speculation, is suggested as one of the causes of feedback trading (De Long et al., 1990). In addition, arbitrage opportunities can be used to predict future price movements (e.g. Khoury and Martel, 1989; Khoury and Yourougou, 1991). Therefore, it is possible that feedback traders also consider the positional arbitrage opportunities as an indicator to trade. For this reason, this thesis extends Sentana and Wadhwani’s (1992) feedback trading model by allowing arbitrage opportunities to affect feedback traders’ demand for shares, in both an additive and a multiplicative way. The results show that the impact of arbitrage opportunities on feedback trading is significant in some energy markets. Furthermore, this thesis shows that the impact of arbitrage opportunities on the level of feedback trading is different across bull and bear market regimes. Finally, this thesis also differs from previous studies which only assume a particular specification of the conditional variance process, by conducting a comprehensive examination of specifications in order to select the most appropriate volatility model for each market.
Last but not least, by examining the impact of the allowance submission deadline on the European carbon emission markets, this thesis finds in Chapter 5 that the time series
10
dynamics of the carbon emission markets change after the submission deadline. Due to the EU ETS regulations, investors’ trading activities in carbon emission markets may be different before and after the submission deadline, which can induce a change in the time series characteristics of carbon allowance prices. Therefore, the results obtained are significant in understanding the trading activities, especially arbitrage activities, in carbon emission markets. In particular, this thesis finds that the equilibrium level, mean-reverting speed and no-arbitrage boundaries of the carbon futures mispricing are affected by the submission deadline. However, the cointegration relationship between spot and futures prices is not affected. As previous studies show mixed results for the cost-of-carry relationship between carbon spot and futures prices, the results obtained show that submission of allowances is not the underlying reason for the mixed results. In addition, this study incorporates the impact of allowance submission into the examination of the causal relationship between spot and futures returns in the carbon emission markets. These results show that the price discovery process does not change after the allowance submission deadline. Furthermore, by using realised measures, this thesis finds that the submission of allowances has a significant impact on the volatility spillovers between carbon spot and futures markets, particularly from the spot market to the futures market.
Overall, this thesis proposes a time series model (MRS-LR-DCC) for carbon emission markets that can explain the data generation process (DGP) accurately and also provide a superior hedging performance. Moreover, this thesis introduces a new feedback trading model in which arbitrage opportunities affect the demand from feedback traders. Finally, the thesis finds that carbon emission markets yield different time series characteristics from other financial markets, which is dependent on the submission deadline.
11
Chapter 2
Overview of the Global Carbon Emissions Markets
2.1.
Global warming and the Kyoto protocol
The observed average temperature of the Earth’s surface has shown a tendency to increase since the start of the twentieth century. The average surface temperature of the Earth rose by around 0.8°C over the past century, and about 0.6°C of this increase has occurred since 1980 (National Research Council, 2011). In addition, the projected world average temperature will increase by 2°C to 5°C by the end of the twenty-first century (Stern, 2007). Continuous global warming will have significant adverse economic and social consequences, such as more droughts, floods, and severe weather conditions, desertification of land and reductions in agricultural production.
It has been shown that global warming is strongly associated with the emission of greenhouse gases (GHGs), and there is an increasing awareness that it is important to reduce GHG emissions. In order to address the climate change issue, the United Nations launched the United Nations Framework Convention on Climate Change (UNFCCC) in 1992 to reduce the worldwide emission of GHGs. 194 countries have acknowledged that the international community needs to control the accumulation of GHGs in the atmosphere, by keeping them under a certain level in order to avoid the hazardous impact of global warming on the climatic system (Newell, Pizer and Raimi, 2012).
12
The UNFCCC further proposed an agreement on how to achieve global emission reduction, known as the Kyoto Protocol, which was initially adopted in December 1997 in Kyoto, Japan. The treaty requires 37 industrialised countries or countries in transition (known as Annex I countries of the Kyoto Protocol) to reduce their collective GHG emissions by 5.2% of the level reached in 1990 before 2012 (UNFCCC, 1997). The Kyoto Protocol also designed a “cap-and-trade” system to reduce the emissions more efficiently and economically. Under this system, central authorities set up a standard or “cap” on the total amount of greenhouse gases that each country or region can emit within a year or other fixed period. The authorities then allocate the allowance of emission units, which is the right to emit a certain amount of GHGs. Firms’ emissions should not exceed the allocated allowance represented by their in-hand credits; otherwise they must deliver the missing carbon credits in the next year and will also incur a heavy penalty. For example, the penalty in the EU is €40
per ton of CO2 equivalent before 2008 and €100 per ton after 2008. The total amount of
credits should not exceed the cap. As a consequence, the total amount of emissions can be controlled and kept under a target level. If a company needs to emit more than its allocated allowance, it can buy the carbon credits from another company with a remaining emission allowance. This is how the “cap-and-trade” system works. According to the Coase theorem (Coase, 1937, 1960), under the assumption of no transaction costs, and if the authorities allocate the credits and protect the rights of credit holders very effectively, the “cap-and-trade” system can completely solve the externality problem of market failure. By adopting the “cap-and-trade” mechanism, many countries and regions implemented emission reduction programmes, and gradually created the global GHG emission markets, which are also known
as the carbon emission markets as CO2 is the predominant gas in GHGs. The global carbon
emission markets had reached a market value of $144 billion by the end of 2009, and had an annual growth rate of 6% even at the height of the economic recession (World Bank, 2010).
13
The value further increased to more than $175 billion in 2011, which is over 20 times higher than in 2005 (World Bank, 2012), while business activities in all sectors of the economy are
influenced by carbon emission trading (Calel, 2013).2
The Kyoto Protocol designed three “flexibility mechanisms” to be used by Annex I countries in order to meet their emission reduction obligations, which are: the International Emissions Trading (IET); the Clean Development Mechanism (CDM); and Joint Implementation (JI). The IET allows participating countries to trade their emission rights assigned by the UN, which are known as Assigned Amount Units (AAUs, or carbon emission allowances). The most important emission trading programme in the world is the European Union Emission trading scheme (EU ETS) organised by the European Union Commission. The CDM is designed to promote international environmental cooperation between industrialised counties and developing countries, by allowing Annex I parties to develop emission reduction projects in developing countries and generate Certified Emission Reduction units (CERs), which can be used to fulfil the emission reduction requirements or traded in the global carbon emission markets. Similarly, the JI is a mechanism which allows an Annex I country to invest in emission reduction projects in another Annex I country, in exchange for Emission Reduction Units (ERUs), which are also a form of carbon credits accepted by the UN. These flexibility mechanisms reduce the overall costs of emission reductions and boost the spillovers of clean energy technologies.
2.2.
The EU ETS
2 The financial instruments traded in the carbon emission markets are called carbon credits. Because the carbon emission market is a futures-dominated market and always a sub-market of energy exchanges, carbon credits are commonly viewed as a special type of commodities (Button, 2008). Hence, some research methods intensively employed in commodity markets are adopted in this thesis.
14
The European Union Emission Trading Scheme (EU ETS) is a “cap-and-trade” system, operating under the Kyoto Protocol. Launched in 2005, the total value of European Union
Allowance (EUA)3 transactions is 118.5 billion US dollars with an 18% growth rate, which is
considerably faster than the growth of the global carbon emission market (World Bank, 2010). Accounting for 83% of the market value of global carbon emission markets, the EU ETS is the most influential and successful emission trading programme in the world. The firms covered by the EU ETS comprise approximately 12,000 installations which have a net generating capacity of more than 20 megawatts (MW), located in 28 countries in the EU and 3 European countries outside of the EU (Iceland, Liechtenstein and Norway). The sections included are: power stations; mineral or oil refineries; ferrous metal; glass production; coke ovens; ceramic production; cement manufacture; and finally the aviation industry which joined in 2012 (Ibikunle, 2012).
After the “cap” or total amount of GHG emissions was decided, the EUAs were distributed to the participating nations and then the installations within them through National Allocation Plans (NAPs). The distribution approaches include free allocation, which is based on historic patterns of emissions in a specific sector (also known as grandfathering), auctioning, or a combination of both methods. As firms may receive windfall profits through free allocation, the EU gradually increases the proportion of auctioning in the EUA allocations. In any year, the government authorities have to issue the auctioned or freely allocated carbon emission allowances to the participating firms by 28 February. On 30 April of the following year, all firms covered by the EU ETS are required to surrender the specified quantity of EUAs or other accepted carbon financial instruments (including CERs and ERUs under some conditions) corresponding to the GHG emissions in the previous year. Those GHG emissions not covered by the surrendered carbon allowances are penalised at €40 per
15
ton of CO2 before 2008 and €100 per ton of CO2 after 2008. In addition, the uncovered
carbon allowance should also be surrendered in the next compliance year. Therefore, in order to avoid the penalty, firms that do not have sufficient carbon allowances to surrender have to purchase the uncovered allowances in the spot market before the submission deadline, boosting trading activities in carbon emission allowances before 30 April each year. All the operators’ allowance holdings and carbon allowance trading are registered in the EU ETS Transaction Log. The data show that less than 6% of the total accounts are personal holding accounts (2,050 out of a total of 34,492 accounts) in November 2012, indicating that the vast majority of the participants in the European carbon emission markets are institutional investors. This is because individuals cannot claim carbon allowance from their personal emissions reduction, resulting in individuals being disadvantaged in terms of carbon emission trading compared to participating firms. The participants in the EU ETS include the 12,000 installations covered by the scheme, firms investing in the CDM and JI projects, government carbon funds, international organisations, arbitragers, speculators and other environmental investors.
The EU ETS has three commitment periods, each with different mechanisms. Phase I spans the period from January 2005 to the end of 2007, which is the trial period. All the carbon emission allowances were freely allocated through grandfathering. In addition, it did not permit banking and borrowing of carbon allowances between different phases. The
penalty in this commitment period was €40 per CO2 ton not surrendered plus the submission
of uncovered carbon allowances in the next year. The period from January 2008 to December 2012 constitutes the second phase of the EU ETS; interphase banking restrictions were relaxed to some extent and more countries such as Norway, Iceland, and Liechtenstein joined the scheme. The aviation industry has also been included in the scheme since 2012. The
16
fraction of carbon emission allowances (less than 10%) was distributed through auctioning. In the third commitment period of the EU ETS (2013–2020), a series of changes will be made by the European Union. For example, the proportion of carbon emission allowances allocated through auctioning will gradually increase from 20% in 2013 to 70% in 2020, and this allocation will not be done through NAPs but through EU-wide distributions. Interphase banking restrictions will be completely abolished. In addition, the European commission will restrict the use of carbon offsets outside of the EU as a substitute for the EUA. This makes the characteristics of carbon emission trading in EU ETS Phase III different from the first two commitment periods. Therefore, with increasing data availability, it will be of interest to investigate the new features of carbon emission markets in EU ETS Phase III.
2.3.
The European carbon emission trading markets
The previous section has described the mechanisms and the primary markets (auction or free allocation) of the EU ETS. In this section, the thesis will focus on the secondary markets of the EU ETS, i.e. European carbon emission trading markets, which are the markets used for the empirical investigation carried out in this thesis.
Spot and derivative carbon allowances are traded in a number of exchanges, including the European Climate Exchange (ECX) under the Intercontinental Exchange (ICE), BlueNext
exchange,4 European Energy Exchange (EEX), Nordpool Exchange, Green Exchange, and
the Climex. Futures contracts for the EUAs are the dominant financial instrument in European carbon emission markets (World Bank, 2008). More than 90% of carbon futures contracts are traded on the ICE ECX. The ICE ECX futures market opens from 07:00 to
4 The BlueNext exchange was shut down in December 2012 as it failed to win a bid to run the EUA auctions from the start of the third commitment period of the EU ETS (2013-2020). European Energy Exchange won the bid so that will now be the leading spot market for the carbon allowances.
17
17:00 GMT Monday to Friday, and the futures contracts are listed on a quarterly expiry cycle, i.e. contracts expire in March, June, September and December each year. The expiry date is the last Monday of the contract month. The most liquid futures contract is the one which expires in December each year. The leading spot market for the EUA is the Bluenext exchange for the first and second commitment periods, and it will be the EEX for EU ETS Phase III. Trading on the BlueNext spot market occurs from 08:00 to 17:30 UTC+1, Monday to Friday. Therefore, this thesis uses the EUAs futures contracts data from the ICE ECX and spot contracts data from the BlueNext.
[Insert Figure 2.1 here]
The time series of the EUA futures prices in EU ETS Phase I and Phase II are presented in Figure 2.1. It can be observed that the carbon allowance prices are volatile and are characterised by frequent jumps and spikes, especially in the first commitment period of the EU ETS (2005-2007). The significant drop in the EUA prices during the last week of April 2006 is because the installations’ emission data was disclosed and market participants realised that the EUAs were oversupplied. The over-allocation of the EUAs and windfall profits from the free allocation made the EUAs worthless and they gradually declined to zero (or almost zero) during the second half of 2007. Alberola et al. (2008) show that, in Phase I of the EU ETS, there are two structural changes in the carbon allowance prices and the price drivers are energy prices, weather conditions and unexpected policies. Given the high volatility of carbon allowance prices, there is a consensus that the European carbon emission markets are not efficient during EU ETS Phase I (e.g. Daskalakis and Markellos, 2008; Miclaus, Dumitrescu and Bobirca, 2008; Frunza and Guegan, 2009; Montagnoli and De Vries, 2010; Joyeux and Milunovich, 2010; Charles, et al., 2011).
18
During Phase II of the EU ETS, the European Commission revised the National Allocation Plans (NAPs) to stabilise the carbon allowance prices. The significant decline in prices from August 2008 to April 2009 was because of the global financial crisis. After that, the carbon allowance prices became less volatile. During this commitment period, the interaction between carbon allowance prices and macroeconomic variables becomes stronger (e.g. Chevallier, 2011a, b), while the efficiency of the market has also been improved (e.g.
Charles, et al., 2011; Charles,Darné, and Fouilloux, 2013).
[Insert Figure 2.2 here]
Figure 2.2 presents the annual market value of the European carbon emission market. Charles, et al. (2011) identify that the European carbon emission market was a thin trading market during EU ETS Phase I, although it is growing rapidly. It can be observed from the figure that the market value stood at only around $50 billion by the end of 2007 but jumped to $100 billion in 2008. The European carbon emission market was worth approximately $150 billion by 2011, which is 20 times higher than in 2005. It is now a sizable market and consequently is attracting an increasing amount of investment.
Finally, it can be inferred from the design and regulations of the EU ETS, and the price-volume analysis above, that the characteristics of European carbon markets have phase-dependent issues. This thesis only considers the data in the second commitment period of the EU ETS, for the following reasons. Firstly, the second phase of the EU ETS is the most recent commitment period and has not been fully investigated. Secondly, the mechanisms of EU ETS Phase I and Phase II had been significantly changed; therefore, it would not be viable to examine the Phase I and Phase II data together. Thirdly, due to inter-phase banking restrictions, the spot prices were close to zero at the end of Phase I, i.e. the second half of
19
2007 (Chevellier, 2011a). Therefore, it is not appropriate to use the spot prices at that stage to study the time series dynamics of carbon emission markets.
From Figure 2.1 and Figure 2.2 it can be observed that the European carbon market becomes less volatile and more liquid, although it is open to some criticisms, for example over-allocated allowances, the VAT fraud and the low prices at the end of the first phase. The European commission has made many changes in the mechanisms of Phase III designed to resolve these issues. The most important ones include auctioning the carbon allowances and reforming the National Allocation Plans (NAP). These actions will strongly support carbon prices and help the market to become mature.
2.4.
Other emission trading markets
Prior to the EU ETS, the US SO2 market, which is also a “cap-and-trade” system, was
created in 1995. Similar to the EU ETS, it consists of two phases with different targets. The
price for SO2 was high in the first phase, and subsequently dropped to a very low level
because technological advances reduced the cost of SO2 emission reduction. The market has
been very successful as the SO2 emissions and acid rain levels dropped significantly after the
programme was introduced. We can therefore expect the EU ETS, which has similar
mechanisms to the US SO2 market, to be very successful in the future.
Among the world’s carbon markets, the US voluntary carbon market is one of the most important. Currently there are no federal carbon regulations but only regional initiatives for carbon emission reductions in the United States, for example the Regional Greenhouse Gas Initiative (RGGI) for the north-eastern states and emission trading in California. The US carbon emission market is a voluntary and pre-compliance carbon offset market, which can
20
be viewed as an experimental market for mandatory greenhouse gas “cap-and-trade” at
federal level. The House of Representatives passed the Waxman-Markey Bill5 in June 2009
and it is now waiting for Senate to vote on it. According to Point Carbon’s survey, 81% of participants expect the US to introduce an emission trading scheme in 2014 (Point Carbon, 2010). Viswanathan (2010) proposes a hybrid approach to regulate the future U.S. carbon emission market, which involves a combination of exchange-traded centralised trading for
large financial intermediates and over-the-counter (OTC) transactions for small contracts.If a
U.S. emission trading programme was to be introduced, the trading volume of the global carbon market as a whole would be boosted, and it would probably surpass the EU ETS to become the largest carbon market within a few years.
Other carbon emission markets include: New Zealand’s emission trading scheme (NZ ETS), launched in 2008; the emission trading programme in Quebec, Canada (launched in 2013); and a number of provincial carbon emission markets in China (initiated from 2013 onwards). Australia will implement an emission trading programme in 2015 and will link it to the EU ETS. Furthermore, Kazakhstan, Japan, South Korea, Brazil and Mexico have all passed legal procedures for introducing their own emission trading programmes.
More than 15 years have passed since the signing of the Kyoto Protocol. Since then, global carbon emission markets have experienced ongoing development. Currently, carbon emission markets are sizeable and are continuing to expand rapidly. The regulatory framework for carbon emissions is not static; it incorporates the lessons learned from previous experience (Newell et al., 2012). Overall, carbon emission markets aid the efficient reduction of GHG emission and will attract an increasing amount of investment in the future (Newell, Pizer and Raimi, 2013).
5 This is a mandatory emission reduction Act, which requires U.S. to reduce GHG emission by 20% below 2005 emission levels before 2020, and introduced a series of long-term targets.
21
Figure 2.1: Time series of the EUA prices (€ per CO2 ton, continuous futures contracts)
Note: This figure displays the time series of the EUA futures prices in the first and second commitment periods of the EU ETS (from 22 April, 2005 to 31 December, 2012). To construct a continuous series of futures prices, the futures contracts switch over on the first day of a new month’s trading, for all available trading months.
Figure 2.2: Market value of European carbon emission market ($ billion)
Note: This figure presents the annual market value of the European carbon emission market. The data is obtained from the World Bank (currently there is no data available for 2012).
0 5 10 15 20 25 30 35 0 20 40 60 80 100 120 140 160 2005 2006 2007 2008 2009 2010 2011
22
Chapter 3
Hedging carbon emission allowances using Markov regime
switching approaches
Abstract
Using the second commitment period data for the European Union emission trading scheme (EU ETS), this chapter models the relationship between carbon spot and futures markets by incorporating state dependent characteristics in the return and volatility processes, and assesses the effectiveness of constant and dynamic hedge ratios. In particular, this chapter proposes a new framework for the carbon emission markets which combines regime switching behaviour and disequilibrium adjustment in the mean with a state dependent dynamic volatility process. It is found that the class of regime switching hedging strategies, especially the new approach proposed in this chapter, significantly outperform competing methods for all the measures considered, and for both in-sample and out-of-sample analysis. The results indicate that risk managers using state dependent hedge ratios to manage the financial risk in carbon emission markets can achieve greater variance reduction and better hedging performance.
23
3.1.
Introduction
Launched in 2005, the European Union emission trading scheme (EU ETS) is a
“cap-and-trade” system6 aimed at reducing emissions of carbon dioxide and other greenhouse
gases (GHGs) efficiently and economically. Since its inception, European carbon emission markets under the EU ETS have experienced rapid ongoing development and have attracted considerable attention from policy makers and investors. The total value of European Union
allowances (EUAs)7 transactions had risen to 118.5 billion U.S. dollars with an 18% growth
rate even during the recent global financial crisis (2008-2009), which is considerably faster than the growth rate in other financial markets (World Bank, 2010).
Given the novel features and rapid growth of the carbon emission markets, an increasing number of studies have been conducted within this market. The existing literature mainly focuses on pricing carbon spot and derivatives assets (e.g. Benz and Trück, 2009; Daskalakis et al., 2009), or modelling the relationship between spot and futures prices (e.g. Uhrig-Homburg and Wagner, 2009; Joyeux and Milunovich, 2010; Chevallier, 2010; Rittler, 2012; among others). However, little attention has been paid to risk management, especially hedging, in carbon emission markets. The risk associated with carbon markets involves the possibility of being fined for uncommitted allowances and the uncertainty of carbon
6 Under this system, central authorities set up a standard or “cap” on the total amount of greenhouse gases that a country or region is allowed to emit within a year. The authorities then allocate the allowance of emission units, which is the right to emit a certain amount of greenhouse gases. Companies’ GHG emissions should not exceed the allocated allowance represented by their in-hand allowances; otherwise they must deliver the missing carbon allowances in the next year and also incur a heavy penalty. The GHG emissions not covered by the surrendered carbon allowances incur a fine of €40 per CO2 ton in Phase I and €100 per CO2 ton in Phase II. In addition, the uncovered carbon allowance should also be surrendered in the next compliance year. The total amount of allowances should not exceed the cap. As a consequence, the total amount of emissions can be controlled and kept under a target level. If a company needs to emit more than its allocated allowance, it can buy carbon allowances from another company which has some emission allowances remaining. According to the Coase theorem (Coase, 1937, 1960), under the assumption of zero transaction costs, and if the authorities allocate and protect the rights of allowance holders very effectively, the “cap-and-trade” system can completely solve the externalities problem of market failure.
7
The financial instruments traded in the carbon emission markets are known as carbon allowances. EUA is the carbon allowance traded under the EU ETS.
24
emission prices. Exceptions include Fan et al.’s (2013) study of hedging performance in the European carbon markets. The authors estimate the optimal hedge ratios in the first and second commitment periods of the EU ETS, which are obtained from the ordinary least squares (OLS) model, the two-stage error correction model (ECM), and the vector ECM (VECM) model, as well as the VECM model with bivariate generalised autoregressive conditional heteroskedasticity (GARCH) errors. The results indicate that the static hedge ratio from the simple OLS model can provide the greatest variance reduction in most cases.
However, Kroner and Sultan (1993) argue that if the asset prices follow time-varying distributions, time variation should also be taken into account for the optimal hedge ratio. Lien (2008) suggests that the OLS model tends to underperform dynamic hedging approaches in a number of empirical studies. The inferior performance of dynamic hedge ratios in Fan et al.’s (2013) study may be attributed to the fact that the VECM-GARCH model does not fit the data very well. Benz and Trück (2009) estimate the dynamics of carbon spot prices using various time series models. It is found that the Markov regime switching model outperforms the AR (1)-GARCH (1, 1) model in terms of in-sample fit and out-of-sample forecasting. Benz and Trück (2009) argue that the regime switching model is a promising approach for modelling the price dynamics of carbon emission allowances because it can capture the economic and econometric characteristics of carbon allowance prices. Firstly, the demand and supply of carbon allowances, which determine the carbon allowance prices, fluctuate according to the regulatory framework, production level, weather conditions and other factors. The regime switching model can reflect such fluctuations by allowing a systematic switching between a high variance (unstable) state and a low variance (stable) state. In particular, the Markov regime switching models, where the regimes are determined by an unobservable state variable, are more appropriate for carbon emission markets because the regulatory and sociological variables which could affect carbon
25
allowance prices are unquantifiable and unobservable. Secondly, the carbon allowance prices and returns exhibit price jumps, spikes and high volatility (Benz and Trück, 2009; Daskalakis et al., 2009). The regime switching model can capture these econometric properties by allowing for several successive price jumps and very high or low returns, which is important in risk management. In addition, Chevellier (2011a, b) also showed the advantages of using the Markov regime switching (MRS) vector autoregressive (VAR) model over the single regime VAR model in examining the relationship between carbon allowance prices and macroeconomic variables. The evidence discussed above implies that the hedge ratios generated from regime switching models could outperform single regime hedging models in carbon emission markets.
Motivated by the above results and arguments, this chapter aims to investigate the performance of state dependent hedge ratios in the European carbon emission markets. This thesis adopts the Markov regime switching model rather than another non-linear model (e.g. threshold models) because the hedging performance of threshold models is poor in the literature and the Markov regime switching model is shown to have good in-sample fit and out-of-sample forecasting for carbon markets. The Markov regime switching hedging strategies have been found to outperform the OLS and GARCH model in various financial markets (e.g. Alizadeh and Nomikos, 2004; Lee and Yoder, 2007a, b; Alizadeh, Nomikos and Pouliasis, 2008; Salvador and Arago, 2013). However, the Markov regime switching approaches to hedging have not been applied in the carbon emission markets.
By examining the research question above, this chapter contributes to the literature in the following respects. Firstly, this chapter proposes a new framework with which to model the relationship between carbon spot and futures markets, which incorporates the concepts of regime switching, disequilibrium adjustment and volatility clustering. This method considers
26
Markov regime switching (MRS) behaviour and the long run relationship between spot and futures prices (LR) in the mean, and the state dependent dynamic volatility process which is modelled by Engle’s (2002) dynamic conditional correlation (DCC) GARCH (MRS-LR-DCC). This approach differs from Lee and Yoder’s (2007b) MRS-TVC-GARCH model by
allowing the disequilibrium adjustment coefficients to be state dependent.8 It has been shown
that if spot and futures prices are cointegrated, overlooking the adjustment of the long run relationship between spot and futures prices will result in model misspecification and therefore inferior hedging performance (e.g. Kroner and Sultan, 1993; Lien, 1996). In addition, the author’s model differs from the MRS-BEKK method used by Alizadeh et al. (2008) because it allows the conditional correlations to be time-varying and state dependent. Secondly, this chapter first adopts the Markov regime switching approaches in order to hedge the financial risk in carbon emission markets. Given the economic and econometric properties of carbon prices, the state dependent hedge ratios are expected to provide higher variance reductions. Thirdly, although the first moment of carbon emission returns have been modelled using Markov regime switching approaches in both univariate (Benz and Trück, 2009) and bivariate frameworks (Chevellier, 2011a, b), no previous research has allowed the conditional variance of carbon asset returns to be state dependent. Chevellier (2011c) demonstrates that there are strong shifts and significant instability in the conditional variance of carbon asset returns. For this reason, this chapter is the first to introduce the state dependent dynamic volatility process into the study of carbon emission markets.
8 Another difference in the author’s model and the MRS-TVC-GARCH model is that this chapter uses Engle’s (2002) method to model the condition correlations while Lee and Yoder (2007b) employed Tse and Tsui’s (2002) approach. The only difference between the two methods is the way in which they standardise the residuals in the conditional correlation equation.