7
Drainage
Patrick Willems and Benjamin Lloyd-Hughes
Abstract
Hydrological extremes, largely driven by precipitation, are projected to become more intense within the North Sea region. Quantifying future changes in hydrology is difficult, mainly due to the high uncertainties in future greenhouse gas emissions and climate model output. Nevertheless, models suggest that peak riverflow in many rivers may be up to 30 % higher by 2100, and in some rivers even higher. The greatest increases are projected for the northern basins. Earlier springfloods are projected for snow-dominated catchments but this does not always cause an increase in peakflows; peakflows may decrease if higher spring
temperatures lead to reduced snow storage. An increase in rain-fed flow in winter and
autumn may change the seasonality of peakflows andfloods. The proximity of a river basin to the ocean is also important; the closer the two the greater the potential damping of any climate change effect. In urban catchments, the specific characteristics of the drainage system will dictate whether the net result of the climate change effect, for example the projected increase in short-duration rainfall extremes, is to damp or amplify the impact of this change in precipitation. The response in terms of sewerflood and overflow frequencies and volumes is highly non-linear. The combined impact of climate change and increased urbanisation in some parts of the North Sea region could result in as much as a four-fold increase in sewer overflow volumes.
7.1
Introduction
The hydrological cycle is an intrinsic part of the climate system. Changes within the climate directly and indirectly influence the components of the hydrological cycle. As an illustration, climate change may alter river regimes directly through changes in rainfall, and indirectly through changes
in temperature, which may change evaporation and affect snow melt. Differences in rainfall intensity may alter flood hazards through changes in peak discharge and erosion. Additionally, temperature changes, especially during sum-mer, affect the soil water content and groundwater recharge,
and thus water input (from ground water and baseflow) to
rivers. As a result, the risk of lowflow alters, which can also impact on water quality, navigation and water availability for agricultural and industrial purposes. In short, climate change affects or controls inputs, losses, storage and transfer into the
hydrological system (IPCC2014). Whether and in what way
this is the case for the North Sea region is the focus of this chapter, based on a review of available studies on climate
change impacts on river flow in the North Sea region.
Impacts in urban catchments are also considered.
To assess the potential impacts of climate change on river
flow, methods are applied that make use of both climate
models and hydrological models. Climate models simulate Electronic supplementary material Supplementary material is
available in the online version of this chapter at 10.1007/978-3-319-39745-0_7.
P. Willems (&)
Department of Civil Engineering, KU Leuven, Leuven, Belgium e-mail: patrick.willems@bwk.kuleuven.be
B. Lloyd-Hughes (&)
Walker Institute for Climate System Research, University of Reading, Reading, UK
e-mail: B.LloydHughes@reading.ac.uk
©The Author(s) 2016
M. Quante and F. Colijn (eds.),North Sea Region Climate Change Assessment, Regional Climate Studies, DOI 10.1007/978-3-319-39745-0_7
the climate system to determine the response to changes in
greenhouse gases in the atmosphere (see Chap. 5) while
hydrological models simulate the climate change effect on the water cycle. To assess the potential impact of climate change on riverflow, climate change signals are used to alter the input to hydrological models that aim to simulate the climate-driven response in the hydrological environment. The strength of the changes depends on the temporal and spatial scales being examined.
River flow may be affected by changes in land use,
ground water abstraction, hydraulic structures (such as reservoirs) along the river course, and urbanisation (see Sect.7.3.3), among others; none of which are directly linked to climate change. Such features mean not all climate-driven hydrological impacts are easily discernible, and so caution is necessary when attributing hydrological change to‘climate change impact’; see also Chap.5.
7.2
Methodology
7.2.1
Temporal and Spatial Scales
Uncertainties in climate and hydrological models mean caution must be applied in using the model output to project climate-driven impacts on riverflow. This is especially the case for studying local hydrological impacts. Local climates are represented in regional climate models (RCMs) at the spatial resolution of the RCMs, and are less reliable than the coarser resolution climate data obtained from the same RCMs or from global climate models (GCMs). However, the reliability of climate models is improving due to the ongoing research in climate science (see the Supplement S7 to this chapter). The highest resolution RCMs are now in the range of a few tens of kilometres which reduces the mismatch with hydrological models that often operate at resolutions of a few kilometres or less. High resolution models, however, do not completely resolve the physics of the climate system so climate model output still requires further scrutiny before use in regional climate studies.
Although the natural processes addressed in climate and hydrological models are closely linked, because climate sci-ence and hydrology are separate disciplines the technical aspects of these different disciplines require an interface linking the respective models. This interface allows a realistic transfer of information between climatic and hydrologic simulations. Methods at the interface range from the direct use of climate model output to correct for bias (systematic over- or underestimations) before use. However, direct use is rarely implemented due to the bias in climate models. Another major interfacing issue is the need for high resolution data in many hydrological applications, both in space and time. Finer-resolution climate models imply a developmental and
computational burden which translates to higher resources, in time and money. While efforts to increase the resolution of GCMs and RCMs continue (e.g. HiGEM, Shaffrey et al. 2009; Kendon et al.2012) the current state-of-the-art is well short of the requirements for local hydrological modelling.
These two main interfacing problems are met by applying statistical downscaling to the climate model output, ulti-mately in combination with bias correction. The aims of the bias correction and statistical downscaling are to eliminate systematic errors between the climate model output and the
corresponding meteorological variables at the finer
hydro-logical impact scales and/or to convert the climate model output to the finer-scale variables using statistical methods
(Maraun et al. 2010; Gudmundsson et al. 2012a). More
discussion on the mismatch of scales, statistical downscaling and bias correction is available in the Supplement S7. These downscaling and bias correction methods have increased data availability for hydrological assessments. Different approaches have been developed. Several have been applied in the North Sea region, depending on the area, type of hydrological impact, approach and experience of the mod-eller and available resources, among others.
7.2.2
Analysis
Determining the climate-driven change in river flow
typi-cally includes four steps: evaluating the climate models; downscaling/bias correction of the hydrological variables from the climate scenarios; converting climate change signals/perturbations to hydrological parameters; and simu-lating the hydrological climate change effect.
Different types of hydrological models have been used for studying the impact of climate change, depending on the scale and the processes. Conceptual rainfall-runoff models have been widely applied to individual catchments because of their ease of use and calibration (limited number of model parameters) and because they provide overall runoff esti-mates at the scale of a catchment or sub-catchment (see Supplement S7 for examples). In order to capture the spatial variability of the hydrological response in larger river basins or regions, spatially-distributed hydrological balance models have been applied. These can be of a conceptual nature or more detailed, depending on the types of impacts studied
(e.g. Shabalova et al. 2003; Lenderink et al. 2007;
Thompson et al.2009; Bell et al.2012; Huang et al.2013). At the continental and global scale, land surface models and coarse-scale global water balance models are used, such as at
the scale of Europe (e.g. Dankers and Feyen 2008; Feyen
and Dankers 2009; Prudhomme et al. 2012) or the entire
globe (e.g. Arnell and Gosling2016; Dankers et al.2014). Hydrological impact results are typically evaluated for mean annual or seasonal volumes, but also forflow extremes
(peakflows and lowflows). The latter are of particular rel-evance for water management, given that they are funda-mental toflood and water scarcity risks. Peak and lowflow extremes for current and future climatic conditions are typ-ically compared for quantiles, hence for given exceedance probabilities or return periods. Such quantiles, for example the 100-year peakflow, form the basis of water engineering design statistics. They can be obtained empirically from the
independent extreme flows extracted from the simulated
time series (possible only up to the length of the time series), or after extreme-value analysis (required for extrapolating beyond the length of the time series). Bastola et al. (2011), Arnell and Gosling (2016), Dankers et al. (2014), and Smith et al. (2014), for example, defined peak flows as annual
maximum flows and extrapolated these based on the
Gen-eralized Extreme Value (GEV) distribution. Lawrence and Hisdal (2011) did the same but used the Gumbel distribution
as a special case of the GEV, and Kay and Jones (2012)
made use of a generalised logistic distribution. Willems (2013a) selected independent peakflows from a time series by means of hydrological independence criteria to obtain a peak-over-threshold or partial-duration-series. These typi-cally follow the Generalized Pareto Distribution (GPD), or the exponential distribution as a special case. The statistical uncertainty in estimates of large return periods (e.g. 100 years) may be considerable, however, especially when based on relatively short time series (typically 30 years for climate model results) (Brisson et al. 2015). Using infor-mation onflood thresholds or hydraulicflood modelling, the
flow extremes can be related to flood hazard (e.g. return
period of flooding) or even flood risk after considering
functions describing the regional or local relationship
between flood flow or depth and the flood consequences
(Feyen et al. 2012; Ward et al. 2013; Arnell and Gosling
2016).
For impact analysis on urban drainage (sewer floods),
because of the quick response of such systems to rainfall, changes in short-duration extremes (hourly to sub-hourly) are considered. These changes are propagated to changes in
sewer flow by full hydrodynamic or conceptual sewer
models; a recent state-of-the-art review of methods, difficulties/pitfalls, and impact results was made by Willems et al. (2012a,b).
As well as changes in rainfall and evaporation, for impact analysis on water quality in urban drainage systems and along rivers, changes in other variables must also be con-sidered. Impacts on water quality are not only controlled by changes in rainfall, but also by (changes in the length of) dry periods. In the case of longer dry periods in north-western Europe, river pollution will be less diluted and river water quality will deteriorate. Some sources of river pollution might even increase, such as pollution originating from sewer overflows.
Along sewer systems, longer dry periods cause water and wastewater to stay for longer in the sewer pipes. Particularly in the low andflat North Sea region, this will lead to higher sewer solids sedimentation (Bates et al.2008). An increase in short-duration rainfall extremes will not only increase peak runoff discharges but will also increase wash off from surfaces (impermeable and permeable) in the sewer
catch-ment. An increase in runoff and sewer peak flows, would
increase the frequency of sewer overflows or the spilling of storm- and/or waste-water into the receiving river. These effects are studied by integrated urban drainage models comprising the sewer system, wastewater treatment plant and receiving river. Using such a model, Astaraie-Imani
et al. (2012) studied the impact of climate change (and
urbanisation) on the receiving water quality of an urban river for dissolved oxygen and ammonium using a semi-real case study in the UK. Another application, but for a catchment in Belgium and limited to theflow impacts of sewer systems on receiving rivers was reported by Keupers and Willems (2013). Other types of climatic change effect along sewer systems include changes in temperature, which affect sewer
quality processes (Ashley et al. 2008), risk of sulphide
production in the sewer pipes, and increased odour prob-lems; as well as increased sewerfloods and sewer overflows because of changes in snowmelt patterns in mountainous regions, sea-level rise in low-lying coastal areas, inflow of groundwater during the wet season, and increased leakage of wastewater into the soil during the dry season, among others. Whatever model type is applied, it is necessary to be aware that parameters calibrated for historical periods may not be valid under a changing climate. For instance, it is known that under dry conditions, soil moisture parameters are likely to change, which may affect the hydrological processes by introducing other complex mechanisms
(Diaz-Nieto and Wilby2005). One way of understanding the
changes is to assess longer hydrological and meteorological records with significantly different changes in climate and land use (Refsgaard et al.2014). However, sufficiently long time series (e.g. over 100 years) are often not available to evaluate this assumption.
It is also necessary to be aware of the limitations of the models in modelling particular types of extremes (e.g. high
flow, low flow). For that reason, methods have been devel-oped that explicitly validate model performance for high and
low extremes; see Seibert (2003), Willems (2009), and
Karlsson et al. (2013). Van Steenbergen and Willems (2012) proposed a data-based method to validate the performance of
hydrological models in describing changes in peak flow
under changes in rainfall extremes, prior to their use for climate change impact investigations. Vansteenkiste et al.
(2013, 2014) compared different hydrological models and
concluded that the impact results of climate scenarios might
underlying assumptions, especially for low flow. Gosling et al. (2011) applied two types of distributed hydrological model to different catchments, including the Harper’s Brook catchment in the UK, to analyse the impact uncertainty from seven GCM runs. Both models simulated similar climate change signals, but differences occurred in the mean annual runoff, the seasonality of runoff, and the magnitude of changes in extreme monthly runoff. Also, Bastola et al.
(2011) emphasised the importance of incorporating
hydro-logical model structure and parameter uncertainty in
esti-mating climate change impacts on flood quantiles. They
found that the highest model uncertainty is associated with
low frequency flood quantiles and with models that use
nonlinear surface storage structures. Lawrence et al. (2009) investigated model parameter calibration uncertainty for the Nordic HBV model calibrated to 115 Norwegian catch-ments. This was done by selecting 25 parameter sets that lead to almost equal model performance. In general, how-ever, hydrological model related uncertainty is low
com-pared to climate model uncertainty (Minville et al. 2008;
Kay et al.2009). The latter is shown by comparing
evalu-ations of climate and hydrological model performance against observations; however limited to historical (climate) conditions. For drought, Prudhomme et al. (2014) concluded that global hydrological models show a higher uncertainty than global climate models. At the catchment scale, it appears that hydrological model impact uncertainties are greater for lowflow than for peakflow (Vansteenkiste et al. 2013,2014), but are still less than from climate models.
7.2.3
Scenarios
Owing to the high uncertainties involved in the parameter-isations of the climate models and the future greenhouse gas scenarios (see Supplement S7), it is better to apply a broad ensemble set of climate model simulations. Uncertainty in the future projections can thus be partly accounted for (Palmer and Räisänen 2002; Tebaldi et al. 2005; Collins 2007; Smith et al.2009; Semenov and Stratonovitch2010). Use of ensemble-based probabilistic projections has been
proposed but would raises questions and difficulties for
impact modellers (New et al.2007). Linking probabilities to future scenarios is a commendable idea, but it is not clear how the use of probabilities would maintain internal con-sistency, which is a key requirement for impact analysis. It is pragmatic, therefore, to make use of existing climate change impact methods, albeit with improvements.
Any ensemble of climate model runs best includes a broad set of different climate models and greenhouse gas scenarios (SRES, RCP; see Supplement S7). Note in this respect that hydrological impact analyses of climate change to date have largely ignored the most pessimistic projections
for climate change such as the SRES A1FI scenario. It has been argued that emission trends since 2000 are in line with the A1FI projections made in the 1990s (Raupach et al.
2007), which means that the A1FI scenario is becoming
more plausible and the most likely projected high flows
could be even higher than those reported here. Recent evi-dence also suggests that GCM projections underestimate the amount of warming that is already being observed in western
Europe (van Oldenborgh et al.2009).
The hydrological impact results reported in this chapter are primarily based on the SRES scenarios. Hydrological impact results for the newer RCP-based climate scenarios were still limited at the time this chapter was drafted (first global results exist: Dankers et al.2014; Prudhomme et al.
2014), but it would be worth more extensively testing the
change and consistency in impact results between the SRES and RCP-based scenarios.
In addition to uncertainties in the climate process mod-elling and greenhouse gas scenarios, the downscaling method used adds to uncertainty in the climate scenarios (see more discussion in the Supplement S7). Impact modelling based on large ensembles of climate model simulations under different downscaling assumptions remains difficult in practice because of the high computational costs associated with hydrological and hydraulic modelling. A pragmatic approach would be to summarise the different meteorologi-cal impact results of climate change in a limited set of (tailored) scenarios. Examples include the UKCIP02 (Hulme
et al. 2002), UKWIR06 (Vidal and Wade 2008), and
UKCP09 scenarios in the UK (Murphy et al. 2009), the
KNMI’06 scenarios in the Netherlands (Van den Hurk et al.
2006; de Wit et al.2007), and the CCI-HYDR scenarios in
Belgium (Willems2013a; Ntegeka et al. 2014).
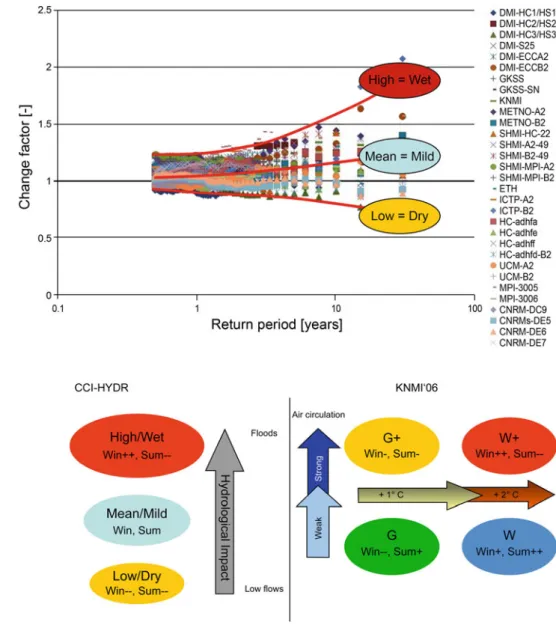
Figure7.1 illustrates how the CCI-HYDR high, mean
and low scenarios for one particular season are based on the highest, average and lowest climate factors for the entire set of potential scenarios considered. The changes for different seasons are combined in different versions such that they lead to high, mean, and low impacts for specific (tailored) hydrological applications, for example winter floods, sum-merflashfloods and summer lowflows. This is the opposite of the KNMI’06 scenarios that are based on meteorological considerations only (Fig.7.2, where scenarios W and G refer to higher or lower changes in temperature, and the scenarios W+ and G+ to stronger changes in atmospheric circulation).
7.3
Projections
7.3.1
North Sea Region
Numerous studies indicate that in north-western Europe a warmer climate may lead to an increase in intense rainfall
(e.g. Kundzewicz et al.2006; Hanson et al. 2007) and to longer dry periods (e.g. Good et al.2006; May2008), and consequent changes in riverflows, as is shown in Table7.1 based on a review by the European Environment Agency
(EEA 2012) and the Intergovernmental Panel on Climate
Change in its Fifth Assessment (IPCC 2014). The
projec-tions indicate an intensification of rainfall during both winter and summer, but for summer, although the heavy rainfall events may become more intense the intensity of the light and moderate events will decrease. How these meteorolog-ical changes will affect riverflow shows strong seasonal and regional differences. For north-western Europe, the intensity and frequency of winter and spring riverfloods are generally
expected to increase (EEA2012).
Based on climate projections from three GCMs and impact analysis in three relatively coarse resolution global
hydrological models, Prudhomme et al. (2012) found that
riverflow in north-western Europe (e.g. Great Britain) would
increase in winter with concurrent increases in regional high
flow anomalies, and would decrease in summer. Giving
particular attention to daily peakflow and relatedflood risk, Hirabayashi et al. (2013), Arnell and Gosling (2016) and Dankers et al. (2014) found strong sub-regional variations in Europe with both increases (mostly for the UK, France and Ireland) and decreases in the size of the flood-prone popu-lations. Giving particular attention to hydrological droughts, Prudhomme et al. (2014) found significant increases in the frequency of droughts of more than 20 % in central and western Europe. Also based on a coarse-scale hydrological model, but this time with a focus on the main rivers in
Europe, Feyen and Dankers (2009) found stream flow
droughts will become more severe and persistent in most parts of Europe by the end of the century, except in the most northern and-north eastern regions.
However, it should be noted that these results are based on only one RCM run (HIRHAM 12-km resolution model; Fig. 7.1 High-mean-low tailored
climate scenarios to simplify the flood impact analysis based on an ensemble set of climate model simulations (here: factor change in daily rainfall quantiles from 1961–1990 to 2071–2100 for A2 and B2 SRES scenarios and all RCM runs available for Belgium from the EU PRUDENCE project; Ntegeka et al.2014)
Fig. 7.2 Tailored climate scenarios: hydrological impact based (leftCCI-HYDR, Ntegeka et al.2014) versus meteorological based (rightKNMI’06, van den Hurk et al.2006)
A2 and A1B SRES scenarios). Based on the same RCM runs and the same hydrological model, Dankers and Feyen (2008) and Rojas et al. (2011) focused on theflood hazard climate change impact and found that extreme discharge levels may increase in magnitude and frequency in parts of western and eastern Europe. In several rivers, the return period of what is currently a 100-yearflood may decrease to 50 years or less. Rojas et al. (2012) extended the analysis by applying the same hydrological model to 12 RCM runs, and concluded that results show large discrepancies in the magnitude of
change in the 100-year flood for the different RCM runs.
Some regions even show an opposite signal of change, but for many regions the projected changes are not statistically
significant due to the low signal-to-noise ratio. Western
Europe and the British Isles show a robust increase in future
flood hazard, mainly due to a pronounced increase in
extreme rainfall. A decrease in the 100-year flood, on the other hand, is projected in southern Sweden because the signal is dominated by a strong reduction in snowmelt-induced springfloods, which offsets the increase in average and extreme precipitation. This is also valid for other snowmelt dominated areas of the North Sea region.
Another Europe-wide hydrological impact study was undertaken by Schneider et al. (2013) who applied the global
hydrological model WaterGAP3 on a 50′×50′ European
grid. Climate change impacts were based on three GCMs after bias correction. Looking at their results for the North
Sea region, they found that flow magnitude was more
affected in the northern parts of the North Sea region, such as Sweden and Norway, with strong increases projected in winter precipitation. The lowest impacts across Europe were found in western Europe (i.e. the UK, Ireland, Benelux, Denmark, Galicia and France). The difference is due to the additional impact of temperature on snow cover in the
northern region. The greatest impact on peak flows in
Scandinavia occurred in April, rather than May, one month earlier in the future. Earlier snowmelt in spring and sporadic melt events in winter will reduce snow storage. However, in Sweden and Norway, these effects were more than com-pensated for by higher precipitation. During summer (June to September), increased precipitation is offset by greater evapotranspiration. Scandinavia is the only region in Europe where elevated lowflows are projected.
7.3.2
Sub-region or Country-Scale
7.3.2.1 BelgiumUsingfiner scale hydrological models (c.f. Sect.7.3.1), more local European climate studies have projected similar cli-mate change impacts. For 67 catchments in the Scheldt river basin in Flanders, Boukhris et al. (2008) found that extreme peakflows in rivers may increase or decrease depending on the climate scenario used. Winter rainfall volumes increase but evapotranspiration volumes also increase. Depending on the balance between rainfall increase versus evapotranspi-ration increase, the change in net runoff may switch from positive to negative. From a set of 31 statistically down-scaled RCM simulations and more than 20 GCM simulations available for Belgium, the most negative change led to an increase in the river peakflows of about 30 % for the 2080s (Fig.7.3).
Impacts on river lowflows were more uniform. All of the climate model simulations projected a decrease in river
low flow extremes during summer. For Belgian rivers, the
change in lowflow extremes projected for the 2080s ranged
between −20 and −70 % (Fig.7.3). The drier summer
conditions for Belgium lead to lower groundwater levels, as
shown by Brouyére et al. (2004) and Goderniaux et al.
(2009) for the Geer catchment, and by Dams et al. (2012)
and Vansteenkiste et al. (2013, 2014) for the Nete
catchment.
7.3.2.2 Northern France
Within the main river basins in France, Boé et al. (2009) found a decrease in mean discharge for summer and autumn. They also simulated a decrease in soil moisture, and a decrease in snow cover, which was especially pronounced at
low and middle altitudes. The lowflows in France become
more frequent. This was also found by Habets et al. (2013) for the rivers Seine and Somme in northern France, based on
seven hydrological models ranging from lumped
rainfall-runoff to distributed hydrogeological models, and three downscaling methods. A general decrease in riverflow of at least 14 % occurred at the outlets of the Seine and Somme basins by the 2050s and at least 22 % by the 2080s. More than 90 % of projections showed a decrease in sum-merflow at these outlets. For the winter high flows, about Table 7.1 Typical change in inland riverflows for northern and north-western Europe (EEA2012; IPCC2014)
Variable Northern Europe North-Western Europe
Observed Projected Observed Projected
Riverflow + + (+) +
Riverflood ± + +
River lowflow (drought) 0 + 0 −
10 % of projections showed the possibility of increasedflow in winter in the River Seine and throughout the year in the River Somme, while 10 % projected a decrease of more than 40 % in river discharge at the basin outlets. For the same basins, Ducharne et al. (2011) found little change in the risk offloods for the 10- and 100-year return periods.
7.3.2.3 Germany
For various river basins in Germany, including the Ems, Weser, Elbe and Rhine (up to the Rees gauge station), based
on two RCM simulations Huang et al. (2013) found an
increase of about 10–20 % in the 50-yearflood levels in the rivers Weser, Rhine, Main, Saale and Elbe. The Ems showed no clear increase and the Neckar a 20 % decrease. In contrast, the Wettreg statistical downscaling method projected a
decrease inflood level for the Ems and Weser (10 %), and
Saale (20 %) river basins, and no distinct change for the Main
and Neckar. For the River Rhine, Shabalova et al. (2003)
found future climate scenarios to result in higher mean dis-charges in winter (about +30 % by the end of the century),
but lower mean discharges in summer (about −30 %),
par-ticularly in August (about−50 %). Temporal variability in the 10-day discharge increased significantly, even if temporal variability in the climatic inputs remains unchanged. The annual maximum discharge increases in magnitude throughout the Rhine and tends to occur more frequently in winter, suggesting an increasing risk of winterfloods. At the Netherlands-German border, the magnitude of the 20-year
maximum discharge event increased by 14–29 %; the
present-day 20-year event tends to reappear every 3 to 5 years. The frequency of low and very lowflows increases, in both scenarios alike. Studying changes in 10-day precip-itation sums for return periods in the range 10 to 1000 years
in the Rhine basin (within the scope of the RheinBlick2050 project), van Pelt et al. (2012) found changes of up to about +30 %. Pfister et al. (2004) projected increased flooding probably due to higher winter rainfall for the Rhine and Meuse river basins. Most hydrological simulations suggest a progressive shift of the Rhine from a ‘rain-fed/meltwater’ river to a mainly‘rain-fed’river. Studying projected change in the 1250-year peakflows in the Rhine and Meuse rivers, which are used as the basis for dike design along these rivers, de Wit et al. (2007) found the 1250-year peakflow to increase from 16000 to 18000 m3s−1by 2100 for the Rhine and from 3800 to 4600 m3s−1for the Meuse. For lowflow, they found stronger seasonality in the discharge regime of the Meuse: increased low discharge in winter and decreased low
dis-charge in summer. The samefindings were obtained by van
Huijgevoort et al. (2014). 7.3.2.4 Ireland
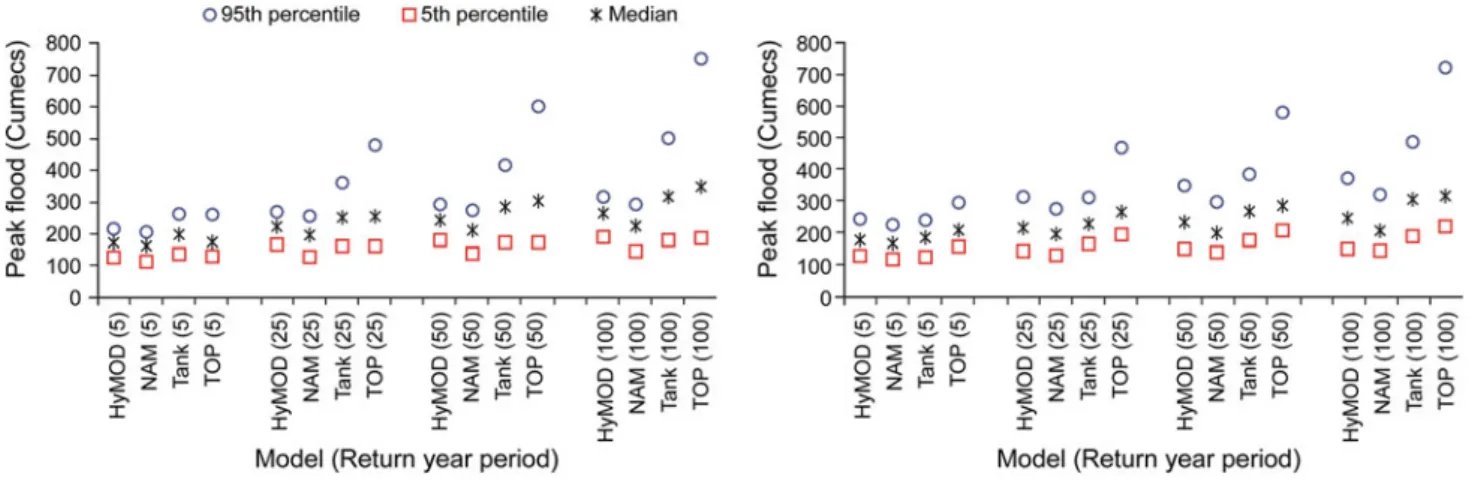
For catchments in Ireland, Bastola et al. (2011) simulated monthly changes derived from 17 GCM runs to the input of four hydrological models, and quantified the impact onflood quantiles up to 100-year return periods. They also studied the sensitivity of the impact results within and between hydrological models. The results show a considerable residual risk associated with allowances of +20 % when uncertainties are accounted for and that the risk of exceeding design allowances is greatest for more extreme, low fre-quency events (Fig.7.4) with major implications for critical infrastructure such as culverts, bridges, andflood defences. 7.3.2.5 Scandinavia
In the Scandinavian countries, the increase in peakflows is higher than in other North Sea countries due to the higher Fig. 7.3 Percentage change in
lowflows for a low/dry CCI-HYDR climate scenario (upper) and peakflows for a high/wet CCI-HYDR climate scenario (lower), averaged for return periods of 1–30 years, for 2071–2100 and 67 catchments in Flanders, Belgium (Boukhris et al.2008)
increase in winter rainfall. In Norway, Lawrence and Hisdal
(2011) studied the changes in flood discharges for 115
unregulated catchments. Projected changes in peak flow
quantiles for return periods of 200, 500 and 1000 years show strong regional differences (Fig.7.5). These regional differ-ences are explained by the role of snowmelt versus rainfall
and how they increase the peak flows. This is, however,
different for catchments where peakflows are mainly due to snow melt in spring. In this case, increased winter temper-ature will cause reduced snow storage, and thus decreased peakflows. An exception is catchments at higher elevations in areas where winter precipitation continues to fall pre-dominantly as snow and higher spring temperatures produce
more rapid snowmelt (SAWA2012). In addition to changes
in snowmelt-induced peak flows, the timing of the peak
flows becomes earlier (i.e. spring rather than summer).
Changes in the seasonality of peak flows occurs in
catch-ments whereflows driven by snowmelt decrease but flows
driven by winter and autumn rainfall increase. The median projected change in the ensemble of hydrological projections
for Norway at 2071–2100 varied from +10 to +70 % in
catchments located in western and south-western regions (Vestlandet), coastal regions of southern and south-eastern
Norway (Sørlandet and Østlandet) and in Nordland, and
decreased down to−30 % for northernmost areas (Finnmark
and parts of Troms) and middle and southern inland areas (Hedmark, Oppland, and parts of Buskerud, Telemark and Trøndelag).
Similar results to eastern Norway were obtained by Andréasson et al. (2011) for Sweden; see the regional dif-ferences in 100-year peakflows in Fig.7.6. They are based on spatial interpolation, without taking into account the influence of river regulation effects. The northern catchments
in Sweden mostly show decreasing peakflows towards the
end of the century, whereas the southern basins show increasing 100-yearflows. The changes in peakflows vary
from −45 to +45 %. A similar range was found by
Teutschbein et al. (2011) and Teutschbein and Seibert
(2012) forfive catchments in Sweden.
Andersen et al. (2006) studied the climate change impact for six sub-catchments within and for the entire Gjern river basin in Denmark, but only based on one RCM simulation. Mean annual runoff from the river basin increased by 7.5 %, whereas greater changes were found for the extremes. The modelled change in the seasonal hydrological pattern is most pronounced infirst- or second-order streams draining loamy
catchments, which currently have a low base-flow during
summer. Reductions of 40–70 % in summer runoff are
pro-jected for this stream type. Similar conclusions were obtained Fig. 7.4 The 95th percentile, 5th percentile and median value for modelledflood quantiles (5-, 25-, 50- and 100-year return periods) for the Moy river basin (left) and Boyne river basin (right) in Ireland (Bastola et al.2011)
Fig. 7.5 Median projected change in peakflows for 200-year return period and 2071–2100 for 115 unregulated catchments across Norway (Lawrence and Hisdal2011; SAWA2012)
based on the same RCM run for five major Danish rivers divided into 29 sub-catchments by Thodsen (2007). The river discharge that exceeded 0.1 % of all days increases approx-imately 15 %, and the 100-yearflood is modelled to increase
11 % on average. Andersen et al. (2006) also studied the
climate change impact on diffuse nutrient losses (i.e. losses from land to surface waters). Simulated changes in annual mean total nitrogen load were about +8 %. Even though an increase in nitrogen retention in the river system of about 4 % was simulated in the scenario period, an increased in-stream total nitrogen export occurred due to the simulated increase in diffuse nitrogen transfer from land to surface water.
7.3.2.6 UK
For eight catchments in northwest England, Fowler and
Kilsby (2007) used an ensemble set of simulation results
with the HadRM3H RCM (UKCIP02 scenarios) and
undertook a comprehensive treatment of climate modelling uncertainty. They concluded that annual runoff is projected to increase slightly at high elevation catchments, but to reduce by*16 % for the 2080s at lower elevations. Impacts on monthly flow distribution are significant, with summer reductions of 40–80 % of meanflow, and winter increases of up to 20 %. The changing seasonality has a large impact on lowflows, with 95 %-percentileflows projected to decrease
in magnitude by 40–80 % in summer months (Fig. 7.7). In
contrast, highflows (>5 %-percentileflows) are projected to increase in magnitude by up to 25 %, particularly at high elevation catchments, providing an increased risk offlooding during winter. Based on the same RCM and with a focus on
river flood hazards in winter, Kay et al. (2006) found
increased flood hazard particularly in East Anglia and the
Upper Thames, withflood peaks in some places increasing
by more than 50 % for the 50-year return level. Clear regional differences were also found by Arnell (2011) and Christierson et al. (2012) after analysing many UK catch-ments and several climate models or scenarios. Based on six
catchments across the UK, Arnell (2011) found clear
dif-ferences between northern and southern catchments, with large climate change effects in winter in the north and summer in the south. After analysing 70 UK catchments, Christierson et al. (2012) found major differences between the western and northern mountainous part of the UK and the rest of the UK, with an increase in winter riverflow over the western part but less clear results or a decrease in mean
monthly river flows all year round. In summer, most
catchments showed negative or very slightly positive chan-ges, with the largest flow decrease in the Thames, Anglian and Severn river basin districts, with decreases of 10 % or more in mean monthlyflows all year round and even more in summer.
A specific study for the River Thames by Diaz-Nieto and Wilby (2005) concluded that substantial reductions in sum-mer precipitation accompanied by increased potential evap-oration throughout the year, lead to reduced riverflow in late
summer and autumn. Kay et al. (2006) found the same
sit-uation even in winter for some catchments in the south and east of England despite an increase in extreme rainfall events. This was explained by higher soil moisture deficits in
summer and autumn that may have an influence up to the
start of winter. Also for the Thames basin, but based on the
more recent UKCP09 scenarios, Bell et al. (2012) found a
10–15 % increase in winter rainfall by the end of the cen-tury. This might potentially lead to higher flows than the River Thames can accommodate. Towards the downstream end, they estimated an average change in modelled 20-year return periodflood peaks by the 2080s of 36 % (range−11 to +68 %).
For the River Avon catchment, Smith et al. (2014)
obtained changes in the 25-year return periodflows of +15, Fig. 7.6 Median projected change in spatially interpolated peakflows
for 100-year return period and 2069–2098 for Sweden (Andréasson et al.2011; SAWA2012)
+2 or +7 % based on three different methods for transferring the climate model output to hydrological model input. For 200-year peakflows, these percentages increased to +22 +19 and +6 %. For the River Medway catchment, Cloke et al. (2010) found a significant lowering of summerflow with a
more than 50 % reduction for 2050–2080 and up to 70 % in
some months. For six other UK catchments, Arnell (2011)
simulated changes in summer runoff of between −40 and
+20 %.
In terms of groundwater recharge, Herrera-Pantoja and
Hiscock (2008) concluded that by the end of the century
decreases in recharge of between 7 and 40 % are expected across the UK, leading to increased stress on local and regional groundwater supplies that are already under pres-sure to maintain both human and ecosystem needs.
The impacts that these hydrological changes may have in terms offlood and water availability risk were assessed by the UK-Government funded initiative AVOID (Warren et al.
2010; MetOffice 2011). Based on an ensemble set of 21
GCMs, it is shown that nearly three-quarters of the models project an increase inflood risk. For the 2030s and averaged
over the UK as a whole, the change ranges from −20 to
+70 %, with a mean of +4 % (Fig.7.8). Larger increases are shown for longer time horizons. Overall, the models show a tendency for a large increase in flood risk for the UK as a whole.
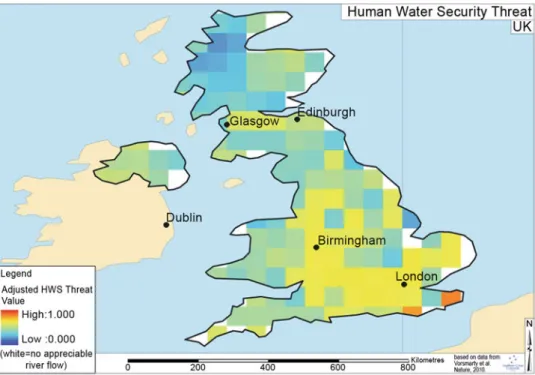
The water availability threat in the UK (calculated using the Human Water Security Threat indicator by Vörösmarty
et al. 2010) ranges from very high in the south-east to
moderate in the south, Midlands, and southern Scotland
(Fig.7.9). For southern England, the loss in deployable
water output due to climate change and population growth is
estimated to be 3 % by 2035 (Charlton and Arnell 2011).
Increased irrigation requirements were also found for the south-east and north-west of England (Henriques et al. 2008).
Fig. 7.7 Change in 95 %-percentileflow between the HadRM3H control and future scenarios for 2020s, 2050s and 2080s time-slices. The uncertainty bounds are for the different SRES scenarios (Fowler and Kilsby2007)
Fig. 7.8 Change in average annualflood risk for the UK, based on 21 GCMs under two emission scenarios (A1B and A1B-2016-5-L), for four time horizons (MetOffice2011). The plots show the 25th, 50th, and 75th percentiles (represented by theboxes), and the maximum and minimum values (shown by the extent of thewhiskers)
7.3.2.7 Comment on Low Flows
Although models project that climate change will cause a decrease in lowflows in north-western European rivers over the coming decades, it should be noted that most models
have low accuracy in the simulation of lowflow extremes.
Evidence for this is provided by Gudmundsson et al. (2012b) based on nine large-scale hydrological models after com-parison to observed runoff from 426 small catchments across Europe. Further evidence is provided by Vansteenkiste et al. (2013,2014) for a catchment in Belgium. Low accuracy for
low flows is associated with the representation of
hydro-logical processes, such as the depletion of soil moisture stores (Vansteenkiste et al.2013,2014).
7.3.2.8 Estuaries
In addition to changes in inland rainfall, temperature and reference evapotranspiration, which lead to changes at the upstream boundaries of estuaries, it is also important to consider changes in the downstream coastal boundary. In relation to the Scheldt estuary (Fig.7.10), Ntegeka et al. (2011, 2012) studied projected changes in mean sea level, storm surge levels, wind speed and wind direction, and their correlation with changes in inland rainfall (see also
Mon-baliu et al.2014 and Weisse et al. 2014). The changes in
storm surge levels were derived from changes in sea-level pressure (SLP) in the Baltic Sea, the Atlantic Ocean area west of France, and the Azores, and a correlation model between SLP and storm surge level. The model was derived after analysing SLP composite maps and SLP-surge
corre-lation maps (Fig.7.11) for days where the surge exceeds
given thresholds (for different return periods). Correlations
were identified between the inland (rainfall, runoff) and
coastal climatic changes. Based on the ensemble set of change factors, tailored climate scenarios (tailored for the
specific application of flood impact analysis along the
Scheldt) were developed to the 2080s. After statistical analysis, a reduced set of climate scenarios (‘high’,‘mean’ and‘low’) was derived for each boundary condition (runoff upstream, mean sea level, and surge downstream). Smart combinations of the scenarios account for the correlation
between boundary changes (Monbaliu et al. 2014; Weisse
et al.2014).
7.3.2.9 Overview
Table7.2 summarises the hydrological impact studies
reviewed in this assessment. Because many of the studies
report climate change impacts on peak river flows, the
impacts were reported as percentage change by the end of the century. Many other hydrological variables are also of
relevance, such as mean or low flows, but fewer studies
report percentage change in these variables or the various study results are not directly comparable (e.g. derived at different time scales: annual vs. seasonal or monthly). It should also be noted that in several regions, the sign and order of magnitude of change are not consistent when results from different studies are compared. This reflects differences in methodology (number and type of climate model and greenhouse gas scenario, type of hydrological-hydraulic impact model, and statistical downscaling and analysis approach; see the Supplement S7 for more discussion on such issues), as well as uncertainties in the numerical pro-jections of changes in hydrology. That results on changes in Fig. 7.9 The human water
security threat for the UK (MetOffice2011)
flood magnitude and frequency resulting from climate change are unclear was also concluded by the international
review of Kundzewicz et al. (2013). It makes clear—as
stressed in Sect.7.2—that great care must be taken when
conducting model-based impact analyses of climate change and in interpreting the results. Typical issues include con-sideration of only one or few climate models, greenhouse gas scenarios and/or hydrological models; poor calibration and validation of models; and inaccuracies of the models in extrapolating beyond historical conditions.
7.3.3
Urban Catchments
Hydrological analyses of urban catchments are based on studies with a particular focus onfine-scale meteorological and hydrological processes (as explained in Sect.7.2.2).
A recent review by Willems et al. (2012a, b) and
Arnbjerg-Nielsen et al. (2013) of the impacts of climate
change on short-duration rainfall extremes and urban drai-nage showed that short-duration rainfall extremes were
projected to increase by 10–60 % in 2100 relative to the
baseline period (1961–1990). An urban drainage system
may damp or amplify changes in precipitation, depending on the system characteristics. For the sewer network of Lund,
Sweden, Niemczynowicz (1989) found the relative change
in urban runoff volume to be higher than for the rainfall input. They found that a 30 % increase in the 40-min rainfall intensity would lead to a 66–78 % increase in sewer
over-flow volume (depending on a return period of between 1 and 10 years and the type of design storm). In Sweden, Olsson
et al. (2009) found an increase in the number of urban
drainage system surface floods of 20–45 % for Kalmar in
2100. For Odense in Denmark, Mark et al. (2008) found
flood depth and the number of buildings currently affected once in every 50 years would correspond to a return period of 10 years in the future (based on the impacts discussed by
Larsen et al. 2009 and Arnbjerg-Nielsen 2012). For
Ros-kilde, also in Denmark, Arnbjerg-Nielsen and Fleischer (2009) found that a 40 % increase in design rainfall inten-sities would lead to a factor of 10 increase in the current level of damage costs related to sewerflooding. The actual change in cost will depend on catchment characteristics. In a similar study for another location with the same increase in rainfall intensity, Zhou et al. (2012) reported a factor 2.5 increase in annual costs. A common conclusion, however, is that the main impact of an increase in precipitation extremes is not primarily related to the additional cost associated with the most extreme events, but rather with the damage occurring far more frequently.
A higher factor increase in sewer impacts compared to the factor increase in rainfall was also reported by Nie et al.
(2009) for Fredrikstad, Norway. They concluded that the
total volume of water spilling from overflowing manholes is Fig. 7.10 Case study on the
Scheldt Estuary: boundary conditions are the downstream surge (North Sea) and the upstream riverflows (different rivers) for which correlation in the changes needs to be taken into account (Ntegeka et al.2012)
Fig. 7.11 Correlation between storm surges along the Belgian North Sea coast at Ostend and sea-level pressure over the North Atlantic region (mean based on historical events) (Ntegeka et al.2012)
Table 7.2 Summary of impact results on riverflows available for the North Sea region
Region Source GCM-RCM(s) considered Greenhouse gas
scenario(s)
Hydrological-hydraulic impact model(s)
Change in river peakflow by 2100
Belgium Boukhris et al. (2008),
Ntegeka et al. (2014); Vansteenkiste et al. (2013,2014), Tavakoli et al. (2014) 31 PRUDENCE RCM runs, 18 ENSEMBLES RCM runs
SRES A1, A1B, A2, B1, B2
Lumped conceptual NAM, PDM, VHM spatially distributed MIKE-SHE, WetSpa
Up to +30 %
Denmark Andersen et al. (2006),
Thodsen (2007)
HIRHAM RCM nested in ECHAM4/OPYC GCM
SRES A2 NAM rainfall runoff model /Mike
11–TRANS modelling system
Up to 12.3 %
France Boéet al. (2009),
Habets et al. (2013), Ducharne et al. (2011)
6 IPCC AR4 GCM runs SRES A1B and A2 Hydrological models MARTHE,
MODCOU, SIM, CLSM, EROS, GARDENIA and GR4 for Seine and Somme
No significant change
Germany Huang et al. (2013) REMO & CCLM RCMs SRES A1B, A2, B1 SWIM eco-hydrological model −20 to +20 %
Germany– Netherlands
van Pelt et al. (2012) 5 RCMs mainly
ENSEMBLES + 13 CMIP3 GCMs
SRES A1B HBV model Rhine basin
Ireland Bastola et al. (2011) 17 GCMs AR4 SRES A1B, A2, B1 4 conceptual models (HyMOD,
NAM, TANK, TOPMODEL) for 4 catchments
Most up to +20 %
Netherlands Shabalova et al. (2003), Lenderink
et al.2007
HadRM2 and HadRM3H RCMs SRES A2 (for Lenderink et al.2007) RhineFlow distributed hydrological model Up to +30 %
de Wit et al. (2007) KNMI’06 scenarios Rhineflow and Meuseflow
distributed hydrological models
Leander et al. (2008) 3 PRUDENCE RCMs SRES A2 HBV model Meuse basin
Norway Lawrence and Hisdal (2011) 13 RCM runs RegClim &
ENSEMBLES
SRES A1B, A2, B2 HBV rainfall runoff model
‘Nordic’version
−30 to +70 %
Sweden Andréasson et al. (2011),
Teutschbein et al. (2011), Teutschbein and Seibert (2012)
12 RCM runs SMHI & ENSEMBLES
SRES A1, A2, B1, B2 HBV rainfall runoff model −45 to +45 %
UK Cameron (2006) UKCIP02 climate change
scenarios: HadRM3 RCM nested in HadCM3 GCM
TOPMODEL
Kay et al. (2006) 1 RCM: HadRM3H
(UKCP02)
SRES A2 Simplified PDM lumped
conceptual rainfall runoff model
Some up to +50 %
Fowler and Kilsby (2007) Ensemble of runs for 1
RCM: HadRM3H (UKCP02)
SRES A2 ADM model Up to +25 %
Chun et al. (2009) 7 GCMs & RCMs pd4-2par conceptual rainfall-runoff
model for 6 catchments
Cloke et al. (2010) HadRM3 RCM: subset of
UKCP09 scenarios
SRES A1B CATCHMOD semi-distributed
conceptual model for Medway catchment
Arnell (2011) 21 CMIP3 GCMs Cat-PDM conceptual model for 6
catchments
Charlton and Arnell (2011) UKCP09 climate change
scenarios
Cat-PDM conceptual model for 6 catchments
Christierson et al. (2012) UKCP09 climate change
scenarios
SRES A1B PDM lumped conceptual rainfall
runoff model and CATCHMOD semi-distributed conceptual model for 70 catchments
Bell et al. (2012) UKCP09 climate change
scenarios
SRES A1B G2G model Thames basin −11 to +68 %
Kay and Jones (2012) Perturbed parameter
ensemble of 1 RCM
Nationwide grid-based runoff and routing model UK
Smith et al. (2014) 18 RCMs from
ENSEMBLES and UKCP09
SRES A1B HBV-light lumped conceptual
rainfall runoff model Avon catchment
−1 to +23 %
two- to four-fold higher than the increase in precipitation, and that the total sewer overflow volume is 1.5- to three-fold
higher. They also found that the number of overflowing
manholes and number of surcharging sewers may change dramatically, but the precise magnitude of change in response to the change in precipitation is uncertain.
Willems (2013a) found that for sewer systems in
Flan-ders, Belgium, built for design storms with return periods of two to 20 years, that the present-day design storms would increase for the high-tailored climate scenario by +15 to +50 % depending on the return period (range 1 month to 10 years) (Fig.7.12). For the mean-tailored scenario, the changes were less: from +4 to +15 %. For the high scenario,
the return period of sewer flooding increases by about a
factor 2.
For the Windermere drainage area in NW England,
Abdellatif et al. (2014) concluded based on the UKCP09
scenarios that an increase in the design storm of as little as 15 % is projected to cause an increase of about 40 % in
flood volume due to surfaceflooding. However, impacts on house basements showed a damping effect (a 35 % increase in design storm leads to 16 % in the number of basements at risk of flooding). This confirms that the precise effects of climate change strongly depend on the type of impacts studies and the specific properties of the sewer system.
The impacts of climate change on sewer flood and
overflow frequencies and volumes show wide variation.
Studies indicate a range from a four-fold increase to as low as a 5 % increase, depending on the system characteristics (Willems et al.2012a,b). Floods and overflows occur when runoff or sewerflow thresholds are exceeded. Given that the response of the sewer system to rainfall may be highly non-linear, the changes in the sewer response may be much stronger than the changes in rainfall. And the impact ranges can even by wider when studying the impacts of sewer overflows on receiving rivers. Sewer overflow mainly occurs in summer and as models project the likelihood of lower
river flow in summer in north-western Europe, dilution
effects in the receiving water might be less, thus increasing
impacts on river water quality and aquatic life.
Astaraie-Imani et al. (2012) found for a semi-real case study in the UK that changes in rain storm depth and peak rainfall intensity of up to +30 % by the 2080s could cause strong deterioration in river water quality; an increase in rain storm depth of 30 % led to an increase in river ammonium con-centration of about 40 % and a decrease in dissolved oxygen concentration of about 80 %. This was found to correspond with a strong increase in the frequency of breaching given concentration thresholds (i.e. immission standards). The Fig. 7.12 Change in the design storm for sewer systems in Flanders,
Belgium, for a 2-year return period for high and mean climate scenarios (Willems2013a)
Table 7.2 (continued)
Region Source GCM-RCM(s) considered Greenhouse gas
scenario(s) Hydrological-hydraulic impact model(s) Change in river peakflow by 2100 UK and NW Europe
Prudhomme et al. (2012) 3 GCMs: ECHAM5,
IPSL, CNRM
Global hydrological models JULES, MPI-HM, WaterGAP (WaterMIP project) Larger rivers
in Europe
Dankers and Feyen (2008), Feyen and Dankers (2009), Rojas et al. (2011,2012)
HIRHAM5 and 12 ENSEMBLES RCM runs
SRES A2, A1B Coarse scale spatially distributed
model LISFLOOD
Dependent on sub-region
Europe Schneider et al. (2013) 3 GCMs SRES A2 Global hydrological model
WaterGAP3
Dependent on sub-region
Globe Arnell and Gosling (2016) 1 GCM: HadCM3 SRES A1B Water balance model
Mac-PDM.09
Dependent on sub-region
Dankers et al. (2014) 5 GCMs RCP8.5 9 global water balance models
(from WaterMIP)
Dependent on sub-region
Prudhomme et al. (2014) 5 GCMs RCP2.6, 8.5 9 global water balance models
Hirabayashi et al. (2013) 11 GCMS RCPs global river routing model with
inundation scheme
Dependent on sub-region
frequency of breaching the dissolved oxygen threshold of
4 mg l−1 increased from 49 to 99 %; the frequency of
exceeding the ammonium threshold of 4 mg l−1 increased
from 45 to 79 %. The effect of changes in peak rainfall intensity was found to be an order of magnitude lower.
Climate-driven changes in large-scale atmospheric
cir-culation and related wind fields may cause significant
changes in the amount and type of sediment on catchment surfaces available for wash-off into urban drainage systems. Higher deposition during prolonged dry periods will increase pollution concentrations in first flushes. This will
lead to higher pollution loads in sewer overflows and in
inflow to wastewater treatment plants; the latter leading to higher solids loads to clarifiers, different treatment effi cien-cies and higher pollution loads. Downstream of the treatment plants, receiving rivers during long dry spells in future summers may have reduced capacity to assimilate the more concentrated effluent. Prolonged dilute loading of wastewa-ter treatment plants due to low-intensity long-duration pre-cipitation events can also affect wastewater treatment with potential for major impacts on overall treatment (Plosz et al. 2009).
Changes other than those related to climate may also occur in urban areas and affect or strengthen urban drainage impacts. For example, changes in pavement surfaces, and these should not be seen in isolation but as related to pop-ulation growth and increase in welfare, and thus partly
interrelated with anthropogenic climate change.
Semadeni-Davies et al. (2008) analysed the combined
impact of climate change and increased urbanisation in Helsingborg, Sweden, and found that this could result in a
four-fold increase in sewer overflow volumes. Using a
similar approach, Olsson et al. (2010) analysed future loads on the main combined sewer system in Stockholm, Sweden, due to climate change and population increase. They esti-mated annual total inflow to the treatment plant to increase by 15–20 %, sewer overflow volumes to increase by 5–10 % and critically high water levels to increase by 10–20 % in thefirst half of the century. For the latter half of the century, they found no further increase in total inflow, but a 20–40 % increase in sewer overflow volumes and a 30–40 % increase in high water levels (within the sewer system). Both studies highlighted the importance of addressing climate change impacts in combination with other key non-stationary drivers of equal importance (e.g. urbanisation trends, sewer system or management changes). In fact, the study by Semadeni-Davies et al. (2008) clearly showed that climate change is not the most important driver of increased pollution levels, and that increases in damage may be effectively counter-balanced by measures not solely related to urban drainage.
Tait et al. (2008) confirmed that increased urbanisation (related to increased population and economic growth) also had a significant impact on urban runoff. For a typical urban
area in the UK, in addition to climate change they assumed that paved areas would increase by about 25 % of their current value and roof areas by about 10 %. Model simu-lations showed that sewer overflow volumes would increase by about 15–20 % when only the increase in paved areas is considered. These changes are comparable to those expected from climate change.
Climatic variability at multi-decadal time scales has been detected by several authors (Stahl et al. 2010, 2012; Han-naford et al.2012; Boéand Habets2013; Willems2013b). This must also be considered, given that it could temporarily limit, reverse or even increase the long-term impacts of climate change (Boéand Habets2013).
7.4
Conclusion
Hydrological extremes are projected to become more intense. These changes are largely driven by changes in precipitation, which RCM rainfall projections for the North
Sea region suggest will become significantly more intense
(see Chap. 5; Van der Linden and Mitchell 2009). Future
winters are expected to see both an increase in the volume and intensity of precipitation. The intensity of summer extremes may also increase albeit with a reduction in overall
volume. These findings are consistent with recent
observa-tions at some monitoring staobserva-tions that show winter extremes in high riverflow are already increasing (see Chap.4).
Quantifying future changes in hydrology is difficult. This reflects the high uncertainties in model output: mainly due to uncertainties in the climate processes, and—to a lesser extent
—in knowledge of the hydrological processes and their
schematisation in hydrological impact models. The impact uncertainties also reflect the level of uncertainties in future greenhouse gas emissions and concentrations.
Taking the uncertainties into account, the reported over-view of impact results for rivers in the North Sea region in Table7.2, indicates increases in river peakflow by 2100 of up to +30 % for many rivers and even higher for some. An increase in river peakflows is more evident for the northern basins of the North Sea region. The greatest increases are projected for catchments in south-western Norway, up to
+70 % for 200-year peak flows. In snow-dominated
catch-ments of Norway and southern Sweden, earlier spring
flooding is projected. These spring floods do not always
increase, however, peakflows from snowmelt may decrease
when higher spring temperatures lead to reduced snow
storage. Decreasing snowmelt-induced spring flow, and
increased rain-fed flow in winter and autumn may change
the seasonality of peakflows andfloods. In northern France and Belgium, an increase in river peakflow is less clear in that not all models project an increase. Hence, the spatial differences mainly occur in a north-south direction. The
position of a river basin relative to the ocean is also important. Allan et al. (2005) found that the greater the proximity the greater the potential damping of any climate change effect.
The impacts of climate change on sewer flood and
overflow frequencies and volumes vary widely. The
specific characteristics of an urban drainage system will
dictate whether the net result of the projected increase in, for example, short-duration rainfall extremes is to damp or
amplify these changes in precipitation. The precise
amplitude of response is highly uncertain and non-linear. The combined impact of climate change and increased urbanisation in some parts of the North Sea region could result in as much as a four-fold increase in sewer overflow volumes.
Open Access This chapter is distributed under the terms of the Crea-tive Commons Attribution 4.0 International License (http:// creativecommons.org/licenses/by/4.0/), which permits use, duplica-tion, adaptaduplica-tion, distribution and reproduction in any medium or for-mat, as long as you give appropriate credit to the original author(s) and the source, provide a link to the Creative Commons license and indicate if changes were made.
The images or other third party material in this chapter are included in the work’s Creative Commons license, unless indicated otherwise in the credit line; if such material is not included in the work’s Creative Commons license and the respective action is not permitted by statutory regulation, users will need to obtain permission from the license holder to duplicate, adapt or reproduce the material.
References
Abdellatif M, Atherton W, Alkhaddar R, Osman Y (2014) Application of the UKCP09 WG outputs to assess performance of combined sewers system in a changing climate. J Hyd Eng, doi:10.1061/ (ASCE)HE.1943-5584.0001129
Allan JD, Palmer MA, Poff NL (2005) Climate change and freshwater ecosystems. In: Climate Change and Biodiversity. Yale University Press
Andersen HE, Kronvang B, Larsen SE, Hoffmann CC, Jensen TS, Rasmussen EK (2006) Climate-change impacts on hydrology and nutrients in a Danish lowland river basin. Sci Total Environ 65:223–237 Andréasson J, Bergström S, Gardelin M, German J, Gustavsson H, Hallberg K, Rosberg J (2011) Dimensionerande flöden för dammanläggningar för ett klimat i förändring - metodutveckling och scenarier [Design floods for dams in a changing climate – methods and scenarios]. Elforsk rapport 11:25, Stockholm Arnbjerg-Nielsen K (2012) Quantification of climate change effects on
extreme precipitation used for high resolution hydrologic design. Urban Water J 9:57–65
Arnbjerg-Nielsen K, Fleischer HS (2009) Feasible adaptation strategies for increased risk offlooding in cities due to climate change. Water Sci Technol 60:273–281
Arnbjerg-Nielsen K, Willems P, Olsson J, Beecham S, Pathirana A, Bülow Gregersen I, Madsen H, Nguyen VTV (2013) Impacts of climate change on rainfall extremes and urban drainage systems: a review. Water Sci Technol 68:16–28
Arnell NW (2011) Uncertainty in the relationship between climate forcing and hydrological response in UK catchments. Hyd Earth Sys Sci 15:897–912
Arnell NW, Gosling SN (2016) The impacts of climate change on river flood risk at the global scale. Climatic Change 134(3):387–401 Ashley RM, Clemens FHLR, Tait SJ, Schellart A (2008) Climate
change and the implications for modeling the quality offlow in combined sewers. Proceedings of the 11th International Conference on Urban Drainage, 31 August - 5 September 2008, Edinburgh, Scotland
Astaraie-Imani M, Kapelan Z, Fu G, Butler D (2012) Assessing the combined effects of urbanisation and climate change on the river water quality in an integrated urban wastewater system in the UK. J Environ Manage 112:1–9
Bastola S, Murphy C, Sweeney J (2011) The sensitivity offluvialflood risk in Irish catchments to the range of IPCC AR4 climate change scenarios. Sci Total Environ 409:5403–5415.
Bates BC, Kundzewicz ZW, Wu S, Palutikof JP (eds) (2008) Climate change and water. Technical Paper of the Intergovernmental Panel on Climate Change, IPCC Secretariat, Geneva
Bell VA, Kay AL, Cole SJ, Jones RG, Moore RJ, Reynard NS (2012) How might climate change affect river flows across the Thames Basin? An area-wide analysis using the UKCP09 Regional Climate Model ensemble. J Hydrol 442-443:89–104
BoéJ, Habets F (2013) Multi-decadal riverflows variations in France. Hydrol Earth Syst Sc Disc 10:11861–11900
Boé J, Terray L, Martin E, Habets F (2009) Projected changes in components of the hydrological cycle in French river basins during the 21st century. Water Resour Res 45:W08426 doi:10.1029/ 2008WR007437
Boukhris O, Willems P, Vanneuville W (2008) The impact of climate change on the hydrology in highly urbanized Belgian areas. Proceedings International Conference on‘Water & Urban Devel-opment Paradigms: Towards an integration of engineering, design and management approaches’, Leuven, 15-17 September
Brisson E, Demuzere M, Willems P, van Lipzig N (2015) Assessment of natural climate variability using a weather generator. Clim Dynam 44:495–508
Brouyére S, Carabin G, Dassargues A (2004) Climate change impacts on groundwater resources: modelled deficits in a chalky aquifer, Geer basin, Belgium. Hydrogeol J 12:123–134
Cameron (2006) An application of the UKCIP02 climate change scenarios toflood estimation by continuous simulation for a gauged catchment in the northeast of Scotland, UK (with uncertainty). J Hydrol 328:212–226
Charlton MB, Arnell NW (2011) Adapting to climate change impacts on water resources in England - An assessment of draft Water Resources Management Plans. Global Environ Chang 21:238–248 Christierson BV, Vidal JP, Wade SD (2012) Using UKCP09 proba-bilistic climate information for UK water resource planning. J Hydrol 424-425:48–67
Chun KP, Wheater HS, Onof CJ (2009) Streamflow estimation for six UK catchments under future climate scenarios. Hydrol Res 40:96– 112
Cloke HL, Jeffers C, Wetterhall F, Byrne T, Lowe J, Pappenberger F (2010) Climate impacts on riverflow: projections for the Medway catchment, UK, with UKCP09 and CATCHMOD. Hydrol Process 24:3476–3489
Collins M (2007) Ensembles and probabilities: a new era in the prediction of climate change. Phil Trans R Soc A 365:1957–1970 Dams J, Salvadore E, Van Daele T, Ntegeka V, Willems P, Batelaan O
(2012) Spatio-temporal impact of climate change on the ground-water system. Hydrol Earth Syst Sc 16:1517–1531