THE CENTRE FOR MARKET AND PUBLIC ORGANISATION
Centre for Market and Public Organisation Bristol Institute of Public Affairs
University of Bristol 2 Priory Road Bristol BS8 1TX http://www.bristol.ac.uk/cmpo/ Tel: (0117) 33 10799 Fax: (0117) 33 10705
E‐mail: cmpo‐office@bristol.ac.uk
The Centre for Market and Public Organisation (CMPO) is a leading research centre, combining expertise in economics, geography and law. Our objective is to study the intersection between the public and private sectors of the economy, and in particular to understand the right way to organise and deliver public services. The Centre aims to develop research, contribute to the public debate and inform policy‐making.
CMPO, now an ESRC Research Centre was established in 1998 with two large grants from The Leverhulme Trust. In 2004 we were awarded ESRC Research Centre status, and CMPO now combines core funding from both the ESRC and the Trust.
ISSN 1473‐625X
Is
there
an
Income
Gradient
in
Child
Health?
It
depends
whom
you
ask
David
W.
Johnston,
Carol
Propper,
Stephen
E.
Pudney
and
Michael
A.
Shields
March 2010
Working Paper No. 10/232
Published as
IZA Discussion Paper no. 4830 (March 2010) Published as
CMPO Working Paper Series No. 10/232
Is there an Income Gradient in Child Health?
It depends whom you ask
David W. Johnston
1,Carol Propper
2,Stephen E. Pudney
3and
Michael A. Shields
41
Queensland University of Technology, Brisbane, Australia
2
Imperial College London, CMPO University of Bristol and CEPR
3
University of Essex
4
University of Melbourne, Melbourne, Australia
March 2010
Abstract
A large literature uses parental evaluations of child health status to provide evidence on the socioeconomic determinants of health. If how parents perceive health questions differs by income or education level, then estimates of the socioeconomic gradient are likely to be biased and potentially misleading. In this paper we examine this issue. We directly compare child mental health evaluations from parents, teachers, children and psychiatrists for mental health problems, test whether these differences are systematically related to observable child and parent characteristics, and examine the implications of the different reports for the estimated income gradient. We find that respondents frequently evaluate children differently and while the sign of the income gradient is in the same direction across respondents, systematic differences in evaluations mean that the estimated magnitude and significance of the health-income gradient is highly dependent upon the choice of respondent and the measure of child health.
Keywords: Child Health, Income, Reporting Bias JEL Classification: I12, J13
Electronic version: www.bristol.ac.uk/cmpo/publications/papers/2010/wp232.pdf
Acknowledgement: This research has been funded by the ESRC project "An Examination of the impact of Family Socio-economic status on outcomes in late childhood and adolescence" (RES-060-23-0011).
Address for Correspondence
CMPO, Bristol Institute of Public Affairs University of Bristol 2 Priory Road Bristol BS8 1TX Carol.Propper@bristol.ac.uk www.bristol.ac.uk/cmpo/
I.
Introduction
There is a substantial literature that uses self-reported measures of health status to provide evidence on the socioeconomic determinants of health status and population inequalities in health. A relatively new line of research in health economics has focused on relationship between parental income and the health of their children, known as the health gradient (Case et al., 2002; Currie and Stabile, 2003; Currie et al., 2007; Propper et al., 2007; Condliffe and Link; 2008; Currie et al., 2008; Murasko, 2008; Khanam et al., 2009). The vast majority of studies find that such a gradient exists, both between parental income and child health and also between adult income and adult health. However, the size of the gradient differs by country and study, and the actual mechanisms linking income to health are still under debate.
Most of this literature uses self-reported or, for children, parent- (mostly mother-) reported measures of health. There are concerns about the extent to which self-reported measures of health status can be confirmed by more objective or clinical measures of health and about the degree of heterogeneity in the way that individuals perceive and respond to survey questions about their own health. There is very limited evidence on the correspondence between self-reported health and medical records but, in one of the few studies, Baker et al. (2004) found evidence of substantial reporting error, leading to large attenuation biases in estimates of the impact of health status on labour market activity when self-reports are used as explanatory variables. If individuals with different incomes and socioeconomic backgrounds perceive such questions in different ways, then it is likely that estimates of the income gradient will also be biased and there has been work supporting this view for self-reports of adult health status (Butler et al., 1987; Mackenbach et al., 1996; Lindeboom and van Doorslaer, 2004; Etilé and Milcent, 2006; Bago d’Uva et al., 2007; Jones and Wildman, 2008; Johnston et al., 2009).
There is even less in the health economics literature on parental reporting bias of children’s health. In particular, little is known about how parental responses differ from those of other observers, especially doctors and teachers, or of the children themselves. Consequently, we know little about the sensitivity of the empirical income gradient in child health outcomes to the identity of the provider of health reports.1 This is despite the existence of a consensus in the psychology and medical literatures that there are large disagreements between informants in their assessment of children’s psychological and physical well-being. For example, there is strong evidence that mothers and fathers rate their child’s health differently, with mothers generally reporting more symptoms than do fathers (Ivens and
1 In one of the few exceptions, Currie and Stabile (2006) examine ADHD in children and find the correlation between parent and teacher assessment of child hyperactivity in Canadian data was only 0.46, and that about 50% of children received a hyperactivity score (on a 0-16 range) of two or less from teachers compared to a median score of 4 from parents.
Rehm, 1998). Achenbach et al. (1987) found from a meta-analysis of 119 studies that the average correspondence in terms of child and adolescent behavioural/emotional problem between parents was 0.60 (mother and fathers), and only 0.28 between parents and teachers. Brown et al. (2007) found for a sample of US children aged 5-10 years that parents failed to detect half of school-aged children considered to be seriously disturbed (in terms of emotions, behaviours and functional impairment) by their teachers. Youngstrom et al. (2003) found that prevalence rates of comorbidity in a clinical sample range from 5.4% to 74.1%, depending whether ratings from parent, teacher, child or some combination are used to classify the child. Disagreement is also found in samples of informants from divergent ethnic and cultural backgrounds, and in community and clinical samples and there is a debate about the extent to which mothers suffering from depression, or with a psychiatric history, have distorted perceptions of their children’s problems (Richters and Pellegrini, 1989; Richters, 1992; Chilcoat and Breslau, 1997; Duhig et al. 2000; Eiser and Morse 2001; Kraemer et al. 2003).
Several reasons have been suggested for the disagreements between observers. Children may manifest symptoms differently in different settings (for example, deviant behaviour at school but not at home); informants may have different thresholds or perceptions of what constitutes abnormal behaviour (for instance, teachers interact with more children than parents); and children may deny or minimise socially undesirable symptoms. De Los Reyes and Kazdin (2005) note that, “Although this literature has identified instances in which informant discrepancies may be lesser or greater, depending on the characteristics of either the informants or the child being rated, informant discrepancies generally remain quite high” and that “research has generally failed to explain informant discrepancies”. The disagreement in subjective health assessments implies that relying on one particular informant rather than another, or integrating assessments from multiple informants, can lead to different estimated rates of prevalence and of the socio-economic gradient in child health.
In this paper we address two important issues. First, whether it is possible to identify the existence of (mental) health problems in children on the basis of survey reports from multiple observers; and second, what implications this has for research on the income gradient in child health. We focus on three forms of mental health and behavioural problem: emotional difficulties, conduct disorder and hyperactivity which, in childhood and adolescence, are extremely important for their potential long-term consequences, often exceeding those of physical health conditions (see Currie and Stabile, 2006; Fletcher, 2008; Fletcher and Wolfe, 2008). We observe responses on each type of problem from up to four observers: parents, teachers, children and psychiatrists. The sample is drawn from the two major surveys of the Mental Health of British Children and Adolescents conducted by the Office for National Statistics in 1999 and 2004. Both surveys have detailed questionnaires covering
mental health and behavioural conditions and provide extensive information about parents and children. We focus on children aged 11-15 years, for whom separate questionnaires are completed by a parent, a teacher and the child.
We begin by comparing the responses of parents, teachers and children to questions about the child’s emotional difficulties, conduct disorder and hyperactivity. We then estimate statistical models relating the differences in reports for each pair of observers (parents versus teachers; parents versus children; teachers versus children) to the characteristics of the children, parents and household. This is an extension, in scope, data and empirical methodology, to Goodman et al. (2000) who used data from the first of the two surveys to compare the predictive value of child, parent and teacher responses to the Strength and Difficulties Questionnaire (SDQ).2 We then investigate how the estimated income gradient for each disorder differs between the three informants. We finally use the psychiatrist’s summary assessment (based on the whole range of survey information on the child) to construct an objective measure of health against which the responses of others can be assessed and the gradients based on the different respondents’ assessments can be compared.
Overall, we find substantial differences in indicators of the existence of a mental health condition across respondents. Parents, teachers and children appear to have different evaluation thresholds and often perceive the same child very differently. Teachers report the fewest symptoms, parents report significantly more than teachers, and children evaluate themselves more harshly than both parents and teachers. The correlations between respondents’ scores are low. In terms of the income gradient, parental and teacher scoring of SDQs produce a significant gradient for all three problems and the ranking of the gradients across the three outcomes are the same for the two sets of respondents. In contrast, using children’s own assessments of their mental health would suggest either a much lower (for emotional problems) or no income gradient (for conduct and hyperactivity). Finally, the income gradient using an objective ICD-10 measure constructed by psychiatrists differs from that based on parental, teacher and child assessments. The objective gradient is smaller than the gradient derived from parental reports. But it is larger than the gradient derived from children’s own assessments of their mental health which, with a full set of controls, is zero. We therefore conclude that the existence of both mental health problems and an income gradient in mental health is, to a large extent, in the eye of the beholder.
2 The subjective assessments were compared against diagnoses made by experienced clinicians using detailed information contained within the survey. Goodman et al. found that parents and teachers provide information of roughly equal predictive value, although parents are slightly more useful for detecting emotional disorders and teachers are slightly more useful for detecting conduct and hyperactivity disorders. In addition, self-assessments are found to be less useful, especially for conduct and hyperactivity disorders.
II.
Data
The data we use are drawn from two major surveys of the mental health of British children and adolescents conducted by the UK Office for National Statistics. The 1999 survey contains information on 10,438 children aged between 5 and 15 years, and the 2004 survey contains information on 7,977 children aged between 5 and 16 years. The children were randomly chosen using a stratified sample design (by postcode) from the Child Benefit Register, a database of child benefit records spanning 98% of British children. Information was collected in face-to-face interviews with the child’s primary caregiver (in 94% of cases the child’s mother) and the child itself. Further information on the child was collected by postal questionnaire from the child’s teacher if consent to do so was provided by the parent (97% gave consent), with a completed questionnaire returned by around 80% of teachers. The information collected from each of these sources has been found to be broadly representative of the general population (see Meltzer et al. 2000; Green et al. 2005). Analysis of the 1999 and 2004 survey data by Green et al. (2005) revealed no substantial changes in survey methodology between years and so we pool the two surveys in all of our analyses.
Both the 1999 and 2004 surveys contain child, parent and teacher versions of the Strengths and Difficulties Questionnaire (SDQ), which is a 25-item instrument for assessing social, emotional and behavioral functioning that has become a widely used research instrument for the mental health of children. The SDQ questions cover positive and negative attributes and respondents answer each with a response “Not True” (0), “Somewhat True” (1), or “Certainly True” (2). The SDQ is similar to the Behavior Problems Index (BPI) questionnaire used by Currie and Stabile (2006), with only minor differences in wording.
Answers to the 25 questions are grouped into five scales of five items each, generating scores from 0 to 10 for emotional symptoms, conduct problems, hyperactivity-inattention, peer problems, and prosocial behaviour. In all following analyses we focus exclusively on the SDQ summary scores for emotional symptoms, conduct problems and hyperactivity, and on children aged 11-15 for whom SDQ information was available from parents, teachers and the children themselves. Given our focus on income, we have dropped the (5.4%) of children with missing income information from our estimation sample.3 A list of all the covariates and their mean values are provided in Appendix Table A1. The
3 Gross household income is recorded in the surveys in 21 bands ranging from less than £1,000 to greater than £40,000. Our real income measure is constructed by deflating the midpoints of these bands (to 2001 prices) with the UK average earnings index, giving us a pseudo-continuous measure with 42 possible values (21 bands x 2 years). Throughout the paper we use the natural logarithm of this real income measure.
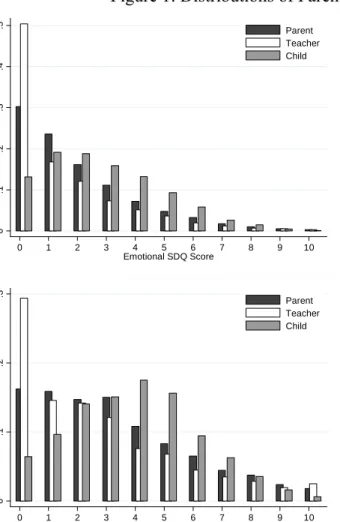
distributions of parent, teacher and child SDQ evaluations of emotional, conduct and hyperactivity problems are shown in Figure 1. A clear pattern in these graphs is the consistent ordering of respondents in terms of severity of rating: teachers report the fewest symptoms (a mean score across conditions of 1.5), parents report significantly more symptoms than teachers (mean score 2.0), and children tend to evaluate themselves most harshly (mean score 2.9). The dissimilarity of parent, teacher and child evaluations is also evident in the pairwise correlations between respondent’s evaluations, shown in Table 1, where cross-respondent correlations are all below 0.5. Note that the hyperactivity parent-teacher correlation (0.48) is similar to that reported by Currie and Stabile (2006) using NLSY BPI data (0.46), suggesting that the disagreement evident in British SDQ data is not atypical.
The dissimilarity in SDQ scores between respondents may arise because respondents use systematically different threshold levels when assessing health, despite observing the same symptoms (as Lindeboom and van Doorslaer (2006) find for adults’ assessments of their own general health). The differences in perception are large: of the 221 children receiving a high teacher emotional SDQ score (≥ 6) only 61 (28%) also receive a high parent emotional SDQ score and only 52 (24%) receive a high child emotional SDQ score. For conduct disorders, parents and children identify only 30% and 26% of the children with high teacher scores, and for hyperactivity disorders the proportions are 47% and 44%. Contained within the two mental health surveys is a further instrument: the Development and Well-Being Assessment (DAWBA). The DAWBA consists of a structured interview administered to parents and older children by lay interviewers who also recorded verbatim accounts of any reported problems. The DAWBA parent and child interviews respectively take around 50 and 30 minutes to complete (Goodman et al., 2000). A shortened version of the DAWBA was also mailed to the child’s teacher. The DAWBA questions are closely related to DSM-IV and ICD-10 diagnostic criteria and focus on a number of disorders: separation anxiety, specific and social phobias, post-traumatic stress disorder, obsessive compulsive disorder, generalised anxiety, depression, hyperkineses/ADHA, and conduct-oppositional disorders. A team of child and adolescent psychiatrists reviewed both the verbatim accounts and the answers to structured questions about any symptoms and their resultant distress and social impairment, before assigning diagnoses using ICD-10 criteria. The verbatim reports were used to check that respondents had understood the questions and to decide which view to prioritise in case of disagreement between respondents; no respondent was automatically prioritised.
To validate the DAWBA assessments, survey administrators recruited a test group of children from three child and adolescent mental health clinics and administered the DAWBA assessment. Goodman et al. (2000) compared the results with the children’s psychiatric clinic notes and found a
93% concordance rate. Given this evidence of close agreement between DAWBA and clinic diagnoses, we treat the DAWBA assessments as a good approximation to a ‘true’ mental health indicator.
The sample prevalence rates of emotional, conduct and hyperkinetic disorders according to the psychiatric assessments are 5.3%, 5.8% and 1.3%. The prevalence rate for hyperkinetic disorder is lower than the ADHD rate of 4-5% reported for the US by Currie and Stabile (2006), largely because the ICD-10 definition of hyperkinetic disorder requires that the child exhibit multiple inattention, hyperactivity and impulsivity symptoms, whereas the DSM-IV ADHD definition requires that the child exhibit only one type of symptom. According to Cameron and Hill (1996), “ADHD therefore defines a milder and broader category and is effectively a syndrome rather than a disorder”.
Simple empirical relationships between SDQ scores and psychiatric diagnoses are presented in Figure 2, which shows that the ability of SDQ scores to predict psychiatrist diagnoses differs substantially between respondents and disorders. In general, parent responses are most strongly related to the probability of a diagnosis, closely followed by teachers and then children. SDQ scores for conduct disorder are most strongly related to the probability of a diagnosis, followed by emotional disorder. Hyperactivity SDQ scores are relatively poor predictors of the diagnosis.
III.
Explaining Differences in Respondents SDQ Scores
We now explore the between-respondent differences in SDQ scores. It is important to determine whether SDQ differences are driven by noisy evaluations or by systematic bias, because they are likely to have quite different implications for the results of empirical analysis. If teachers systematically give unduly pessimistic evaluations to low income children, for example, then estimated income gradients using teacher evaluations are likely to be upward biased. The distributions of differences in SDQ scores between respondent pairs are shown in Figure 3 and demonstrate clear differences between mean scores. Parents tend to give higher scores than teachers, while teachers give lower scores than children. The relatively low variance for parent-teacher differences in conduct scores indicates a greater degree of agreement between respondents, while the high variance for the teacher-child difference in hyperactivity scores indicates low agreement. In general, there is less disagreement between respondents on conduct than on emotional or hyperactivity disorders. This finding is likely to be due to the fact that SDQ questions on conduct refer more to specific behaviours (such as stealing from home, school or elsewhere) than to thoughts or emotions (such as thinking things out before acting), and hence are rather more ‘objective’.
(
)
(
)
, ~ 0, exp i i i i i SDQ X β ε ε N Xα Δ = +where ΔSDQi is the difference between observers in the SDQ scores for child i, Xi represents child and parental characteristics including income, and β and α are coefficients. A positive coefficient for household income for (say) a parent-teacher difference would indicate that richer parents tend to assign their children particularly high scores relative to teachers. A positive αindicates that the variance of the difference increases with income, indicating more consistent agreement between teachers and poor parents than between teachers and wealthy parents.
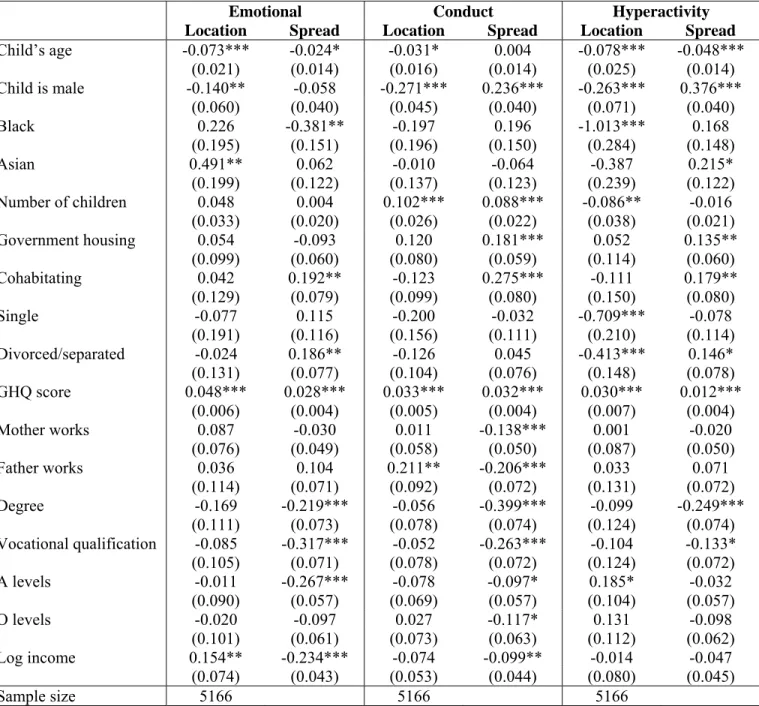
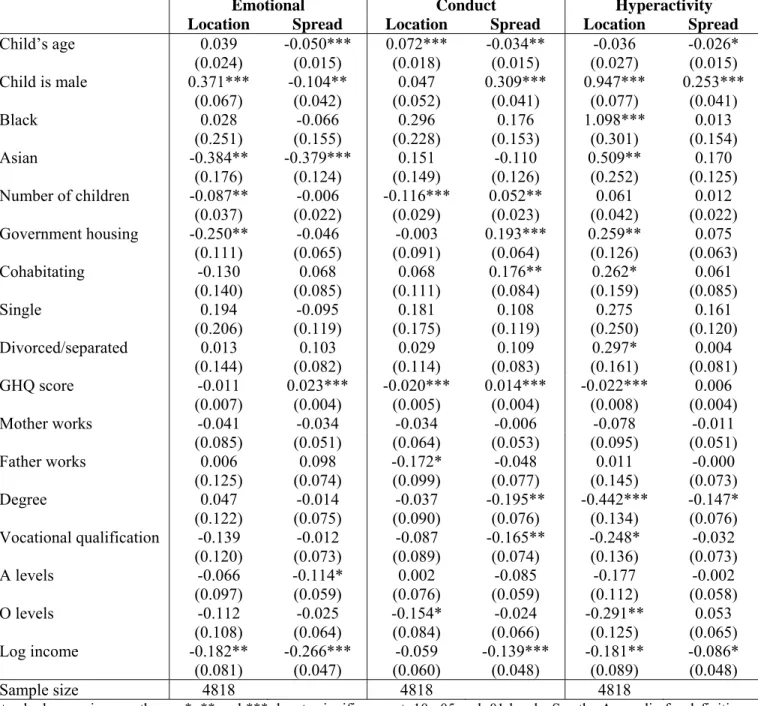
Tables 2, 3 and 4 show estimates of β and α for each of the three pairwise differences and for each of the three health disorders and suggest some general conclusions. First, the behaviour of boys and girls are judged differently by different respondent. Teachers judge boys more harshly than do parents, and parents judge boys more harshly than do boys themselves. The one exception to this is for conduct disorders, where boys rate their own conduct-related behaviour as harshly as their parents and teachers. Second, mother’s mental health, as measured by their GHQ score, is a strong predictor of the mean and variance of all SDQ differences. Mothers with poor mental health rate their children more harshly than either teachers or children themselves, and the magnitude of the disagreement is also much larger (see also Propper et al, 2007). This is not solely the result of mothers with poor mental health making incorrect judgements, as maternal mental health is also a significant predictor of teacher-child differences. Two forces are likely to be at work: mothers with poor mental health may have inflated perceptions of their children’s problems and children with such mothers may also have lower “true” mental health, some of which is not detected by teachers. The third general finding is that the average degree of agreement between parents, teachers and children is higher for children in high socioeconomic status families (as seen by significantly negative heteroskedasticity coefficients for degree-level education and income).
The finding that parental health and parental socioeconomic status are associated with child health evaluations is troubling for the empirical child health literature, since it is likely to lead to bias in estimates of the true impact of these and other related characteristics on child mental health.
IV. Comparing Estimates of the Income Gradient in Child Health
We now examine the differences between estimated regression models of child mental health when evaluations from different respondents are used, with particular focus on the role of income. We first regress the nine SDQ scores on a basic set of covariates, comprising: the child’s age, gender and
ethnicity; the parent’s marital status (cohabitating, single, divorced/separated); log household gross income in 2001 prices; the number of children in the household; an indicator for whether the parental respondent was the mother or father; and a survey year dummy. We then regress the SDQ scores on an expanded set of controls, including parental education (degree, vocational qualification, ‘A’ levels, ‘O’ levels), indicators of parental labour market activity, and parental mental health.4
The estimates of the (log) income gradient from this exercise are presented in Table 5,5 which shows substantial differences between emotional, conduct and hyperactivity disorders. In general, the gradient is reduced by including the controls to include parental education as well as income. Using the extended set of covariates, children from poor households tend to score highest on the hyperactivity scale, followed by the emotional scale and conduct scale. But the importance of income differs between respondents for the same disorder. Income is considerably less important when child SDQ scores are used than when parent or teacher SDQ scores are used. This is especially true for hyperactivity where estimated log income coefficients for child reports of hyperactivity are -0.152 and 0.010, compared with -0.596 and -0.250 for parents, and -0.512 and -0.233 for teachers. Income is generally less important for teacher SDQ scores than for parent SDQ scores, although the differences in this case are less pronounced.
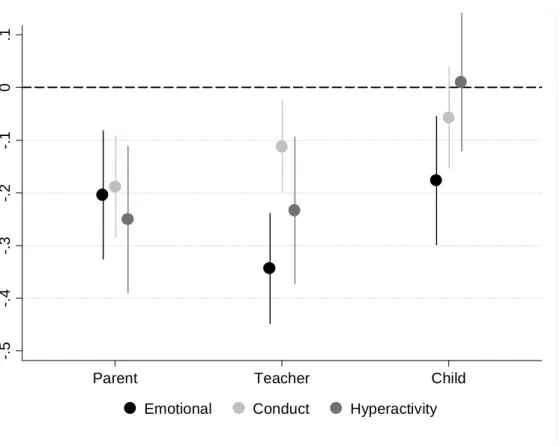
The difference in income gradients between respondents can be partially explained by the estimated effect of the various socioeconomic status (SES) indicators on the SDQ differences, which are shown in Tables 2–4. Log income and having a degree are negatively associated with the mean and variance of the differences, suggesting that, relative to parents, high SES children persistently rate themselves more harshly than their parents and teachers. This association acts to flatten the estimated income gradient for child SDQ scores relative to parent and teacher SDQ scores, which is exactly what we observe in Table 5. Figure 4 summarises the results. Analysis of children’s self-reports always gives the smallest gradient, with a significant gradient only for emotional disorder. While the income gradients from teacher and parent responses are closer, there is a greater range of results for teachers, whose gradient for emotional difficulties is significantly larger than that for conduct problems, whereas the income gradients from parental assessments are similar across the three types of disorder.
This analysis has the limitation that there is no ‘true’ gradient against which to compare the results. However, as discussed in Section II, our data contain psychiatrists’ ICD-10 diagnoses of
4 The basic and extended set are those controls which are used widely in the economic analyses of the income gradient. 5 Estimated coefficients for the other covariates are not shown, but are generally as expected: boys are less likely to have emotional problems, slightly more likely to have conduct problems and much more likely to have hyperactivity problems; children with more highly educated parents have fewer problems; children with cohabitating, divorced/separated and single
emotional, conduct and hyperkinetic disorders, which are expected to provide a much more impartial and accurate evaluation of child mental health. These are binary measures, so to compare evidence from the parent, teacher and child reports with these ICD-10 diagnoses, we first construct mental health problem indicators for each of the three types of problem from the SDQ scores by applying age- and gender-specific cut-off values that give prevalence rates approximately equal to the corresponding age- and gender-specific prevalence rates for the ICD-10 diagnoses. From direct questions asked to parents as to whether their child has hyperactivity, behavioural problems and emotional problems, to which they can answer “yes” or “no”, we form a further set of binary indictors. This type of binary response from parents (i.e. does your child have such a condition) is commonly used in the literature for childhood chronic health conditions.
For ease of comparison we estimate linear regressions of each mental illness indicator on income and a basic and expanded set of controls. The resulting income gradient estimates are shown in Table 6.6 Using the basic set of covariates, the ICD-10 assessments by psychiatrists suggest an income gradient in emotional and conduct disorder but much less of one in hyperactivity. However, the extended controls model yields a significant gradient only for emotional disorder.
The direct parental reports of whether their child has a problem provide poor gradient estimates compared to those from psychiatrists, especially when using the more detailed set of controls. Comparison of the income gradient from the binary SDQ indicators suggest that teacher SDQ indicators show gradients which are closest to the ‘true’ income gradient, with some consistent mild over-estimation. Parental indicators from the SDQ scores suggest that a gradient exists only for conduct disorders. Indicators from the child SDQ scores results in income gradient estimates that are most different from the objective diagnoses, are consistently smaller and, when the full set of controls are used, show no income gradient in any of the three aspects of behaviour.
The finding that teachers provide the most reliable evaluations is perhaps surprising, given that they are not able to observe their students’ behaviour in non-school settings. However, as Currie and Stabile (2006) suggest, teachers’ judgements may be more objective and less contaminated by family-specific unobserved characteristics. The findings for children’s scores compared to the objective ICD-10 assessments suggest that using self-assessments by children of this age to examine the income gradient will give unreliable results.
parents have more problems than children with married parents; and South Asian children have fewer problems than white and Afro-Caribbean children.
VI. Conclusions
There is a large inter-disciplinary literature on the important policy-related issue of the socioeconomic correlates and determinants of health. The literature is largely based on subjective evaluations of health status by survey respondents, and in the case of child health this assessment most often comes from mothers. A potential problem with self-reported health measures is that they may contain reporting error, which could lead to different estimated rates of prevalence of child health conditions and of the socio-economic gradient in child health. In the context of family income and child health, it is likely that children will manifest symptoms differently in different settings, informants may have different thresholds or perceptions of what constitutes abnormal health or behaviour and children may deny or minimise socially undesirable symptoms. Moreover, the reporting error may be related to key socioeconomic characteristics including income, and parental education and health.
This paper provides direct evidence on the extent to which reporting errors in self-reported child health are related to parental and household socioeconomic characteristics and establishes the implications for estimates of the income gradient. Using the British Child Mental Health Survey we compare survey responses from parents, teachers, children and psychiatrists on the most common child mental health conditions: emotional difficulties, conduct disorder and hyperactivity. These disorders are estimated to be more burdensome than any other category of child or adolescent health conditions, and have been found in a number of studies to considerably diminish human capital accumulation, leading to lifelong consequences for employment opportunities and income.
Overall, we find substantial differences in indicators of the existence of a mental health condition across the four types of respondent. Teachers report the fewest symptoms, parents report significantly more than teachers, and children evaluate themselves more harshly than both parents and teachers. The correlations between respondent SDQ scores are low, with all cross-respondent correlations less than 0.5. Parent, teacher and child evaluations often identify different children as those with mental health problems. For example, among the children with a high teacher-evaluated SDQ score for emotional or conduct disorder, the overlap with the sets of children identified by high parental and child SDQ reports does not exceed 30%; for hyperactive disorder, the overlap is higher, but still well below 50%. Parents, teachers and children appear to have different evaluation thresholds and often perceive the same child very differently.
We find that the differences between respondents’ evaluations are strongly related to mothers’ mental health. Mothers with indications of poor mental health rate their children more harshly than either teachers or the children themselves, and the magnitude of the disagreement between respondents
is also much larger. Importantly, the average agreement between parents, teachers and children is higher for children in high socioeconomic status families. These systematic differences in evaluations mean that estimated health-income gradients differ substantially between respondents. Using raw SDQ scores, we find broadly similar evidence of a significant income gradient for emotional, conduct and hyperactivity disorders using either parents’ or teachers’ assessments, whereas analysis of children’s self-assessments suggests that an income gradient exists only for emotional difficulties. When the SDQ scores are used to generate a sharp problematic/non-problematic diagnosis for each child or when the parent is asked directly whether a problem exists, the picture looks quite different. Psychiatric assessments indicate a significant income gradient only for emotional disorder, while teachers’ diagnoses indicate gradients in both emotional and conduct disorders. Parental diagnoses suggest that a gradient exists only for conduct disorders, while children’s self assessments generate no significant evidence of any income gradient.
Our findings for the income gradient underline the need for care in interpreting research findings from many widely-used datasets which ask mothers or teachers to rate children and that asking children themselves - even those in late childhood – may be problematic. Finally, our findings point to the value of using surveys like those used here, which collect data observed from multiple viewpoints, including professional evaluations of health status.
References
Achenbach, TM., McConaughy, SH. and Howell, CT. (1987). Child/adolescent behavioral and emotional problems: Implications of cross-informant correlations for situational specificity.
Psychological Bulletin, 101, pp. 213–232.
Bago d’Uva, T., van Doorslaer, E., Lindeboom, M. and O’Donnell, O. (2007). Does reporting heterogeneity bias the measurement of health disparities? Health Economics, 17, pp. 351-375. Baker PC., Keck CK., Mott FL. and Quinlan SV. (1993). NLSY Child Handbook. Center for Human
Resource Research, Ohio State University.
Baker, M., Stabile, M., Deri, C. (2004). What do self-reported objective measures of health measure?
Journal of Human Resources, 39, pp. 1067–1093.
Brown, JD., Wissow, LS. And Gadomski, A. (2006). Parent and teacher mental health ratings of children using primary care services: Inter-rater agreement and implications for mental health screening. Academic Pediatrics, 6, pp. 347-351.
Butler, J., Burkhauser, RV., Mitchell, JM. and Pincus, TP. (1987). Measurement error in self-reported health variables. Review of Economics and Statistics, 69, pp. 644-650.
Cameron, M., and Hill, P. (1996). Hyperkinetic disorder: Assessment and treatment. Advances in Psychiatric Treatment, 2, pp.9 4-102.
Case, A., Lubotsky, D. and Paxson, C. (2002). Economic status and health in childhood: The origin of the gradient. American Economic Review, 92, pp. 1308-1334.
Chilcoat, HD. And Breslau, N. (1997). Does psychiatric history bias mothers' reports? An application of a new analytic approach. Journal of the American Academy of Child & Adolescent Psychiatry, 36, pp. 971-979.
Condliffe, S. and Link, C. (2008). The relationship between economic status and child health: Evidence from the United States. American Economic Review, 98, pp. 1605-1618.
Currie, A., Shields, MA. and Wheatley Price, S. (2007). The child health/family income gradient: Evidence from England. Journal of Health Economics, 26, pp. 213-232.
Currie, J. and Stabile, M. (2003). Socioeconomic status and child health: Why is the relationship stronger for older children? American Economic Review, vol. 93, pp. 1813-1823.
Currie, J. and Stabile, M. (2006). Child mental health and human capital accumulation: The case of ADHD. Journal of Health Economics, 25, pp. 1094-1118.
Currie, J., Decker, S. and Lin, W. (2008). Has public health insurance for older children reduced disparities in access to care and health outcomes. Journal of Health Economics, 27, pp. 1567-1581.
De Los Reyes, A. and Kazdin, AE. (2005). Informant discrepancies in the assessment of childhood psychopathology: A critical review, theoretical framework, and recommendations for further study. Psychological Bulletin, 131, pp. 483-509
Duhig, AM., Renk, K., Epstein, MK. and Phares, V. (2000). Interparental agreement on internalizing, externalizing, and total behavior problems: A meta-analysis. Clinical Psychology: Science and Practice,7, pp. 435-453.
Eiser, C. and Morse, R. (2001). Can parents rate their child’s health-related quality of life? Results of a systematic review. Quality of Life Research, 10, pp. 347-357.
Etilé, F. and Milcent, C. (2006). Income-related reporting heterogeneity in self-assessed health: Evidence from France. Health Economics, 15, pp. 965-981.
Fletcher, JM. (2008). Adolescent depression: Diagnosis, treatment, and educational attainment. Health Economics, 17, pp. 1215-1236.
Fletcher, JM. and Wolfe, BL. (2008). Child mental health and human capital accumulation: The case of ADHD revisited. Journal of Health Economics, 27, pp. 794-800.
Goodman, R., Ford, T., Simmons, H., Gatward, R. and Meltzer, H. (2000). Using the Strengths and Difficulties Questionnaire (SDQ) to screen for child psychiatric disorders in a community sample. British Journal of Psychiatry,177, pp. 534–539.
Green, H., McGinnity, A., Meltzer, H., Ford, T. and Goodman, R. (2005). Mental Health of Children and Young People in Britain, 2004. Basingstoke: Palgrave MacMillan.
Ivens, C. and Rehm, LP. (1998). Assessment of childhood depression: Correspondence between reports by child, mother, and father. Journal of the American Academy of Child and Adolescent Psychiatry, 27, pp. 738-741.
Johnston, DW., Propper, C. and Shields, MA. (2009). Comparing subjective and objective measures of health: Evidence from hypertension for the income/health gradient. Journal of Health Economics, 28, pp. 540-552.
Jones, AM. and Wildman, J. (2008). Health, income and relative deprivation: Evidence from the BHPS. Journal of Health Economics, 27, pp. 308-324.
Kapteyn, A., Smith, JP. and van Soest, A. (2007). Vignettes and self-reports of work disability in the U.S. and the Netherlands. American Economic Review, 97, pp 461-473.
Khanam, R., Nghiem, HS. and Connelly, LB. (2009). Child health and the income gradient: Evidence from Australia. Journal of Health Economics, 28, pp. 805-817.
Kraemer, HC., Measelle, JR., Essex, MJ., Boyce, WT. and Kupfer, DJ. (2003). A new approach to integrating data from multiple informants in psychiatric assessment and research: Mixing and matching contexts and perspectives. American Journal of Psychiatry, 160, pp. 1566-1577.
Lindeboom M and van Doorslaer, E. (2004). Cut point shifts and index shift in self-reported health.
Journal of Health Economics, 23, pp. 1083-1099.
Mackenbach, JP., Looman, CWN. and van der Meer, JBW. (1996). Differences in the misreporting of chronic conditions, by level of education: The effect of inequalities in prevalence rates.
American Journal of Public Health, 86, pp. 706-711.
Meltzer, H., Gatward, R., Goodman, R. et al. (2000). Mental health of Children and Adolescents in Great Britain. London: Stationery Office.
Murasko, J. (2008). An evaluation of the age-profile in the relationship between household income and health of children in the United States. Journal of Health Economics, 27, pp. 1489-1502.
Offord, DR., Boyle, MH., Racine, Y., Szatmari, P., Fleming, JE., Sanford, M, et al. (1996). Integrating assessment data from multiple informants. Journal of the American Academy of Child & Adolescent Psychiatry, 35, pp. 1078–1085.
Propper, C., Rigg, J. and Burgess, S. (2007). Child health: Evidence on the roles of family income and maternal mental health from a UK birth cohort. Health Economics, 16, pp. 1245-1269.
Richters, JE. and Pellegrini, D. (1989). Depressed mothers' judgments about their children: An examination of the depression-distortion hypothesis. Child Development, 60, pp. 1068-1075. Richters, JE. (1992). Depressed mothers as informants about their children: A critical review of the
evidence for distortion. Psychological Bulletin, 112, pp. 485-499.
Youngstrom, E., Findling, RL. and Calabrese, JR. (2003). Who are the comorbid adolescents? Agreement between psychiatric diagnosis, youth, parent, and teacher report. Journal of Abnormal Child Psychology,31, pp. 231–245.
Figure 1: Distributions of Parent, Teacher and Child SDQ Scores 0 .1 .2 .3 .4 .5 P e rc en ta ge 0 1 2 3 4 5 6 7 8 9 10 Emotional SDQ Score Parent Teacher Child 0 .2 .4 .6 P e rc en ta ge 0 1 2 3 4 5 6 7 8 9 10 Conduct SDQ Score Parent Teacher Child 0 .1 .2 .3 P e rc en ta ge 0 1 2 3 4 5 6 7 8 9 10 Hyperactivity SDQ Score Parent Teacher Child
Figure 2: Raw Relationship between SDQ Scores and Psychologist’s ICD10 Diagnosis 0 .2 .4 .6 .8 1 P ropo rt ion w it h IC D 10 D ia gno s is 0 2 4 6 8 10 Emotional SDQ Score Parent Teacher Child Overall proportion = 5.1% 0 .2 .4 .6 .8 1 P ropo rt ion w it h IC D 10 D ia gno s is 0 2 4 6 8 10 Conduct SDQ Score Parent Teacher Child Overall proportion = 5.9% 0 .2 .4 .6 .8 1 P rop or ti o n w it h I C D 10 D ia gno s is 0 2 4 6 8 10 Hyperactivity SDQ Score Parent Teacher Child Overall proportion = 1.3%
Figure 3: Differences in Raw SDQ Scores between Parents, Teachers and Children 0 10 20 30 -10 -5 0 5 10
Parent minus Teacher Emotional SDQ 0 10 20 30 -10 -5 0 5 10
Parent minus Teacher Conduct SDQ 0 10 20 30 -10 -5 0 5 10
Parent minus Teacher Hyperactivity SDQ 0 10 20 30 -10 -5 0 5 10
Parent minus Child Emotional SDQ 0 10 20 30 -10 -5 0 5 10
Parent minus Child Conduct SDQ 0 10 20 30 -10 -5 0 5 10
Parent minus Child Hyperactivity SDQ 0 10 20 30 -10 -5 0 5 10
Teacher minus Child Emotional SDQ 0 10 20 30 -10 -5 0 5 10
Teacher minus Child Conduct SDQ 0 10 20 30 -10 -5 0 5 10
Teacher minus Child Hyperactivity SDQ
Figure 4: Estimated Effects of Log Household Income on SDQ Scores (model with expanded set of covariates)
__ __ __ __ ___ __ _ __ __ __ __ _ __ _ _ _ __ __ __ ___ __ _ __ __ __ __ ___ __ __ __ __ __ __ __ __ _ _ ___ __ __ __ __ ___ __ __ _ __ __ _ _ __ ___ __ __ _ ____ _ _ __ ___ __ __ .1 0 -. 1 -. 2 -. 3 -. 4 -. 5 E s ti m a te d In c o m e Gr a d ie n t
Parent Teacher Child
Table1: Correlations between Parent, Teacher and Child SDQ Scores
Emotional Conduct Hyperactive
Parent Teacher Child Parent Teacher Child Parent Teacher Child
Parent 1 - - - Teacher 0.287 1 - - - Emotional Child 0.382 0.222 1 - - - Parent 0.343 0.168 0.162 1 - - - Teacher 0.102 0.271 0.062 0.395 1 - - - - Conduct Child 0.207 0.119 0.334 0.458 0.314 1 - - - Parent 0.308 0.183 0.137 0.516 0.350 0.385 1 - - Teacher 0.095 0.273 0.055 0.351 0.648 0.319 0.484 1 - Hyperactive Child 0.160 0.131 0.319 0.284 0.242 0.520 0.419 0.331 1
Table 2: Parent-Teacher Differences in SDQ scores
Emotional Conduct Hyperactivity
Location Spread Location Spread Location Spread
Child’s age -0.073*** -0.024* -0.031* 0.004 -0.078*** -0.048*** (0.021) (0.014) (0.016) (0.014) (0.025) (0.014) Child is male -0.140** -0.058 -0.271*** 0.236*** -0.263*** 0.376*** (0.060) (0.040) (0.045) (0.040) (0.071) (0.040) Black 0.226 -0.381** -0.197 0.196 -1.013*** 0.168 (0.195) (0.151) (0.196) (0.150) (0.284) (0.148) Asian 0.491** 0.062 -0.010 -0.064 -0.387 0.215* (0.199) (0.122) (0.137) (0.123) (0.239) (0.122) Number of children 0.048 0.004 0.102*** 0.088*** -0.086** -0.016 (0.033) (0.020) (0.026) (0.022) (0.038) (0.021) Government housing 0.054 -0.093 0.120 0.181*** 0.052 0.135** (0.099) (0.060) (0.080) (0.059) (0.114) (0.060) Cohabitating 0.042 0.192** -0.123 0.275*** -0.111 0.179** (0.129) (0.079) (0.099) (0.080) (0.150) (0.080) Single -0.077 0.115 -0.200 -0.032 -0.709*** -0.078 (0.191) (0.116) (0.156) (0.111) (0.210) (0.114) Divorced/separated -0.024 0.186** -0.126 0.045 -0.413*** 0.146* (0.131) (0.077) (0.104) (0.076) (0.148) (0.078) GHQ score 0.048*** 0.028*** 0.033*** 0.032*** 0.030*** 0.012*** (0.006) (0.004) (0.005) (0.004) (0.007) (0.004) Mother works 0.087 -0.030 0.011 -0.138*** 0.001 -0.020 (0.076) (0.049) (0.058) (0.050) (0.087) (0.050) Father works 0.036 0.104 0.211** -0.206*** 0.033 0.071 (0.114) (0.071) (0.092) (0.072) (0.131) (0.072) Degree -0.169 -0.219*** -0.056 -0.399*** -0.099 -0.249*** (0.111) (0.073) (0.078) (0.074) (0.124) (0.074) Vocational qualification -0.085 -0.317*** -0.052 -0.263*** -0.104 -0.133* (0.105) (0.071) (0.078) (0.072) (0.124) (0.072) A levels -0.011 -0.267*** -0.078 -0.097* 0.185* -0.032 (0.090) (0.057) (0.069) (0.057) (0.104) (0.057) O levels -0.020 -0.097 0.027 -0.117* 0.131 -0.098 (0.101) (0.061) (0.073) (0.063) (0.112) (0.062) Log income 0.154** -0.234*** -0.074 -0.099** -0.014 -0.047 (0.074) (0.043) (0.053) (0.044) (0.080) (0.045) Sample size 5166 5166 5166
Standard errors in parentheses. *, ** and *** denote significance at .10, .05 and .01 levels. See the Appendix for definitions of covariates. Year and regional dummies are also included in the models but are not shown.
Table 3: Parent-Child Differences in SDQ scores
Emotional Conduct Hyperactivity
Location Spread Location Spread Location Spread
Child’s age -0.028 -0.025** 0.053*** -0.020 -0.101*** -0.005 (0.020) (0.013) (0.015) (0.013) (0.022) (0.013) Child is male 0.191*** -0.124*** -0.251*** 0.166*** 0.698*** 0.165*** (0.054) (0.035) (0.042) (0.035) (0.062) (0.036) Black 0.228 -0.220* 0.058 -0.129 0.166 0.086 (0.185) (0.130) (0.150) (0.131) (0.242) (0.131) Asian 0.089 0.035 0.221* -0.049 0.097 0.090 (0.165) (0.106) (0.126) (0.107) (0.194) (0.107) Number of children -0.053* 0.027 -0.005 0.119*** -0.026 0.026 (0.030) (0.019) (0.024) (0.019) (0.034) (0.019) Government housing -0.110 0.071 0.187*** 0.094* 0.408*** 0.157*** (0.087) (0.054) (0.068) (0.054) (0.098) (0.053) Cohabitating -0.043 0.303*** -0.057 0.226*** 0.364*** 0.132* (0.123) (0.071) (0.093) (0.071) (0.132) (0.071) Single 0.013 0.172* -0.014 0.043 -0.249 -0.017 (0.165) (0.102) (0.124) (0.100) (0.182) (0.101) Divorced/separated -0.005 0.131* -0.057 0.073 -0.088 -0.023 (0.112) (0.071) (0.085) (0.069) (0.125) (0.070) GHQ score 0.042*** 0.022*** 0.014*** 0.019*** 0.010 0.008** (0.006) (0.003) (0.004) (0.003) (0.006) (0.003) Mother works -0.008 -0.018 -0.050 -0.022 -0.071 -0.045 (0.068) (0.043) (0.052) (0.045) (0.077) (0.043) Father works 0.030 0.021 0.001 0.105 -0.012 0.007 (0.100) (0.067) (0.076) (0.064) (0.114) (0.064) Degree -0.103 -0.103 -0.208*** -0.289*** -0.698*** -0.055 (0.098) (0.066) (0.072) (0.067) (0.112) (0.065) Vocational qualification -0.139 -0.000 -0.184** -0.011 -0.518*** 0.032 (0.098) (0.064) (0.076) (0.064) (0.112) (0.063) A levels -0.063 -0.095* -0.086 -0.031 -0.121 -0.033 (0.078) (0.051) (0.061) (0.051) (0.089) (0.050) O levels -0.081 0.047 -0.073 0.010 -0.195** 0.011 (0.087) (0.055) (0.067) (0.055) (0.097) (0.054) Log income -0.060 -0.046 -0.037 -0.106*** -0.096 -0.015 (0.062) (0.040) (0.048) (0.039) (0.069) (0.039) Sample size 6505 6505 6505
Standard errors in parentheses. *, ** and *** denote significance at .10, .05 and .01 levels. See the Appendix for definitions of covariates. Year and regional dummies are also included in the models but are not shown.
Table 4: Teacher-Child Differences in SDQ scores
Emotional Conduct Hyperactivity
Location Spread Location Spread Location Spread
Child’s age 0.039 -0.050*** 0.072*** -0.034** -0.036 -0.026* (0.024) (0.015) (0.018) (0.015) (0.027) (0.015) Child is male 0.371*** -0.104** 0.047 0.309*** 0.947*** 0.253*** (0.067) (0.042) (0.052) (0.041) (0.077) (0.041) Black 0.028 -0.066 0.296 0.176 1.098*** 0.013 (0.251) (0.155) (0.228) (0.153) (0.301) (0.154) Asian -0.384** -0.379*** 0.151 -0.110 0.509** 0.170 (0.176) (0.124) (0.149) (0.126) (0.252) (0.125) Number of children -0.087** -0.006 -0.116*** 0.052** 0.061 0.012 (0.037) (0.022) (0.029) (0.023) (0.042) (0.022) Government housing -0.250** -0.046 -0.003 0.193*** 0.259** 0.075 (0.111) (0.065) (0.091) (0.064) (0.126) (0.063) Cohabitating -0.130 0.068 0.068 0.176** 0.262* 0.061 (0.140) (0.085) (0.111) (0.084) (0.159) (0.085) Single 0.194 -0.095 0.181 0.108 0.275 0.161 (0.206) (0.119) (0.175) (0.119) (0.250) (0.120) Divorced/separated 0.013 0.103 0.029 0.109 0.297* 0.004 (0.144) (0.082) (0.114) (0.083) (0.161) (0.081) GHQ score -0.011 0.023*** -0.020*** 0.014*** -0.022*** 0.006 (0.007) (0.004) (0.005) (0.004) (0.008) (0.004) Mother works -0.041 -0.034 -0.034 -0.006 -0.078 -0.011 (0.085) (0.051) (0.064) (0.053) (0.095) (0.051) Father works 0.006 0.098 -0.172* -0.048 0.011 -0.000 (0.125) (0.074) (0.099) (0.077) (0.145) (0.073) Degree 0.047 -0.014 -0.037 -0.195** -0.442*** -0.147* (0.122) (0.075) (0.090) (0.076) (0.134) (0.076) Vocational qualification -0.139 -0.012 -0.087 -0.165** -0.248* -0.032 (0.120) (0.073) (0.089) (0.074) (0.136) (0.073) A levels -0.066 -0.114* 0.002 -0.085 -0.177 -0.002 (0.097) (0.059) (0.076) (0.059) (0.112) (0.058) O levels -0.112 -0.025 -0.154* -0.024 -0.291** 0.053 (0.108) (0.064) (0.084) (0.066) (0.125) (0.065) Log income -0.182** -0.266*** -0.059 -0.139*** -0.181** -0.086* (0.081) (0.047) (0.060) (0.048) (0.089) (0.048) Sample size 4818 4818 4818
Standard errors in parentheses. *, ** and *** denote significance at .10, .05 and .01 levels. See the Appendix for definitions of covariates. Year and regional dummies are also included in the models but are not shown.
Table 5: Estimated Income Gradient for Different Respondent SDQ Scores
Log Income Coefficients Tests of Coefficient Equality
Parent (1) Teacher (2) Child (3) Parent – Teacher (4) Parent – Child (5) Teacher – Child (6) Basic Controls Emotional -0.393*** -0.460*** -0.315*** 0.314 0.189 0.035 (0.051) (0.048) (0.053) Conduct -0.404*** -0.303*** -0.210*** 0.039 0.000 0.074 (0.042) (0.040) (0.043) Hyperactivity -0.596*** -0.512*** -0.152*** 0.226 0.000 0.000 (0.065) (0.064) (0.058) Expanded Controls Emotional -0.204*** -0.343*** -0.176*** 0.080 0.685 0.041 (0.059) (0.056) (0.062) Conduct -0.189*** -0.112** -0.057 0.152 0.012 0.350 (0.048) (0.046) (0.050) Hyperactivity -0.250*** -0.233*** 0.010 0.836 0.001 0.004 (0.075) (0.075) (0.067)
Figures in the left-hand panel are estimated coefficients for log real household income. Figures in the right-hand panel are p-values from a chi-squared test of equality between income coefficients. Standard errors in parentheses. *, ** and *** denote significance at .10, .05 and .01 levels. Sample size of 4,776 includes all children aged ≤ 15 with parent, teacher, and child scores for emotional, conduct and hyperactivity indices. Basic controls are age, gender, ethnicity, parents’ marital status, log income, number of children, and an indicator for whether the parental respondent was the mother or father. Expanded controls also include parental education labour market activity and mental health.
Table 6: Estimated Income Gradient for Assessments by Different Respondents of Having a Disorder Psychiatrist ICD-10 Assessment (1) Parent Direct Report (2) Parent SDQ Indicator (4) Teacher SDQ Indicator (5) Child SDQ Indicator (6) Basic Controls Emotional -0.033*** -0.023*** -0.019*** -0.039*** -0.017*** (0.005) (0.005) (0.005) (0.005) (0.005) Conduct -0.028*** -0.037*** -0.028*** -0.034*** -0.017*** (0.006) (0.006) (0.006) (0.006) (0.006) Hyperactivity -0.005* -0.009** -0.008** -0.013*** -0.001 (0.003) (0.004) (0.003) (0.004) (0.003) Expanded Controls Emotional -0.022*** -0.009 -0.007 -0.031*** -0.008 (0.006) (0.006) (0.006) (0.006) (0.006) Conduct -0.008 -0.017*** -0.011* -0.016** -0.006 (0.007) (0.007) (0.007) (0.007) (0.007) Hyperactivity -0.000 -0.002 -0.004 -0.006 0.003 (0.003) (0.004) (0.004) (0.004) (0.003)
Figures are estimated coefficients for log real household income. Estimates from a linear probability model. Standard errors in parentheses. *, ** and *** denote significance at .10, .05 and .01 levels. Sample size of 4,776 includes all children aged ≤ 15 with parent, teacher, and child scores for emotional, conduct and hyperactivity indices. Basic controls are age, gender, ethnicity, parents’ marital status, log income, number of children, and an indicator for whether the parental respondent was the mother or father. Expanded controls also include parental education labour market activity and mental health.
Appendix Table A1. Description of Control Variables Used in the Analysis
Variable Description Mean
Child’s age Child’s age in years 12.95
Child is male Child is male (dv) 0.510
Black Child’s ethnicity is either black African or black Caribbean (dv) 0.021
Asian Child’s ethnicity is either Indian, Pakistani or Bangladeshi (dv) 0.033
Number of children Number of children in household 2.100
Government housing Family’s landlord is the council or housing association (dv) 0.230
Cohabitating Child lives with non-married cohabitating parents (dv) 0.071
Single Child lives with never-married single parent (dv) 0.056
Divorced/separated Child lives with divorced/separated parent (dv) 0.186
GHQ score Responding parent’s mental health GHQ 36 Likert score 11.15
Mother works Mother employed (full-time or part-time) (dv) 0.688
Father works Father employed (full-time or part-time) (dv) 0.680
Degree Responding parent has degree level qualification (dv) 0.123
Vocational qualification Responding parent has Teaching, HNC, HND, or BEC qualification (dv) 0.120
A levels Responding parent has A-level qualifications (dv) 0.265
O levels Responding parent has O-level qualifications (dv) 0.187
Log income Log household gross income in 2001 dollars (midpoints of categories) 9.905
Northern England Child resides in Northern England (dv) 0.220
Midlands Child resides in Midlands (dv) 0.264
Southern England Child resides in Southern England (dv) 0.236
Wales Child resides in Wales (dv) 0.076
Appendix Table A2: Estimated Income Gradients using Probit Specification Psychiatrist ICD-10 Assessment (1) Parent Direct Report (2) Parent SDQ Indicator (4) Teacher SDQ Indicator (5) Child SDQ Indicator (6) Basic Controls Emotional -0.026*** -0.018*** -0.016*** -0.028*** -0.015*** (0.004) (0.005) (0.004) (0.004) (0.005) Conduct -0.022*** -0.028*** -0.021*** -0.025*** -0.015*** (0.004) (0.004) (0.004) (0.004) (0.005) Hyperactivity -0.003* -0.008*** -0.005** -0.009*** -0.001 (0.002) (0.003) (0.002) (0.002) (0.003) Expanded Controls Emotional -0.016*** -0.007 -0.006 -0.020*** -0.007 (0.005) (0.005) (0.005) (0.005) (0.006) Conduct -0.007 -0.014*** -0.009* -0.012** -0.006 (0.005) (0.005) (0.005) (0.005) (0.006) Hyperactivity 0.000 -0.002 -0.002 -0.005* 0.003 (0.002) (0.003) (0.002) (0.003) (0.003)
Figures are estimated marginal effects for log real household income calculated for the mean individual. Standard errors in parentheses. *, ** and *** denote significance at .10, .05 and .01 levels. Sample size of 4,776 includes all children aged ≤ 15 with parent, teacher, and child scores for emotional, conduct and hyperactivity indices. Basic controls are age, gender, ethnicity, parents’ marital status, log income, number of children, and an indicator for whether the parental respondent was the mother or father. Expanded controls also include parental education labour market activity and mental health.