Trisha Jha
Jennifer Buckingham
Free to Choose Charter Schools:
How charter and for-profit schools
can boost public education
National Library of Australia Cataloguing-in-Publication Data:
Jha, Trisha, author.
Free to choose charter schools : how charter and for-profit schools can boost public education / Trisha Jha ; Jennifer Buckingham.
9781922184535 (paperback) CIS research report ; 6.
Charter schools. School choice. Low-income students. Academic achievement.
Other Creators/Contributors: Buckingham, Jennifer, author.
Centre for Independent Studies (Australia), issuing body.
Research Report 6
Free to Choose Charter Schools:
How charter and for-profit schools
can boost public education
Trisha Jha
Related CIS publications
Issue Analysis
IA116 Jennifer Buckingham, Educating The Disadvantaged (2009)
TARGET30
Contents
Executive Summary ...1
Introduction ...3
Why consider charter schools?...4
NAPLAN ...4
PISA ...5
Charter schools, free schools and school autonomy ...6
Charter and free school formation ...7
United States ...8
What is a charter school? ...8
Management of charter schools ...8
Statistical context ...8
Evidence on student achievement ...9
Characteristics of high impact charter schools ... 11
Segregation, equity, and heterogeneous effects ... 13
Sweden ... 15
Friskolor ...15
Evidence on student achievement ... 16
Segregation and equity ... 17
Chile... ...18
Independent schools...18
Evidence on student achievement ... 18
Segregation and equity ... 18
England...20
Free schools ...20
Academies ...21
For-profit independent schools ... 21
New Zealand ...22
Partnership schools... 22
For-profit schools...23
Evidence on student achievement ... 24
For-profit schools and government funding ... 26
Private and for-profit schools in developing countries ... 27
Prospects for charter schools in Australia ... 29
For-profit schools in Australia ... 30
Policy lessons from international evidence ... 32
Charter school authorisation and governance ... 32
For-profit schools and management ... 32
Cost impacts of implementing a charter school model ... 33
ACKNOWLEDGEMENTS
The authors are grateful for comments from three anonymous reviewers on an earlier draft of this report. The authors would also like to thank Lachlan Philips for assistance with research. Any errors or omissions
● Educational achievement levels among Australian children, especially those from disadvantaged backgrounds, are not improving and in some cases are declining.
● Funding is not the problem: school funding more than doubled in the past 25 years, while enrolments increased by only 18%.
● A new approach is required where other schools have persistently failed, and where there is demand for alternatives to traditional public schools.
● Charter schools combine public funding with private (non-government) management.
● Charter schools and similar school choice policies exist in the US (charter schools), Sweden (free schools or ‘friskolor’), Chile (independent schools), England (free schools and academies) and New Zealand (partnership schools). These schools generally receive funding at comparative levels to public schools, cannot charge fees, and cannot be selective in their students.
● Charter schools can be ‘start up’ schools — new schools established to serve growing populations or the demand for alternative provision; or ‘conversion’ schools — existing schools that have become charter schools.
● A review of the empirical literature on charter schools and their equivalents reveals small positive impacts on achievement levels on average, but much stronger positive effects for disadvantaged students in particular.
● A subset of high impact charter schools have been identified in the literature, most of which follow the ‘no excuses’ model of high expectations of achievement, strong discipline, traditional teaching methods, and longer school days and years.
● The most successful charter schools in the US tend to be networks of schools operated by non-profit charter management organisations, serving disadvantaged student populations. A similar trend is emerging in England.
● Charters could extend school choice to those who cannot access it, provide opportunities for innovation in schools, and offer a way to turn around chronically-failing schools
● Charter schools have a potential cost impact if a student is switching from a lower subsidy Catholic school to a full-subsidy charter school, but the relatively small difference in average costs would arguably be offset by the productivity benefits. ● In light of the evidence, state and territory
governments should consider introducing charter schools. The lessons from the charter school experience in other countries would allow Australian governments to emulate their successes and avoid their mistakes.
● For-profit companies are allowed to operate charter, free schools or voucher schools in all but one of the countries examined in this report. Studies comparing for-profit schools to non-profit charter schools have mixed results, ranging from no difference to a small positive effect of for-profit status.
● Low-fee private and for-profit schools, either corporate chains or sole-proprietor schools, are not uncommon in developing countries and are patronised by poor families. Some studies suggest the quality of these schools is superior to public schools.
● For-profit schools are not unlawful anywhere in Australia except Victoria. Most state governments will not give for-profit schools public funding, however the lines can sometimes be blurred between for-profit and non-for-profit ownership.
● Recommendations:
— Charter schools should be funded at an equivalent rate to government schools with similar student demographics.
— Charter schools should be free, have open enrolment, and have flexibility and autonomy surrounding staffing and curriculum.
— Strong charter laws that ensure accountability are crucial. The framework that exists between education departments and non-government schools already provides a solid base for this to be developed.
— New start-up charter schools should be authorised only where there is proven demand. Conversion charter schools should be introduced where traditional public school management has failed, and where there is support from the community. — For-profit companies should not be barred from
operating charters if they have a proven successful track record in operating schools. However, scrutiny should be rigorous and all financial dealings transparent. For-profit schools should be established only where there is sufficient choice among schools (i.e. a for-profit school should not be the only school available).
Tired school sector wars continue to consume Australia’s public debate on education, but elsewhere the discussion on schools policy isn’t about government schools versus non-government schools. Rather, it’s about rethinking the provision of school education; specifically, how the benefits of school autonomy and — more importantly — an education of choice, can be expanded to children and families who currently cannot access it.
The combination of private management and public funding is increasingly seen as a way for governments to meet a number of educational goals. Public funding of privately-managed schools can enable disadvantaged students to attend schools of choice by subsidising the costs, it allows more families to make choices, and it can reduce the overall cost of educational provision to government.1
Public funding of privately-managed schools takes various forms. ‘Voucher’ schemes are student-based and provide students with a public funding entitlement to be used at a private school. Universal schemes provide vouchers to all students while targeted schemes limit the vouchers to disadvantaged students. Charter school policies are school-based. They allow privately-managed schools to be funded as public schools.
The US, Sweden and Chile have experimented with school choice, vouchers, charter schools and independent management for a couple of decades. More recently, in England and in New Zealand, politicians and policymakers have looked to charter schools and their equivalents as a solution to declining school results and widening social inequities that see poor children go to poor schools.
Australia has a well-established and highly successful non-government school sector. More than a third of students attend non-government schools—either an independent school or a Catholic school. These schools receive relatively high levels of public funding. While there is a range of types and quality of schools within both the government and non-government school sectors, Australian policymakers have been reluctant to seriously consider new ways to increase the educational options available, especially to turn around schools where the quality is chronically poor.
Introducing charter schools and free schools to the Australian educational landscape should be considered in light of a fair and frank assessment of their potential costs and benefits. This report explores the evidence of the impact of charter schools and their equivalents in the US, Sweden, Chile, England and New Zealand. It also examines for-profit schools as a subset of charter schools, and how independent for-profit schools operate outside the auspices of government in developing countries.
The report outlines the status quo of school regulation in Australia, and then draws on policy lessons from international experiences to create a framework for how charter school might operate here. A solid basis from which to develop good charter school laws and good quality charter schools can be built on the fiduciary relationships that exist between the education departments and non-government schools that receive public funding.
Despite consistent and substantial increases in school funding over the last several decades, achievement in Australia has not improved and in some cases has declined. School funding more than doubled in the past 25 years, while enrolments increased by only 18%.2
Australia participates in a number of international assessments, as well as having a national literacy and numeracy assessment program. Results from these tests indicate the performance of Australian students in the key academic areas of literacy, numeracy, and science show flat test-score trends in some domains, and a decreasing trend in others.3
NAPLAN
The National Assessment Program for Literacy and Numeracy (NAPLAN) commenced in 2008 and is conducted annually. Each year, students in Years 3, 5, 7 and 9 are tested on numeracy, reading, spelling, writing, and grammar and punctuation. Table 1 shows the mean reading score and the proportion of students below the national minimum standard in 2008 and 2014.
Table 1: Mean scores and percentages of students below national minimum standard (NMS) in reading and maths, NAPLAN 2008 and 2014.
2008 2014 Difference* READING Year 3 Mean 400.5 418.3 o % below NMS 7.9% 6.5% o Year 5 Mean 484.4 500.6 o % below NMS 9% 7.1% o Year 7 Mean 536.5 546.1 + % below NMS 5.8% 5.1% o Year 9 Mean 578 580.4 + % below NMS 7.1% 7.9% o NUMERACY Year 3 Mean 396.9 401.8 o % below NMS 5 5.4 o Year 5 Mean 475.9 487.6 o % below NMS 7.3 6.5 o Year 7 Mean 545 545.9 o % below NMS 4.5 4.9 o Year 9 Mean 582.2 587.8 o % below NMS 6.4 5.9 o
* o = no difference; + = statistically significant positive difference
Source: Australian Curriculum, Assessment and Reporting
Authority (ACARA). 2015. National Assessment Program for Literacy and Numeracy. National Report for 2014. ACARA, Sydney.
Why consider charter schools?
There was a small but statistically significant increase in mean scores in Year 7 and Year 9 reading between 2008 and 2014, but no change in any other year for either domain. The average scores for all Australian students shown in Table 1 are higher than the average scores for students from low socioeconomic status (SES) backgrounds. Likewise, much higher proportions of students from low SES backgrounds fail to achieve the national minimum standard. Figure 1 shows the achievement distribution in reading and numeracy by parent occupation category — a proxy measure of SES — in NAPLAN 2014.
Figure 1: Mean scores (LHS) and percentages of students below NMS (RHS) in Year 3 reading and numeracy by parent occupation, NAPLAN 2014.
Source: Australian Curriculum, Assessment and Reporting
Authority (ACARA). 2015. National Assessment Program for Literacy and Numeracy. National Report for 2014. ACARA, Sydney.
Figure 1 shows that students who do not have a parent in paid work or have parents in low skill occupation categories have lower mean test scores. It also shows very large differences in the proportion of students who fail to achieve national minimum standards in literacy and numeracy. More than 16% of students who do not have a parent in paid work did not achieve the national minimum literacy standard, compared with 2.1% of
students with parents in a professional occupation. Similar differences are evident when comparing achievement against parental education levels.
PISA
Australia has participated in the Program for International Student Assessment (PISA) since its inception in 2000. PISA is conducted every three years and tests 15-year-old students on reading, mathematical literacy and scientific literacy. Each test year has a focus on one of the three domains in a rotating cycle.
Figure 2: Mean reading, maths and science scores of Australian students, PISA 2000–2012
Source: OECD. 2013. PISA 2012 Results: What Students Know
and Can Do – Student Performance in Mathematics, Reading and Science (Volume I). PISA, OECD Publishing, Paris.
Figure 2 shows mean performance of Australian students has been stable in science but has declined in reading and maths. The decline in mean scores is attributable largely to a decrease in the proportion of students in the highest achievement bands. This is a serious problem and one that will be addressed in future reports. However, also serious is the persistent number of students in the lowest achievement bands.
Table 2: Percentage of all students below minimum achievement standard (Level 2), PISA 2012
Reading % Maths % Science %
2000 12.5
2003 11.8 14.3
2006 13.4 13 12.9
2009 14.2 15.9 12.6
2012 14.2 19.7 13.6
Source: OECD. 2013. PISA 2012 Results: What Students Know
and Can Do – Student Performance in Mathematics, Reading and Science (Volume I). PISA, OECD Publishing, Paris.
Table 2 shows the proportion of students with scores below Level 2, which is considered the baseline level of proficiency required to participate fully in modern society. The proportions of students below Level 2 increased slightly in reading and science, and substantially in maths.
As in NAPLAN, students who fail to achieve minimum standards in PISA are disproportionately from low SES backgrounds. Figure 3 shows the proportion of students from each ESCS (index of educational, social, economic and cultural status) quartile in the lowest achievement bands (below Level 2), with 33% of students from the lowest ESCS quartile failing to achieve the minimum standard in maths, compared with 8% from the highest ESCS quartile.
Figure 3: Students below minimum achievement standard by ESCS quartile, PISA 2012
Source: Thomson, S., L. de Bortoli & S. Buckley. 2013. The
PISA 2012 Assessment of Students’ Mathematical, Scientific and Reading Literacy. ACER, Camberwell, Vic.
While there is some debate about the role of SES in student achievement, and the home and school factors that mediate its impact, there is no doubt that poor achievement is disproportionately and persistently high among low SES students.4 The national minimum
standard for NAPLAN is not a difficult benchmark. That so many children fail to reach it is a profound problem. As will be discussed in detail in this report, charter schools show particular promise for low achieving, socially disadvantaged students.
Charter schools and free schools are among the range of options that can be used to decentralise public school management away from state governments and increase the extent of school autonomy in systems of schools. There are no charter schools in Australia. Charter schools are public schools but they are not government schools; they are managed by a private organisation under a legislative contract or ‘charter’ with the government. They can be new schools, or former government schools whose management has been given to a charter school operator.
Charter schools receive public funding similar to the funding provided to equivalent government schools and do not charge fees. Often the charter will stipulate that the school must have open enrolment and must have non-discriminatory hiring policies, but there is no reason why charter schools could not have a specialisation. The charter can also specify other aspects of schooling, including employment practices and curriculum but the rationale of charter schooling is to release schools from these restrictions.5 The vast majority (88%) of charter
schools in the US are not unionised.6
Charter Schools, Free Schools and School Autonomy
Table 3: Differences between school sectors
Traditional public school Independent public school Charter/free school Non-government school
School management Government Government Charter Management Organisation/ Education Management Organisation/private organisation Private organisation/ charity Fully government funded?
Yes Yes Yes No – partly government
funded
Can charge tuition fees?
No No No Yes
Budget autonomy In some states Yes Yes Yes
Enrolment Residential zoning, some selective
Residential zoning Application and lottery Application, some selective
State/national curriculum?
Yes Yes No Yes
Teachers Must have registered teachers; school-based hiring varies between states.
Must have registered teachers; school-based hiring.
Charters: depends on district but most have school-based hiring. Free schools: school-based hiring.
Must have registered teachers; school-based hiring.
Box 1: Charter schools, Independent Public Schools and non-government
schools
In 2008, the Western Australian government implemented its Independent Public Schools policy, allowing public schools to become self-managing. There are 441 Independent Public Schools in Western Australia, which is more than half the public schools in the state.7 In Queensland, 130 schools have become Independent Public
Schools since 2013.8 All states and territories have received federal government funding to devolve more
management to schools.9
For Independent Public Schools and Catholic systemic schools, the most accurate description of their governance structure is school-based management. It is technically a misnomer to call self-managing public schools ‘autonomous schools’. The only Australian schools to which the autonomous schools definition might apply are independent schools, but they also must meet heavy obligations in order to receive government funding, including: implementing the Australian Curriculum; participating in NAPLAN testing; and providing student and school data to be published on the My School website.
Independent Public Schools are often confused with charter schools. They are not; the key difference being that Independent Public Schools are still government-owned and operated. In Independent Public Schools, the principal and staff are government employees and schools must adhere to state industrial legislation and curriculum, and other state and national policies. They are government schools that operate with financial autonomy and greater latitude in staff hiring.
The charter school movement began in the United States, where there are around 1.6 million students in 5000 charter schools, across 40 states, representing about 5% of all public schools. For-profit organisations run 16% of charter schools10 and in 2013, there were
around 586,000 children on charter school waiting lists.11
The ‘free schools’ now operating in England are similar to charter schools. They receive public funding equivalent to similar government schools with the condition that they do not charge tuition fees, and meet some conditions around enrolment and access. However, they do not have to teach the national curriculum, and they have a large degree of flexibility in school staffing. Teachers do not have to be registered, and teacher pay and conditions are set by the school.12
Many other countries have funding and governance arrangements that allow the establishment of privately-managed, free schools, including Sweden and Chile. New Zealand began heading down this path in 2014 with what they have called Partnership Schools — which are similar to England’s free schools, with similar freedoms in provision, underpinned by rigorous accountability requirements.13
Charter and free school formation
Charter schools and their equivalents can form in various ways. Differentiating between the ways charter schools can be established is vital for a thorough assessment of the literature. Broadly they fall into two main categories: ● Start-up: Start-up charter schools are new schools
set up as an alternative to the existing schools in a town or suburb. Local authorities generally have to give permission to would-be charter providers to establish a new school but where charter laws are in place, this authorisation process is usually subject only to the requisite legal requirements being met — local authorities do not play a coordinating role. Start-up charter schools are likely to be established in areas, or for student population groups, where there is a perceived demand for new, innovative, ‘disruptive’ types of education. ‘Disruptive’ charter school formation best describes Sweden’s system of free schools, England’s free schools, New Zealand’s Partnership Schools and the practices undertaken in
some US states.
● Conversion: Conversion charter schools are established when local authorities single out under-performing schools or school districts and attempt to lift outcomes by transferring management to a charter organisation. Conversion charter school formation best describes the reforms of US states such as Ohio, where under-performing schools were targeted for what were called ‘conversions’. The first wave of Academies in England were conversions of underperforming state schools.
The distinction between the two main types of charter schools highlights a key problem with assessing the evidence on charter schools. Comparing charter schools that had their genesis in completely different policy and student achievement environments can produce misleading results. Much of the policy debate on charter schools fails to make this distinction.
This fissure in the charter school landscape makes it difficult to identify which factors within either the regulatory or the social demographic environment are contributing to a given result, and what that says about the associated policies or regulations. These details are important if a country is considering adopting charter schools, as it may mean the difference between success and failure.
It is also important to clarify the benchmarks and measures of success. Swedish literature, for instance, focuses on the extent to which the positive impact of free schools on student outcomes constitutes a ‘private attendance effect’ (attending better schools) or a ‘competition effect’ (competition between government and non-government schools). Whether charter school policy demonstrably benefits all children, just the ones who attend charter schools, or specific sub-groups of the charter school population, is an important part of assessing the prospects for charter schools in Australia. The largest English-language literature on charter and free schools is from the US, partly because of the long history of charter schools — almost 25 years — and partly because they have been controversial and, therefore, the subject of much research and commentary.
What is a charter school?
A charter school is, at the most basic level, a school that “combines public funding with private management.”14
Unlike traditional non-government schools in the US (which generally do not receive public funding as a matter of course, in contrast to Australia), charter schools cannot charge top-up fees and cannot be selective in which students they admit: if a school is over-subscribed, enrolment must be through a lottery. Charter schools in the US are mostly overseen by school districts, with states having overarching legislation that sets out minimum standards for district charter agreements. This is in contrast to the other countries discussed in this report, where the legal and governing architecture of charter schools is set at the national level. Inter-state or even intra-state (where charter policy is set by school districts) comparisons are therefore complicated as they rarely involve like circumstances.
Management of charter schools
Charter schools can be run by a range of different organisations. These organisations can be run on a non-profit or for-non-profit basis, and be part of a chain (where the organisation runs more than one school) or be freestanding.15
Charter chains run on a non-profit basis are usually referred to as ‘Charter Management Organisations’, or CMOs. CMOs are more successful in raising money from philanthropy than traditional public schools, freestanding charters or EMOs.16 For-profit charter chains are usually
referred to as Education Management Organisations, or EMOs.
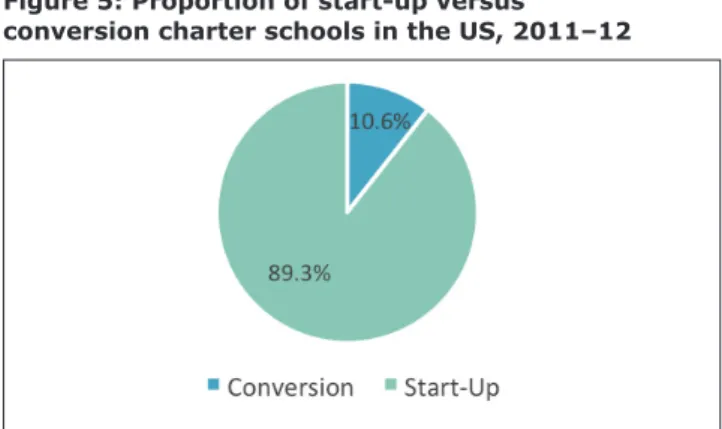
As Figure 4 (above) shows, the majority of charter schools in the US are ‘freestanding’ — run on a non-profit basis where the relevant organisation only has responsibility for one school. These organisations are most often run by parents and other local, grassroots parties. Figure 5 shows that the majority of charter schools across the country are ‘start-up’ schools. Whether charter schools are start-ups or conversions
United States
is only one variable that can play a role in making it difficult to compare schools across state and district borders.
Statistical context
Figure 6 shows a significant and steady increase in the number of charter schools in the United States over a recent period.
Figure 6: Charter school growth, 2001–14
Source: National Alliance for Public Charter Schools
Figure 7: Number of students in charter and non-charter schools (LHS) and charters as a percentage of all public schools (RHS), 2001–14
Source: National Alliance for Public Charter Schools
Figure 4: Charter schools by management type,
2010–11 Figure 5: Proportion of start-up versus conversion charter schools in the US, 2011–12
As Figure 7 shows, charter schools are a small proportion of the overall public school sector, but are growing significantly.
Evidence on student achievement
Large-scale studies of charter school impacts report aggregate average results that can mask large variations in results across states and districts, and across sub-groups of the student population. Studies that cover a smaller geographic area will often examine heterogeneous effects of the policy on specific student sub-groups. Furthermore, different study designs yield slightly different results.17 A selection of these studies
is summarised in Tables 4 and 5. They are the major
studies of student achievement in charter schools conducted in the last decade, with the most rigorous methodologies to account for potential selection biases and endogenous effects. Only statistically significant findings are reported in the table.
Table 4 contains studies that employ random assignment methodologies. These studies compare students who were enrolled in charter schools by a lottery process with their counterparts who participated in the lottery but missed out, and remain in traditional public schools. Table 5 contains studies that employ virtual control matching methodologies, in which students in charter schools were compared with ‘virtual peers’ in a traditional public school in the same location.
Table 4: Summary of random assignment studies examining the impact of charter schools on student achievement, relative to traditional public schools
Study Areas/subjects
examined Location and admission type Achievement findings Other findings or characteristics The Impact of Charter
Schools on Student Achievement (Hoxby and Rockoff, 2005)18
Maths and reading; kindergarten through to fifth grade
Application and lottery admission, in the Chicago district, and Illinois generally
Positive: improvement in maths scores of 6 to 7 percentage points and in reading scores of 5 to 6 percentage points.
Schools are located in highly urban areas; students are mostly black or Hispanic and receive free or reduced-price lunches.
The Preuss School at UCSD: School Characteristics and Students’ Achievement (McClure et. al. 2005)19
All subjects; standardised testing. College attendance
Applications from disadvantaged students and lottery admission, in San Diego
Mixed: the two groups had individual subjects where the Preuss group outperformed the control, but mostly there were null effects.
More Preuss graduates than control graduates attended college.
Charter Schools in New York City: Who Enrolls and How They Affect Their Students’ Achievement (Hoxby and Murarka, 2009)20
Maths and reading; third through to eighth grades
Application and lottery admission, in New York City Positive: 0.04 standard deviations a year improvement in reading; 0.09 in mathematics.
Black students are overrepresented relative to the traditional public schools in the area. Most robust correlation between school policy and student improvement is a longer school year. Informing the Debate:
Comparing Boston’s Charter, Pilot and Traditional Schools (Abdulkadiroglu et. al. 2009)21
English Language Arts and maths
Application and lottery admission, in Boston
Positive: 0.09 to 0.17 SD increase in English; 0.18 to 0.54 SD increase in maths.
Charter middle schools increase maths performance by 0.5 SD – half the size of the black-white achievement gap. Are High-Quality
Schools Enough to Close the Achievement Gap? Evidence from a Bold Social Experiment in Harlem (Dobbie and Fryer, 2010)22
English Language Arts and maths
Application and lottery admission, in the Harlem Children’s Zone
Positive (elementary school): 1.75 SD gain in maths and ELA, closing the racial achievement gap. Positive (middle school): more than a full SD in math; between a third and a half of a SD in ELA, reversing the racial gap in maths and reducing it in ELA.
Elementary school maths gains close the racial achievement gap; middle school sees the racial achievement gap reversed in maths and reduced for ELA.
The Evaluation of Charter School Impacts (Gleason et. al. 2010)23
Maths and reading Application and lottery in 15 US states
Null average effect: charter middle schools had no significant impact on student achievement, behaviour, and school progress.
Schools which served more low-income or low achieving students had significant positive effects on math scores, but they were negative for the more advantaged school populations. Student Achievement in
Massachusetts’ Charter Schools (Angrist et. al. 2011)24
English Language Arts and maths
Application and lottery admission, in Massachusetts
Mixed (middle school): positive impact on maths scores but no impact on ELA scores. Positive (High school): strong, positive impacts in both subjects.
When results for middle schools were analysed by urban status, urban middle schools showed large ELA and maths impacts, whereas non-urban schools had negative and significant effects for both subjects. The Effect of School
Choice on Intrinsic Motivation and Academic Outcomes (Hastings et. al. 2012)25
Maths and reading Children at persistently underperforming schools (location undisclosed) enter into a school choice lottery, which includes charter schools
Positive: students who select a ‘no excuses’ charter school experience a 0.3 SD gain in combined test scores.
Lottery participants more likely to be black, less likely to be Hispanic, less likely to receive free lunch.
Table 5: Summary of virtual control matching studies examining the impact of charter schools on student achievement, relative to traditional public schools
Study Areas/subjects
examined Location and admission type Achievement findings Other findings or characteristics National Charter School
Study (CREDO, 2013)26
Maths and reading; grade levels
Start-up and conversion schools with various admissions policies in 27 US states
Mixed: small positive impacts of charter school attendance on academic growth on average. Some charter schools positive, some no effect, some negative.
Stronger gains for sub-groups (poor, black & Hispanic, English language learners) in charters.
Improvements from the 2009 study are largely attributable to the closure of failing schools.
Students who had been in charter schools longer had larger gains. Urban Charter School
Study (CREDO, 2015)27
Maths and reading scores; grade levels
Start-up and conversion schools with various admissions policies in 41 urban regions
Mixed: small, positive average impacts of charter school attendance on academic growth but mixed effects underlying average.
Much stronger charter school effects in some regions than others. Stronger effects for some disadvantaged sub-groups of students.
Charter schools in eight states: effects on achievement, attainment, integration and competition (Zimmer et. al., 2009) (RAND)28
Maths and reading scores; educational attainment (Florida and Chicago only)
Various admissions policies in Chicago, Denver, Milwaukee, Philadelphia, San Diego, Florida, Ohio and Texas
Null: differences in student performance between the sectors are small or non-existent. Positive: likelihood of achieving a high school diploma and attending college is higher for charter high school students.
Achievement and Attainment in Chicago Charter Schools (Booker et. al., 2009)29
Maths and reading scores; educational attainment
Chicago Null: no effect of
charter attendance on maths improvements; small negative effect on reading improvements. Positive: charter school students’ likelihood of graduating high school higher by 7 percentage points and attending college higher by 11 percentage points.
Black students improve more in maths in charter schools than in traditional public schools.
The average impacts of charter schools for all students mostly range from null to small positive effects. An in-depth review of the literature by Dennis Epple et al. (2015) interpreted the research evidence overall as showing that some highly effective charter schools have significantly superior test score outcomes to traditional public schools, while the majority are not significantly different, and some are inferior.
An important feature of the charter school research is that the results vary with the size of the sample. Because the largest studies capture and aggregate a wide variety of schools, their results are muted. The largest studies are the CREDO studies, which report statistically significant, but relatively small positive average effects for hundreds of thousands of charter school students in multiple states. As smaller groups of students and schools are analysed, the results become statistically stronger and more educationally important. The 2015 CREDO study focusing on urban districts found effect sizes were stronger in both the positive and negative direction than the 2013 state-wide study, however there were more positive than negative effects and the positive effects were substantially larger.
However, even in studies where academic results are mixed, there is consistent evidence of superior outcomes for charter schools in school completions and college admissions. Epple et al. suggest this explains the popularity of charter schools with parents even where improved test scores are not achieved.30 A recent
study found students who attended charter schools in Chicago were 10 percentage points more likely to enrol in selective four-year colleges and were more likely to stay in college.31 Of course, there are school qualities
that are not measured which parents may value and seek in charter schools.
While this overall assessment is encouraging, the more interesting and useful findings in the data on charter schools relates to which schools have the biggest positive impacts, and for which students.
Characteristics of high impact charter
schools
Highly effective charter schools tend to be those that encapsulate the approach described as ‘no excuses’ schools — schools with a focus on traditional maths and reading instruction, frequent testing, strict discipline and behaviour standards, and often with a longer school day and year.32
They selectively recruit highly motivated and committed teachers and have a culture of high expectations of both students and staff.33 These school characteristics
are more likely to be found in charter schools than traditional public schools largely because of the employment conditions stipulated for unionised teachers in public school systems that limit working hours and do not allow schools to negotiate higher teacher salaries for longer hours or for meeting performance goals. Charter schools do not generally have these restrictions on their operations.
One of the most successful and well-known networks of charter schools is the Knowledge is Power Program (KIPP) schools. Studies have consistently shown KIPP students significantly out-perform traditional public school (TPS) students, and that this is not due to attrition of low performers.34 Other successful charter
school networks are the Aspire, Achievement First, IDEA, Success Academies, and Uncommon schools, all of which are run by CMOs.
Box 2: Knowledge is Power Program (KIPP)
The KIPP Foundation is one of the largest charter management organisations in the United States and was originally founded by veterans of the Teach for America program. The KIPP model is centralised and emphasises traditional teaching methods in math and English, strong discipline, hard work for students and longer school days and school years.35 These are common characteristics of charter schools, especially those serving largely
low income and minority students. This approach is encapsulated in the ‘Five Pillars’ — high expectations, choice and commitment, more time, power to lead and focus on results — that culminate in a 'Commitment to Excellence’ contract that students, parents and teachers sign.36
Angrist et. al. (2011) examined the impact of the KIPP model in a middle school in Lynn, Massachusetts, which has a high proportion of Hispanic, ESL and special education students. As the school is over-subscribed, the student intake is determined by lottery, which provides data that is less likely to be subject to selection bias.37
Nearly 80% of the student body come from households with a low enough income to make them eligible for free or reduced-price school lunches.38
The study finds small improvements in reading scores overall but moderate improvements for ESL and special education students. Similarly, there are moderate improvements in overall maths achievement, and slightly larger still improvements for ESL and special education students.39
Another study by Tuttle et. al. (2010) examines 22 charter middle schools run by KIPP. Students who attended these schools had achievement levels below the local school district average prior to attending KIPP. The authors find that, firstly, students in most KIPP schools experience positive gains in reading and maths achievement and, secondly, these effects are substantial.40
Aspire Public Schools is a non-profit charter management organisation that currently operates 38 schools, predominantly in California and more recently in Tennessee, serving 14,600 students across all grades.41 Like KIPP, Aspire uses a model in which
management responsibility, support and control are highly centralised, with both management models and school design consistent across all sites.42 Aspire schools
have longer school days and a longer school year, with classes often being held on Saturdays.43 Aspire schools
collectively outperform every large California school district with a majority of low income students in the Californian Academic Performance Index.44 Aspire’s
motto is “College for Certain”, and 2014 was the fifth consecutive year in which 100% of graduating seniors were accepted into four year colleges.45
Another similar success story can be seen in IDEA Public Schools, a charter management organisation which operates 36 schools in Texas, serving more than 20,000 students. Like KIPP, IDEA was founded by Teach for America alumni and uses a comparable approach to KIPP and Aspire from a management perspective, which has become increasingly centralised over time.46 Like
Aspire, IDEA uses IT in a ‘blended learning’ model and is strongly focused on college preparation. All students take Advanced Placement courses.47 Another major
focus of IDEA is its recruitment; offering salary bonuses to teachers in high demand disciplines, teachers with advanced degrees, and for years of service.48 IDEA
schools have sent around 99% of its graduates to college in all seven years of graduating classes.49 IDEA
schools on average achieve above the state and local school averages in state exams.50
Achievement First is a CMO operating 30 public charter schools with 10,000 students across all grades in Connecticut and New York states. The majority of
students (88%) are low income, and 99% are African-American or Hispanic. Admission is by a blind lottery system.51 Achievement First schools have a strict
academic and discipline culture, which again sees a longer school year, with tuition available outside school hours and on Saturdays. Generally, this additional time is devoted to mathematics and reading.52 The stated
aim of the Achievement First school network is to close the race and income achievement gap and test scores indicate this goal is being met. The Connecticut and New York state-wide test scores show proficiency achievement levels in Achievement First schools were mostly at or above the state average for all students for reading, maths and science, and well above the proficiency achievement rates for schools with similar demographics.53
Both the 2015 CREDO study and a number of other studies (see Table 5) have reported especially strong charter school performance in the state of Massachusetts, but more particularly in the city of Boston. A research partnership between Harvard University, the Massachusetts Department of Elementary and Secondary Education and the Boston Foundation has been studying the progress and performance of charter schools in the state since 2009.54 Charter schools in
Massachusetts have 60% non-white students, compared with 30% non-white students in other schools.
Similar to other research, the studies found some charter schools were more successful than others; in particular, charter schools in urban areas that enrol more students with socio-educational disadvantages. The studies found these schools tend to have longer school days, spend more time on reading and maths, and are more likely to identify with the ‘No Excuses’ approach to education.55 Across all US states, around
In Massachusetts, around 70% of charter schools have extended learning time.56 A report on Massachusetts
schools by Sir Michael Barber and Simon Day found that Boston’s charter schools have been major pioneers of the increased freedoms and flexibilities that have since been extended to other schools in the public school system with positive impacts on achievement. Barber and Day recommend lifting the cap on charter school numbers to enable the most successful CMOs to reach more of the most disadvantaged students.57
Segregation, equity, and heterogeneous
effects
One of the key objections raised to the proliferation of charter schools is their effect on racial segregation and socio-economic equity, as well as whether charter schools have heterogeneous effects (where different student sub-groups will experience different impacts). Much of the literature surveyed examines segregation and equity to some degree.
Charter schools are seen as a partial antidote to equity issues. Figures 8 and 9 below show the differences in geographic location of charter schools compared with non-charter schools (traditional public schools and private schools).
Unlike in Australia, disadvantaged communities tend to cluster in urban areas. Hence the difference in charter schools location is also significant: it shows they are more likely to exist in areas of need.
Another criticism levelled at charter schools is that their results are due to ‘cream-skimming’; that is, they attract the ‘best’ students from the public system and have a high attrition rate of low performers.
Steele et. al. (2011) takes a close look at New Orleans, where the school system underwent a massive overhaul led by the Louisiana government after the disaster of Hurricane Katrina in 2005. Schools remain heavily segregated by race in charter schools, but it is a pattern of segregation that existed prior to the hurricane because the existence of selective-admission public schools favoured white students.58
Zimmer et. al. (2009) find that the racial composition of charter school students in the areas they study (Chicago, Denver, Milwaukee, Philadelphia, San Diego, Florida, Ohio and Texas) does not differ significantly from the demographics of the TPS they transferred from. Additionally, they do not find evidence for systematic cream-skimming.59 Examining the achievement of racial
sub-groups of students yields statistically insignificant and inconsistent findings.60
Booker et. al. (2009) find the racial and ethnic composition of charter schools is nearly identical to the traditional public schools the students leave behind.61
Academic achievement for charter school transferees is only slightly different from that of the district and that of the local TPS,62 and the authors conclude that there is
no evidence for selectivity.63
Likewise, there is no evidence charter schools discriminate against children with educational challenges. Studies in New York and Denver found that while charter schools enrol, on average, lower proportions of English Language Learners (ELL) and students with disabilities, these gaps are not due to charters actively excluding these students. The lower rates of enrolment of children with disabilities in charter schools are because fewer children with disabilities apply to charter schools (perhaps because of funding differences) and charter schools are less likely to diagnose or classify students as having a disability.64
The 2013 CREDO study examines the demographics of charter school students across 27 states. It finds no evidence to confirm charges of selectivity, instead finding that charter schools were increasingly likely to enrol the most challenging students. Charter schools were found to educate a higher percentage of students in poverty than traditional public schools on average. About half of TPS students are white, whereas just over a third of charter school students are white, while black and Hispanic students are over-represented relative to TPS.65 At the district level, charter schools tend to have a
similar proportion of students in poverty to the local TPS, but white students are under-represented in charter schools relative to the local TPS.66 On the issue of
cream-skimming, the authors state that “the demographic trends… point to more challenging students, not less”
Source: National Alliance for Public Charter Schools
Figure 8: Charter schools by location, 2011–12
Source: National Alliance for Public Charter Schools
and that this “run[s] counter to the notion of selectivity on prior education performance”.67
As summarised in Tables 4 and 5, sub-groups of students who are considered under-served by traditional public schools seem to do better in charters. The CREDO reports present differences between charter school and TPS enrolments in terms of the number of days of extra learning.
● For students in poverty, those who attended charters had an average of 14 additional days of learning in reading compared to those in TPS; for maths it was 22 additional days.68
● For English language learners, those who attended charters had an average of 43 additional days of learning compared to those in TPS; for maths it was 36 additional days.69
● For black students, those who attended charters had an average of 14 additional days of learning in both reading and maths. For black students in poverty, additional learning gains were 29 days in reading and 36 days in maths.70
● For Hispanic students, learning gains at charter schools and TPS are similar. But for Hispanic students in poverty, those who attended charter schools had an average of 14 days of learning in reading compared to those in TPS; for maths it was 22 additional days.71
Overall, the evidence suggests charter schools do not increase segregation on the basis of race, wealth or ability beyond what is present in TPSs. While there is some academic dispute about the days of learning measure, the data on achievement suggest charter schools are better for some student sub-groups than others.72
Selection bias in charter schools research?
A challenge to the evidence on charter school achievement is that it is the result of self-selection, i.e. parents who value education are more likely to value school choice and the option that charter schools provide.73 The students who decide to enrol in charter
schools or apply for a lottery position in a charter school may be different in ways social science can’t necessarily identify but which influence how well they do in school. The assertion is that this can make charter school achievement seem better than it really is, even when observable characteristics such as parental income and education have been controlled for.
While this is a plausible argument about charter school effects, it does not undermine them completely. Numerous studies have compared students who obtained a place in a charter schools via a lottery with students who entered the lottery but missed out. This methodology replicates a randomised control trial where students are randomly allocated into charter schools, therefore eliminating selection bias.
Similarly, when failing public schools are taken over by charters and the students are ‘grandfathered’ — that is, guaranteed a place — in the new school, this can show the effects of the charter school on student achievement contrasted against the traditional public school model. Abdulkadiroğlu et. al. (2014) examine the impact of takeovers in New Orleans and Boston, and find these highly disadvantaged yet ‘passively enrolled’ students experience gains in student achievement broadly similar to the gains experienced by students who participate in active charter school applications and lotteries.74
Figures 11 and 12 show students in municipal schools greatly outnumber students in independent schools in both the compulsory and upper secondary sectors, indicating that although upper secondary independent schools are more numerous they have smaller enrolments.
Figure 12: Number of upper secondary students in municipal schools versus independent schools
Source: Facts and figures 2012: Pre-school activities, schools
and adult education in Sweden, Skolverket, 2013
Swedish free schools have a few important characteristics. Firstly, they cannot charge top-up fees76 — any
improvement or profit (in the case of schools m anaged by companies) must arise from attracting more students and improving efficiency and economies.
Secondly, they cannot discriminate on the basis of academic prowess, or any other kind of skill or attribute. Children are enrolled in order of application.
Thirdly, the school choice/competition policy is available to all Swedish children,77 not simply ones
from a disadvantaged background. There is still some regulation — free schools must teach an approved curriculum and have their establishment approved by a central school authority.
According to Böhlmark and Lindahl, the potential benefits of the Swedish education system of free schools and vouchers can be divided into two categories. One is the ‘private attendance effect’— the individual school benefits that accrue from reallocation of resources and students to private schools that are inherently more efficient and deliver better outcomes.78 This often implies
no impact (at best), or a negative impact, on students in poorly-performing schools who are ‘left behind’.
The other is the ‘competition effect’ — where basing school funding on vouchers and allowing various providers into the system simultaneously means schools (including public schools) have to compete with each other, driving innovation and improving outcomes for all students.79
Friskolor
Sweden is known for having one of the most decentralised systems of schooling in the developed world. This is because of wide-ranging and revolutionary reforms to the Swedish education system that took place in the early 1990s, which introduced two fundamental themes to schools policy. These were: competition, through the introduction of portable per-student funding and ending compulsory local school attendance; and choice, through allowing the establishment of privately managed ‘free schools’ (friskolor) where students could enrol using the full funding entitlement available to them in municipal/ public schools.75 This funding mechanism is essentially
a ‘voucher’ system. Free schools can be established by either non-profit or for-profit organisations.
Figure 10: Number of municipal schools versus independent schools, 2011–12
Sweden
Source: Facts and figures 2012: Pre-school activities, schools
and adult education in Sweden, Skolverket, 2013 Figure 10 shows that there are more municipal (traditional public) schools than independent schools overall but that independent schools slightly outnumber municipal schools in the upper secondary sector.
Figure 11: Number of compulsory-level students in municipal schools versus independent schools, 2001-12
Source: Facts and figures 2012: Pre-school activities, schools
Table 6: Summary of studies estimating the impact of Swedish school reforms on student achievement
Study Areas/
subjects examined
Main Findings Attribution
(attendance effect or competition effect) Other Findings (e.g. heterogeneous effects) Does school competition matter? Effects of a large-scale school choice reform on student performance (Ahlin, 2003) Math, English, Swedish Statistically significant positive effects at mean on maths performance (five percentiles) but no significant effects for English and Swedish
Competition effect
Immigrant students and special needs students gain more in maths; students from a low-education household are somewhat adversely affected in English and Swedish Education, equality, and efficiency – an analysis of Swedish school reforms during the 1990s (Björklund et. al., 2004)
Maths, English, Swedish (Same dataset as Ahlin, 2003)
Students attending private schools perform better across the board than their publicly-educated counterparts
Attendance
effect No different impacts (positive or negative) for foreign-born students or students with low-educated parents The Impact of School Choice on Pupil Achievement, Segregation and Costs: Swedish Evidence (Böhlmark and Lindahl, 2007) Natural sciences, social sciences, English and maths
An increase in the private-school share by 10
percentage points increases average pupil achievement by almost 1 percentile rank point Very small attendance effect; mostly competition effect
Private school students are also more likely to be second-generation immigrants and to have parents who are university educated Does School Privatization Improve Educational Achievement? Evidence from Sweden’s Voucher Reform (Böhlmark and Lindahl, 2008) Math, English, sciences and social sciences An increase in the private school share by 10 percentage points is expected to increase average GPA by nearly 1 percentile rank point
Mostly competition effect
There is a positive impact on the fraction of students who choose an academic track in post-compulsory school
Independent Schools and Long-Run Educational Outcomes: Evidence from Sweden’s Large Scale Voucher Reform (Böhlmark and Lindahl, 2012)
Maths and
English A 10 percentage point increase in the share of independent-school students in compulsory school is associated with 1.7 percentile rank higher achievement at the end of compulsory school.
Competition
effect Independent school type or management type does not have an impact on student achievement
Evidence on student achievement
Has the proliferation of free schools in Sweden led to average improvements in student outcomes? If it has, are there particular sub-groups of students for whom there has been additional improvements or for whom there has been a decline in performance (heterogeneous effects)? Is there evidence that free schools gain while public schools lose, or that the type of free school (e.g. whether it is managed on a non-profit or for-profit basis) has an impact on the magnitude of effects? Overall, this review of the literature suggests there is a small positive impact of free school attendance on attendees, but there are benefits to all students as a result of increased competition. Few studies examine whether free school
management type (i.e. whether it is non-profit or for-profit) impacts student outcomes, except for Böhlmark and Lindahl (2012) who find it seems to have no impact.
International assessment decline
Recent commentary on the state of schooling in Sweden suggests the proliferation of free schools (and for-profit free schools in particular) is to blame for Sweden’s significant decline in ranking on international testing, particularly PISA.
At the most basic level, there is a correlation. But this does not mean there is a causal link. Little research has been done to ascertain definitively what is causing
the decline, but Böhlmark and Lindahl (2012) found no support for the notion it can be attributed to free schools. There are other theories. Sweden’s Ministry of Education and Research posited in a 2011 background paper for the OECD that the increasing likelihood of teachers being drawn from the lower-ability end of the spectrum could be part of the story.90 The paper also suggested
the trend towards self-directed learning (where less learning happens in the structured environment of the classroom and more happens at home and is more self-guided) could play a role, as this enables parental and home factors (which vary in how conducive they are to effective learning) to exert more influence on a student’s prospects.91
Tino Sanandji has pointed to a few other factors, such as a change in pedagogy and school environment: fewer hours spent in class instruction and doing homework, lax discipline, and a decline in teacher authority. He suggested the fact that free schools cannot innovate in curricula or have a say in the pedagogical methods teacher training imparts hobbles their ability to improve outcomes, while “product innovation is how free markets produce real gains, not by optimising the janitorial schedule.”92
Gabriel Sahlgren (2015) argues that the introduction of school choice in Sweden in the 1990s coincided with a widespread change to the dominant classroom pedagogy from traditional, teacher-led methods to progressive pupil-led methods and this may be responsible for the decline in achievement.93
Segregation and equity
Critics and sceptics of Swedish school reform typically highlight a few key areas where the proliferation of free schools is associated with negative impacts overall. The most common arguments are that:
● Free schools and school choice increase segregation of students (along ethnic and/or socio-economic lines)
● The public system and the students who remain in public schools are worse off due to fewer resources and an alleged ‘cream-skimming’ effect of more gifted students
● The proliferation of free schools is the reason for Sweden’s significant decline in international assessment rankings
The majority of the empirical evidence focuses on the first two issues.
Segregation
The evidence on whether school choice and competition promote segregation of students along various lines is mixed. Most studies examine segregation alongside a broader analysis of school choice impacts.
Anders Björklund and colleagues (2004) found an increase in inter-school variance along immigrant status, parental income and parental education lines, but they could not determine whether such segregation had an effect (either positive or negative) on student outcomes.80 This is reiterated in Anders Böhlmark and
Mikael Lindahl’s study (2007).81
Two further studies, one by A. Lindbom and E. Almgren (2007) and the other by Oskar Nordström Skans and Olof Åslund (2009) that examine segregation on its own (rather than as part of a broader analysis of school reform impacts) concluded growing student segregation was a consequence of an increase in residential segregation rather than a consequence of school reform.82
An OECD background report prepared by the Swedish Ministry of Education and Research in 2011 affirms this conclusion. It states that most students still attend schools that are nearby in spite of the availability of school choice, and attributes the increase in school segregation to an increase in residential segregation along ethnic lines.83
However, to acknowledge school segregation arguably exists is not to suggest that it necessarily causes problems, either in terms of social cohesion or in terms of student outcomes.
‘Left behind’?
Some studies that examine the impact of school reform examine only what Böhlmark and Lindahl (2007) call the aforementioned ‘private attendance effect’, which does not capture the spillover effects of increased competition, the benefits of which accrue to all students. There is scant evidence to suggest school choice and competition leave students in public schools worse off. Böhlmark and Lindahl (2007) estimate “an increase in the private school share by 10 percentage points would generate 1 percentile rank points higher achievement on average”.84 Of this, the private school attendance
affect is only 0.1 percentile rank point — the benefits of competition apply to all. A further study confirmed the magnitude of the attendance effect to be just under 1 percentile point, an effect the authors judge to be small.85
Though the short-term effects on academic achievement described in Böhlmark and Lindahl (2008) were not large, the results of the long-term follow-up by Böhlmark and Lindahl (2012) suggest “a 10 percentage point increase in the share of independent-school students in compulsory school is associated with 1.7 percentile rank higher achievement”.86 This study also found
positive effects from school competition in the vicinity of 2 percentile points, on the fraction of students in an academic track in post-compulsory school, academic achievement in post-compulsory school, and the fraction of students proceeding to tertiary study.87
S. Tegle (2010) also found a similar result: a 10% increase in the share of students in free schools increases the GPA for the whole municipality by up to 2%.88
It is possible, though unlikely, that these mean effects mask what must be a large increase in achievement for free school students and a significant, though lesser, decrease in achievement for public school students. Björklund et. al. (2004) also found there was no reason to suggest students are hurt by competition from private schools.89 In sum, there is little evidence to back up the
claim that competition and choice leaves public school students worse off.
Independent schools
The Chilean experience is not entirely analogous with the charter school scenario in other countries but it is instructive in this instance as it is often invoked as an example of the failure of school choice in general, and for-profit schools in particular.94
Chile introduced school choice through a system of government-funded ‘vouchers’ —portable student funding entitlements — in 1980. The vouchers were broadly sector-neutral to encourage non-government providers (some non-profit, some for-profit) to enter the market for education.95 In Chile, opening the education sector to
non-government schools coincided with a broader focus on school choice through the voucher scheme. As such, many of the studies outlined in this section discuss school choice and school vouchers rather than non-government schools per se.
Figure 13 shows the school sector which has undergone the most growth is the for-profit voucher school sector. Public schools have shrunk in number and non-profit voucher schools have grown only slightly. Figure 14 shows that these trends are similar in student enrolment as well.
Two aspects of Chilean policy are at odds with charter school policy in other countries. Firstly, voucher schools (though not public schools) are allowed to charge top-up fees.96 Secondly, voucher schools can be selective in
which students they accept.97
In the US and Sweden, charter/free schools must either admit students on a first-come, first-serve basis or a lottery basis, thus reducing the school’s ability to be selective with its student body. This means Chilean voucher schools are in practice more similar to non-government schools in Australia than to charter/free schools.
Chile
Evidence on student achievement
Table 7 reveals that of the papers examining the impacts of Chilean school policy, four report small to moderate improvements in test scores for students in voucher schools and also across the board. Additionally, Bravo et. al. (2008) find positive impacts on school retention and wages for students who used school vouchers to attend the school of their choice.98 Conversely, Hsieh
and Urquiola (2006) find no evidence of improvements in student academic outcomes.99
Segregation and equity
The review of the Chilean evidence suggests that the design of voucher school policy in Chile (as well as perhaps some other contextual factors; Chile was still under military dictatorship when this policy was implemented and did not begin to democratise until the late 1980s) has led to increased segregation in some areas and in general has not caused more equitable educational attainment.
In addition to their findings on student achievement, Hsieh and Urquiola found school choice led to an increasing concentration of disadvantaged students in the public system as middle-class students exited in favour of the private system.100
Auguste and Valenzuela (2006) found that in spite of school competition having a positive effect on average test scores, this average increase masked increased segregation of students based on test scores as well as family characteristics.101 The otherwise positive findings
of Bravo et. al. (2008) contrast with the finding that the non-poor benefit more from the policy than the poor.102
Conversely, Gallego (2006) found it is not school choice that leads to increased inequality, but rather that schools of choice are not present in some areas, and public schools can be insulated from the incentives created from competition.103
Source: Gregory Elacqua, The Impact of School Choice and
Public Policy on Segregation, 2009.
Figure 13: The growth of private schools in Chile,
1990 and 2008 Figure 14: The growth of private school enrollment in Chile, 1990 and 2008
Source: Gregory Elacqua, The Impact of School Choice and