COMPETITIVE EFFECTS OF MEANS-TESTED SCHOOL VOUCHERS David N. Figlio
Cassandra M.D. Hart Working Paper 16056
http://www.nber.org/papers/w16056
NATIONAL BUREAU OF ECONOMIC RESEARCH 1050 Massachusetts Avenue
Cambridge, MA 02138 June 2010
This research was supported by funds from the Florida Department of Education, the U.S. Department of Education under the aegis of the National Center for the Analysis of Longitudinal Data in Education Research, and the National Institutes of Child Health and Human Development. The second author was supported by an Institute for Education Sciences predoctoral training grant. We are grateful to the Florida Department of Education and the Scholarship Funding Organizations (Carrie Meek Foundation, Children First Florida and Florida P.R.I.D.E.) for providing the micro-level data necessary for this analysis, as well as considerable technical and programmatic support and advice, and we thank the school districts that provided us with the aggregate data necessary for our supplemental analyses. We appreciate the helpful comments of Sherrilyn Bilger, Rajashri Chakrabarti, Dennis Epple, Maria Ferreyra, Jon Guryan, Jeff Henig, Larry Kenny, David Myers and Miguel Urquiola, as well as seminar participants at Carnegie Mellon University, the Federal Reserve Bank of New York, Iowa State University, Michigan State University, National Bureau of Economic Research, New York University, Northwestern University, Stanford University, University of Chicago, University of Florida, University of Illinois-Urbana-Champaign, University of Kentucky, University of Maryland-Baltimore County, Upjohn Institute, Uppsala University, and Vanderbilt University/National Center for School Choice, and participants at the annual meetings of the American Economic Association (2010), American Education Finance Association (2010), Association for Public Policy Analysis and Management (2009), Society for Research on Education Effectiveness (2010) and Southern Economic Association (2009). All opinions and errors are our responsibility, and do not necessarily reflect the views of the Florida Department of Education, the U.S. Department of Education, the National Institutes of Health, or the National Bureau of Economic Research.
NBER working papers are circulated for discussion and comment purposes. They have not been peer-reviewed or been subject to the review by the NBER Board of Directors that accompanies official NBER publications.
NBER Working Paper No. 16056 June 2010
JEL No. I2,I21,I22
ABSTRACT
We study the effects of private school competition on public school students’ test scores in the wake of Florida’s Corporate Tax Credit Scholarship program, now known as the Florida Tax Credit Scholarship Program, which offered scholarships to eligible low-income students to attend private schools. Specifically, we examine whether students in schools that were exposed to a more competitive private school landscape saw greater improvements in their test scores after the introduction of the scholarship program, than did students in schools that faced less competition. The degree of competition is characterized by several geocoded variables that capture students’ ease of access to private schools, and the variety of nearby private school options open to students. We find that greater degrees of competition are associated with greater improvements in students’ test scores following the introduction of the program; these findings are robust to the different variables we use to define competition. These findings are not an artifact of pre-policy trends; the degree of competition from nearby private schools matters only after the announcement of the new program, which makes nearby private competitors more affordable for eligible students. We also test for several moderating factors, and find that schools that we would expect to be most sensitive to competitive pressure see larger improvements in their test scores as a result of increased competition.
David N. Figlio
Institute for Policy Research Northwestern University 2040 Sheridan Road Evanston, IL 60208 and NBER figlio@northwestern.edu Cassandra M.D. Hart Northwestern University cassandra.hart@u.northwestern.edu
1. Introduction
School choice options—including both voucher and neo-voucher options like tuition tax credit funded scholarship programs—have become increasingly prevalent in recent years
(Howell, Peterson, Wolf and Campbell, 2006). One popular argument for school choice policies is that public schools will improve the education they offer when faced with competition for students. Because state funds are tied to student enrollment, losing students to private schools constitutes a financial loss to public schools. If schools face the threat of losing students--and the state funds attached to those students--to private schools, they should be incentivized to cultivate customer (i.e., parental) satisfaction by operating more efficiently and improving on the outcomes valued by students and parents (Friedman, 1962). Alternatively, vouchers may have unintended negative effects on public schools if they draw away the most involved families from public schools and the monitoring of those schools diminishes, allowing schools to reduce effort put into educating students (McMillan, 2004).1
It is notoriously difficult to gauge the competitive effects of private schools on public school performance because private school supply and public school performance affect each other dynamically (Dee, 1998; McEwan, 2000). In cross-section, the relationship between private school supply and public school performance could plausibly be either upward-biased or downward-biased. On the one hand, private schools may disproportionately locate in
communities with low-quality public schools. In such a case, the estimated relationship between private school penetration and public school performance would be downward-biased. On the other hand, if private schools locate in areas with high valuation of educational quality, then the presence of private schools could be correlated with unobservable features of public school
quality and public school student performance, and the estimated relationship between private schools and public school performance would be upward-biased.
This paper takes advantage of the introduction of a major new school voucher program – one of the largest in the United States and the largest in terms of the number of low-income students served-- to directly study the competitive effects of school vouchers on student
outcomes in public schools. The Florida Tax Credit Scholarship Program (FTC; formerly called the "Corporate Tax Credit Scholarship Program") offers assistance to students eligible for free or reduced-price lunches at school (that is, those with family incomes below 185 percent of the federal poverty line) to attend private religious or non-religious schools in the state.2 To qualify for a voucher, students must have spent the entire prior year in a Florida public school (or be entering kindergarten or first grade) in addition to being low-income. Vouchers need not cover all of the costs of attending private schools, and parents are free to send their children to any private school regardless of the share of tuition and fees covered by the voucher. The voucher, however, is quite generous relative to the costs of attending religious private schools; the $3,500 voucher size at the program's introduction3 was about 90 percent of elementary-grade tuition and fees at a typical Florida religious private school.4 And the policy change was very large for the target population -- the number of scholarships available was larger than half the size of the low-income population using private schools on the eve of the policy's introduction. For low-low-income Floridians, the voucher represented a major demand shock for private schooling. Florida's experience with this policy is particularly important because similar policies are being
2
Through 2009-10, participants may keep their voucher if family income rises above 185 percent of the poverty line so long as family income stays below twice the poverty line.
3 The size of the voucher in 2009-10 was between $3,950 and $4,100 depending on whether the student is new to the program or a returning participant. In 2010 the Florida Legislature passed a law that would increase the generosity of the voucher program, expand the number of students eligible to participate, and increase the income levels at which eligible participants could continue to receive a voucher.
considered at the time of writing in Maryland and New Jersey and recently enacted in Indiana as of 2010-11, and a bill to establish a similar policy in Chicago was just defeated in the Illinois Legislature. Clearly, this form of voucher program has the potential to expand considerably over the coming years in the United States.
We specifically examine whether students in schools that face a greater threat of losing students to private schools due to the introduction of tuition tax credit scholarships improve their test scores more than do students in schools that face less pronounced threats. We use the
introduction of the FTC program as a source of exogenous variation that dramatically increased the potential demand for non-public school options after 2001, when the policy was announced, by lowering the effective cost of private school attendance for eligible students. We examine whether test scores improved more in the wake of the new policy for students attending public schools with more (or more varied) nearby private options that suddenly became more affordable for low-income students, than did scores for students attending schools with fewer (or less varied) potential competitors.
This is possible because of the considerable variation in potential competition faced by schools across the state of Florida. Prior to the introduction of the program, some communities in Florida had a much richer and more diverse set of private school options than did other communities. We suspect that public schools in these communities may have experienced more competition at the outset of the program, causing them to respond differently from schools with fewer potential competitors. Because we are identifying off of a policy change, we do not rely on cross-sectional variation to estimate the effects of private school competition on public schools, but rather apply a differences-in-differences modeling strategy. We find evidence that public schools subject to more competitive pressure from private schools raised their test scores
the most following the introduction of Florida's voucher program.5 Therefore, while the state caps the number of program participants at a small fraction of the overall student body, the magnitude of the program nonetheless appears to be large enough to generate substantive public school responses.
In addition to employing a stronger identification strategy than most past work, our analysis also uses the timing of the roll-out of the policy to isolate the effect of competitive pressure per se from other potential effects that voucher policies may have on public schools. A simple pre-post comparison of the extent to which private school penetration was associated with public school performance would typically conflate three distinct aspects of the effects of the voucher on public schools. In addition to the competitive effect of the voucher that we seek to identify, there is also a composition effect -- if vouchers change the composition of the public schools, and if peer effects are important,6 then the voucher effect on public schools would also include the changes in performance associated with the composition of the school changing. Furthermore, if vouchers influence the resources available to a school, then the voucher effect will capture these changes in resources as well.
We are able to separate the competition effect from the other two effects of vouchers because of the timing of the voucher roll-out. For a year following the announcement of the policy, students were applying for vouchers for the following school year, but no students had yet
5 Indeed, we find evidence that the effects of the voucher program are generalized to the school's overall population. There is reason to believe that competitive effects would generalize if it is difficult to target additional attention to groups of students on the basis of categories such as free-or-reduced-price lunch eligible, or if parents rely on overall indicators of school quality, such as average test scores or state-administered school grades, to judge quality. Both seem highly plausible; the evidence on voluntary donations to schools (Figlio and Kenny, 2009) shows that Florida families' contributions to schools are highly related to school grades, especially for schools serving low-income families.
6
See Epple and Romano (forthcoming) for a comprehensive review of the peer effects literature. Lavy (2009) suggests one particular avenue through which composition effects may operate; his study of public school choice in Israel indicates improvements in behavioral as well as academic outcomes under school choice, including reduction
left the public school on a voucher. Therefore, any public school changes in this first year of the program, when public school students were applying for vouchers but before they actually used them, can be thought of as a pure competition effect of vouchers.7
We are also able to exploit key aspects of the policy environment to obtain further evidence of the competitive effects of school vouchers. First, because the voucher is for a fixed amount regardless of the level of the school, the voucher covers a dramatically larger portion of the tuition and fees at elementary and middle schools than at high schools. For the set of voucher participants for whom we can observe information on actual tuition and fees charged (those residing in roughly the southern half of Florida), out-of-pocket costs for families using vouchers are typically over three times higher for high school students than for elementary school students. And indeed, the overwhelming majority of students who have left the public schools to attend a private school using a voucher in Florida have been elementary and middle school students (Figlio, Hart and Metzger, 2009). Hence, one would expect larger competitive effects of vouchers at the lower schooling levels than at the high school level.
Second, the federal Title I program provides generous additional cash assistance, levied on a student-by-student basis, as well as substantially increased flexibility as to how to spend it, to schools with relatively high levels of students eligible for free or reduced-price lunches. Title I funds are paid to school districts, which in turn allocate resources to schools, and district policies directing how schools receive those supplemental funds vary dramatically. The
7
It is possible that the results could be driven by low-income students working harder in the "pure competition" year to help to attain a place in a private school. However, we find little evidence of differential effects for low-income versus higher-income students, indicating that our estimates are likely best considered to be generalized performance effects of the program. We also observe little evidence of strategic entry into the public schools of families seeking to "game the system" by attending public schools for a single year. Among students observed selecting out of the public schools to attend a private school using the voucher program, only about five percent had spent just one year in Florida prior to using the voucher. Given that some of these students may have come from out of state, this is at
program's generosity levels were increasing monotonically beginning in 1999-2000, leading some school districts to provide Title I assistance to schools higher in the income distribution than before. The overall effect of the funding change between 2001-02 and 2002-03 was to increase the statewide percentage of schools receiving Title I funds by five percent, with larger changes in some school districts; in Florida, these changes were largely not due to the No Child Left Behind Act, which increased Title I funding in 2002-03 in areas that benefitted smaller fractions of Florida schools than elsewhere.8 Nonetheless, the increases in Title I funding observed in Florida were consistent with a secular trend toward increasing numbers of schools eligible for Title I funding. We suspect that the schools that stand to become Title I schools and experience a dramatic increase in discretionary revenues if they do not lose many of their free or reduced-price lunch students are the schools that would be the most likely to respond to the competitive threats embedded within the voucher policy. We find evidence that the schools facing higher levels of competitive threat or greater financial incentives to retain low-income students were the schools more likely to respond to the competitive threat of school vouchers. The fact that we observed generalized improvements in school performance in response to the competitive threats of school vouchers, even in a state with rapid population growth, provides strong evidence that voucher competition may have effects elsewhere.
2. Comparison with the existing literature
A number of researchers have estimated the relationship between private school penetration and student outcomes -- either test scores, graduation rates, or grade completed -- using effectively cross-sectional variation; examples include Arum (1996); Dee (1998); Hoxby
8 That said, the appropriations law that codified the increases in Title I funding was signed by President Bush on January 10, 2002, meaning that Florida schools may have responded not only to expectations of further secular
(1994); Jepsen (1999); and Sander (1998) in United States settings, and Andersen and Serritzlew (2005) abroad.9 Most of these studies have found either modestly positive, or null or
inconsistent effects of private school competition on public school students’ educational
outcomes (Belfield and Levin, 2002; McEwan, 2000). These studies use a variety of estimation techniques to attempt to overcome the simultaneity problem; while some studies rely on OLS with covariates to adjust for possible omitted variables (Arum, 1996), most use some form of instrumental variable analysis (Dee, 1998; Jepsen, 1999; Sander, 1998). Some studies use population-level demographic data as instruments for private school attendance (Couch, Shughart, and Williams, 1993), but most use some measure of the density of the Catholic population in a given area (Dee, 1998; Hoxby, 1994; Jepsen, 1999; Sander, 1998) The rationale is that larger populations of Catholics in a given area increase the likelihood that the Catholic church will expend resources in that area to support a private Catholic school (Dee, 1998; Hoxby, 1994; Jepsen, 1999). However, there are reasons to question the validity of religious concentration as an instrument for private schooling (Altonji, Elder and Taber, 2004), and studies relying on cross-sectional variation in private school concentration in a community are subject to the usual omitted variables and reverse causation problems. In addition, Catholic shares might capture only a small fraction of the private school landscape in large swaths of the country, such as the south. For instance, in Florida, which runs the scholarship tuition program analyzed in this paper, 12.08% of private schools operating in 2001 were Catholic. By contrast, 13.44% were Baptist; 8.58% were evangelical, 8.25% were reported as Christian with no further identifying information, and 13.93% were non-denominational.
9
There exists an even larger related literature on the performance effects of the degree of traditional school competition. Well-known examples in this literature include Cullen, Jacob and Levitt (2005), Hoxby (2000) and Rothstein (2006) in the United States, and Clark (2009), and Gibbons, Machin and Silva (2008) in England. Hsieh
A few papers have taken a different tack and identified the effects of voucher programs directly on student outcomes in the public schools. Greene and Marsh (2009) study the effects of vouchers in Milwaukee, and find evidence of modest positive effects of private school
competition. However, the fact that in cross-section the degree of competition facing any given school in Milwaukee is relatively similar and over time could be due to endogenous changes in competition makes interpretation of evidence from Milwaukee more limited. Chakrabarti (2008) and Hoxby (2003) make use of school-level differences in a Milwaukee school's percentage eligible for vouchers, but one might be worried that schools with different levels of student eligibility may be fundamentally different, and there is no arguably exogenous selection mechanism. Other papers (e.g., Chakrabarti, 2007; Chiang, 2009; Figlio and Rouse, 2006; Rouse et al., 2007; and West and Peterson, 2006) estimate the effects of receipt of an "F" grade in Florida's school accountability system, because repeated receipt of the lowest grade triggered voucher eligibility for students under the Opportunity Scholarship Program. But while these papers find evidence that receipt of an "F" grade leads to improved student outcomes, it is
unclear to what extent these findings reflect the competitive effects of school vouchers versus the performance effects of accountability pressure. Bohlmark and Lindahl (2008) and Sandstrom and Bergstrom (2005) study the introduction of a voucher program in Sweden, but the principal available outcomes are grades, rather than objective measures of test performance. In addition, the Swedish evidence relies on changes in post-voucher private school enrollment for
identification, but expansion of the private sector is likely related to public school performance. West and Woessmann (2008) make use of cross-country variation to find that countries with more private schools have higher-performing public schools; they find evidence of a positive cross-sectional relationship between the private school penetration and public school
performance using historical Catholic shares as an instrument for private schooling. Gallego (2006) presents similar evidence using a cross-section of Chilean localities in which the historical stock of Catholic priests in a community serve as an instrument for current voucher schools.
The most similar work to ours in the present literature, a working paper by Chan and McMillan (2009) written simultaneously with our paper, studies the effects of a tuition tax credit that was phased in for two years in Ontario and then unexpectedly canceled. The authors take advantage of the fact that some public schools were nearby a larger number of private schools at the time of the voucher's introduction, an identification strategy that is fundamentally similar in key respects to our own. They find that once Ontario began offering its tax credit, initially valued at $700 and set to rise over time, public schools with a larger private school share in their catchment area improved their students' test-passing rates, but these gains were not sustained once the credit was ended.
The Florida Tax Credit Scholarship Program setting provides distinct advantages over studying the Milwaukee voucher program or Florida's Opportunity Scholarship Program. The voucher program being studied is not linked to an accountability system, so we are not
confounding voucher threats with accountability pressure, as is the case in studies that measure the effects of "F" receipt under Florida's accountability plan. And unlike studies of the
Milwaukee program, we are able to observe data both before and after the introduction of the voucher program, and take advantage of the fact that Florida is not a single educational market like Milwaukee, a relatively small city from a spatial perspective. Our ability to study the introduction of a voucher program at its outset, combined with our study of a state with a vast
considerable opportunities for causal identification of the effects of a school voucher program in the United States.
As mentioned above, our identification strategy is similar in nature to that of Chan and McMillan's (2009) working paper using data from Ontario. Like Chan and McMillan, we find evidence that the increased competitive pressure associated with school vouchers led to
improvements in public school performance. That said, our paper is distinct from theirs in a number of key ways. First, we are able to investigate the effects of a voucher aimed at low-income families, with a level of generosity that approaches the costs of sending a child to a religious elementary school. The Ontario tuition tax credit began at a level sufficiently small that it was unlikely to attract low-income families, and so was unlikely to lead to a demand shock for that population. Our paper looks at the effects of a voucher on the types of schools unlikely to be affected by the Ontario tax credit. Second, Florida's population is dramatically more disperse than is Ontario's, as it has more than twenty major population centers as opposed to six, affording us the ability to exploit a wider variety of cross-market differences in the nature of private school competition. Third, while in Ontario families already enrolled in private schools could collect tax credits, in Florida students must have spent a full year in the public schools to collect a voucher. This fact means that the Florida voucher would work through the attraction of new private school students rather than the subsidization of existing private school students.
We are also able to identify the effects of school vouchers for sets of schools that experience different levels of incentive to respond to changes in competitive pressure. We consider two specific dimensions – school grade span and district Title I policies—that we believe moderate the extent to which public schools will experience the voucher program as a threat. With regard to grade span, we posit that voucher competition is likely to be more intense
for elementary and middle schools, where the voucher covers a much larger fraction of the total tuition bill, than for high schools. With regard to Title I policies, we use differences in schools’ likelihood of receiving Title I funds based on student body composition and district policies to determine whether schools more at risk of losing Title I funds if they lose a few low-income students respond more sharply to the policy than those whose Title I status is not in question.
Finally, and most importantly, there was a year lag between when the policy was announced (and students began actively applying for the school voucher) and when students actually began attending private schools. Therefore, we are uniquely able to identify the pure competitive effects of private school vouchers, absent the composition and resource effects of vouchers. Taken together with the new Chan and McMillan (2009) findings, our results provide strong evidence of the potential effects of school vouchers on the public school system.
3. Florida Tax Credit Scholarships and the Private School Landscape in Florida The FTC Program, signed into law in 2001 and opened to students in the 2002-2003 school year, provides corporations with tax credits for donations that they make to FTC
organizations. These organizations, in turn, provide scholarships to students who qualify for free or reduced-price lunch and who either attended a Florida public school for the full school year before program entry, or who are entering kindergarten or first grade. With the exception of these early grade private school students, students already attending private schools in Florida are not eligible for first-time scholarships (though students who enter a private school on a scholarship are eligible to retain their scholarships in future years, so long as their family income remains below twice the federal poverty line.)
We exploit geographic variation in potential private school competition to estimate differential effects of this program. Because we want to employ an identification strategy that is not subject to reverse causation bias, we characterize geographic areas by the amount of private school competition in existence before the program was announced; we have no reason to believe that there was anticipatory entry by private schools, as the program had not been widely discussed for long prior to its announcement, and no students could attend private schools using a voucher in the year following announcement; students could only apply for school vouchers during that year. Thus, while there was increased entry into the private school market following the introduction of the program, our results do not identify program effects off of the entry of these new private schools.
To illustrate the nature of private schooling in the state of Florida on the eve of the
program's announcement, we examined parent reports of their children’s school attendance in the 5% microdata sample of the 2000 Census IPUMS. As seen in Table 1, private school attendance was fairly widespread overall; 11.4% of Florida students aged 6-17 attended private schools. Unsurprisingly, given the resource constraints of low-income students, private school attendance rates were dramatically lower for this group. Among students in income groups that would become eligible for the FTC program, only 5.4% attended private schools on the eve of the voucher.
One can see from Table 1 that metropolitan areas of Florida had very different levels of private school penetration, as well as very different degrees to which low-income students participated in private schooling prior to the introduction of the program.10 The share of low-income students attending private schools varied widely in different metropolitan areas, ranging from 1.4% attendance in Punta Gorda to 7.9% attendance in the Melbourne-Titusville-Cocoa-
Palm Bay area. Similar-sized metropolitan areas had very different levels of private school penetration; for instance, Ocala and Tallahassee were nearly the same size, but Ocala's low-income population share in private schooling was nearly twice that of Tallahassee's.
Interestingly, Tallahassee had a larger overall private school attendance share than Ocala, so the variation across metropolitan areas is even more nuanced. We employ both cross-metropolitan area and within-metropolitan area variation in private school penetration in this study, because the concentration of existing private schools is not uniform across a metropolitan area. This difference in penetration of private schools provides us with some degree of variation in the extent to which public schools in different areas face competitive pressure from private schools that could realistically entice away low-income students with FTC scholarships. We present information on within-metropolitan area differences in private school competition in the next section.
4. Data and Methods
4.1 Data: Our analysis draws on several sources of data from the state of Florida. The Florida Department of Education (FDOE) publishes public and private school addresses, including latitude and longitude measures for the public schools. The FDOE also publishes details on public schools such as the grades that they receive from the FDOE, the grade ranges that they serve, and the percent of their students that are subsidized lunch eligible. Identifying schools as elementary, middle or high school grades is important because we match private school
competitors to public schools based on their grade levels served. In the cases in which the FDOE did not report the grade ranges served, we deduced whether the school served elementary, middle
or high school grades based on the grades of observed test-takers in the school. The schools were then classified as elementary, middle, high, K-8, 6-12, or all grades.
The address information was geocoded using ARCGis software to generate the competition measures detailed below. Physical addresses were used to geocode private school locations, yielding valid locations for 85% of private schools. We used latitude and longitude data to locate the public schools, as this generated valid locations for a higher proportion of schools than did using physical addresses. The geocoding process generated valid data for 89% of the public schools, which were then matched to the student data.
Test scores and demographic characteristics for all students in Florida public schools are provided through FDOE's Education Data Warehouse. We also have information on the schools that students attended during the year. Some students attended multiple schools during the school year. Because we lacked information for the proportion of time students spent in each school, we randomly assigned children observed in multiple schools to one of the schools in which they were observed. Our analysis includes test score data from the 1999-2000 school year through the 2006-2007 school year. While we could have also included test score data for the 1998-1999 academic year, the first year of statewide student testing in Florida, we opted to begin our analysis in 1999-2000 for two main reasons. First, the test scores in 1999-2000 are more comparable to future years of data because the state calculated a developmental scale score on the statewide criterion-referenced examination, the Florida Comprehensive Achievement Test (FCAT). Second, 1999 is the first year in which Florida assigned letter grades to schools as part of its school accountability program. Restricting our analysis to the post-accountability years allows us to avoid any contaminating effects from the introduction of the accountability program in the period prior to the introduction of the FTC scholarship program. As a further check, we
also present additional evidence using a longer panel of older data to evaluate the potential exogeneity of our measure of private school competition for public schools.
Students classified as learning disabled were excluded from the analysis. Disabled students are eligible for a more generous scholarship program, the McKay Scholarship Program, and the new FTC program should therefore have had no additional effect on schools' efforts to retain these students by improving their education. Indeed, applicants for vouchers under the FTC program who were disabled and therefore eligible for a McKay Scholarship were directed to that program instead. The full dataset includes 9,765,799 student-year observations, observed over the 1999-2000 to 2006-2007 school years, for a total of 2,787,158 students. Because scores for students in the same school in the same year are likely to be correlated, we cluster our
standard errors at the school-year level.
4.2 Measures: Our dependent measure is a student's developmental scale test scores on the Florida Comprehensive Achievement Test, a criterion-referenced test used for school and student accountability. To ease interpretation, test scores are standardized at the grade level.
We use four primary measures to estimate the competitive pressure that public schools face from private competitors. While our measures of competition are all variations on a similar theme, we believe that it is important to report our results using a variety of competition
measures in order to help to ensure that our results are not due to a fortuitous choice of competition measure. Our first measure is the crows-flight distance between the physical addresses of each public school and the nearest private competitor. A private school qualifies as a competitor to a public school if it serves any of the grades taught in that public school. We call this the "distance" measure of competition. We find that, as Florida's population is heavily
urban, the overwhelming majority of public schools have a private school within five miles. Therefore, we restrict our analysis in this paper to schools with at least one private school within five miles.
Second, we consider the number of private competitors within a five mile radius of the public school (“local” private competitors). We call this the "density" measure of competition. The distance and density measures gauge whether easier access to a private school of any type increased the competitive pressure on public schools when the new policy lowered the effective price of private school for eligible students.
Third, we consider the number of types of local private schools. A type is defined by religious affiliation; schools self-identify as to their affiliation when reporting to the FDOE. We identify 10 types of private schools, including non-religious; non-denominational or
multidenominational; Catholic; Protestant; Evangelical; Baptist; Islamic, Jewish; Christian general (no specific denominational information); and other religious schools. A type is
considered to be represented if at least one school of that type is located within a five mile radius of the public school. We call this the "diversity" measure of competition.
In the final specification of the model, we use the counts of different types of schools within a five mile radius to generate a modified Herfindahl index score for each school. We call this the "concentration" measure of competition. The Herfindahl index is a measure of market concentration given by the sum of the squares of the market shares held by each competitor. In our measure, a "competitor" is defined as a religious (or secular) type r, and the share is given by:
R r r Count Count. Higher values of the Herfindahl index indicate a greater concentration of the
Herfindahl index score of 1 indicates a monopoly on the private school market by one
denomination or type of school, while scores closer to 0 represent markets that are well-served by a variety of denominations. These last two measures capture the variety of options available to students; public schools in areas with a greater variety of options should feel more competitive pressure in the wake of the policy change. In order to ease interpretation of our results, we report the results of regression models in which we measure negative distance and one minus the
Herfindahl measure, so that all four measures' models would generate results in which a positive coefficient means that more competition is associated with higher levels of student outcomes. We also multiply the coefficients on the competition variables by 100 in our tables to be able to distinguish between relatively small differences in effect sizes; descriptions of the effects in the text convert the coefficients back to their natural metrics.
The last three measures of competition are based on counts of private schools, and weight large and small schools equally. We prefer count-based measures of competition because we believe that it is more plausible for public school educators to know whether there are private schools nearby than how large or small those private schools are, or how many potential slots they have for voucher program participants. That said, we have also estimated models in which we measure the total number of potential spaces available within a five mile radius (based on the number of seats per grade level observed in the data) of the public school. The results of these specifications are consistently along the same levels of statistical significance as those reported in the paper; for instance, the relevant t-statistics from the model specification analogous to that reported in Table 3 range from 10.6 to 13.4. Out of concern for paper length, we do not include results of this competition measure in the paper, but the full set of results are available on request.
Additional individual-level controls include demographic characteristics such as the sex and race of the student (Black, Hispanic, Asian, or other race; White is the omitted category), English language learner status, and free or reduced price lunch eligibility. These characteristics are all reported by schools to the Florida Education Data Warehouse.
Until 2000-01, Florida only tested students in a handful of grades; beginning in 2000-01 Florida began to test students in every grade from three through ten. Therefore, we do not observe prior test scores for all students in our analysis. For this reason, and because we would lose another pre-policy year of data were we to include them, our primary models do not include lagged test scores for students, but we have estimated our models including lagged scores. In general, the results that we present are weaker than the results that occur using the same sample when we control for lagged test scores. If anything, therefore, we present estimates that are on the modest side.
We controlled for some time-varying characteristics of schools that affect the degree of competitive pressure they may feel. Specifically, we controlled for the grades that schools received from the FDOE in the prior year; schools with lower FDOE grades may feel particular pressure to increase their scores to avoid accountability sanctions, independent of the effects of the FTC policy. Missing dummy variables were included to preserve information for students in schools for which these data were not reported. We also controlled for the percent of the school’s student body that was eligible for free and reduced-price lunch. Finally, a series of year dummies were included to account for time trends in scores.
4.3. Models: We use a series of fixed effects regression models to isolate the effect of
(1)
where Yist represents the math (or reading) score for student i in school s in year t; srepresents a fixed effect for school s; Cs represents the measures of the competitive pressure faced by
school s; Ptis an indicator for whether year t is post-policy implementation;11 Xit is a vector of
student characteristics, including sex, race, English language learner status, and eligibility for free or reduced price lunch, for student i in year t; is a vector of tim-varying school
characteristics; Tis a series of year dummies; and represents an error term. The coefficient on the competition measures interacted with the post-policy indicator, β, is our parameter of interest. We estimate models with just the first year of the program -- before any students have left the public schools but following the program's announcement -- as well as those with multiple post-implementation years in order to gauge the evolution of the effects of the program over time. Other models reported later in the program interact our competition measures with variables that reflect how strongly schools might respond to the policy. In particular, schools might respond to the policy more when they stand to lose more financial resources were a student to leave the school or when they believe that students are more likely to leave the school. We take up these considerations later in the paper.
We report robust standard errors, clustered at the school-year level, in our regression results. We have also estimated our models in which we have aggregated all data to the school level, and find consistent results.
11 In our first set of models, post-implementation is simply the year during which students are applying for vouchers
C P X S T Yist s s* t it st st S
4.4. Descriptive statistics: Table 2 reports descriptive statistics for the dependent and
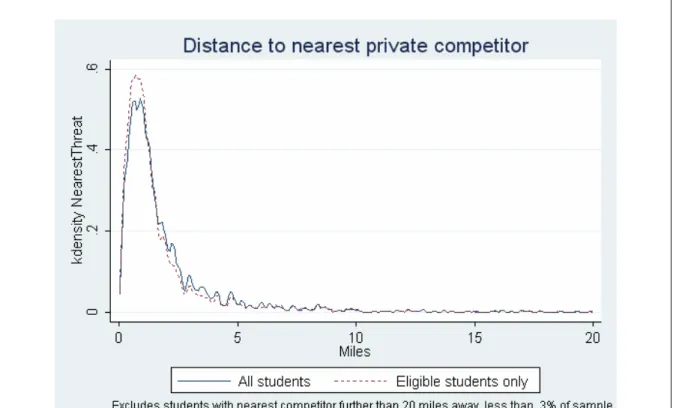
independent measures used in the regressions. Most students in Florida had access to at least some nearby private school options. The average distance from a child’s current public school to the nearest private school option was 1.42 miles. Figure 1 shows the distribution of distance between a child’s current public school to the nearest private school that served at least some of the same grades as the public school for all students, and for eligible students specifically. These graphs indicate that most students, regardless of program eligibility, attended public schools with private competitors that were within five miles of the public school, although eligible students tended to attend schools with a slightly closer nearest competitor than did non-eligible students.
Moreover, students generally had access to a relatively large number of schools, and a fairly diverse sampling of types of schools, within five miles of their public schools. Students attended schools that had an average of 13.97 private competitors within a five mile radius, representing an average of 5.02 different types of religious (or secular) affiliations (Table 2). Figures 2 and 3 show the distribution of number of schools within a five mile radius of students’ public schools and the number of types within that radius, respectively. Eligible students tended to have a greater number of private school competitors within a five mile radius of their public schools and a greater number of types of denominations among those competitors than did the population at large. Finally, Figure 4 shows the distribution of Herfindahl index scores. As can be seen in the graph, a sizeable fraction of public schools face just one type of private
competitor, leading to a Herfindahl index of one. In order to have a higher value of this
concentration measure equate to higher degrees of competition, we operationalize this variable as one minus the Herfindahl index in our regression models.
The degree of variation in these figures is somewhat unsurprising since our data draw from the entire state. However, even within metropolitan areas, a high degree of variation in competition measures exists. Figures 5 through 8 present box-and-whisker plots of the
distributions of our four competition measures in each of the eight most populous school districts in Florida. As can be seen, there exist considerable differences both within and between
metropolitan areas in different parts of the state. Therefore, our analyses are driven both by within-area and between-area differences in the level of potential voucher competition faced by schools.
5. Results
5.1.Immediate effects of the introduction of the voucher program: There are three main ways in which the introduction of a school voucher could affect public school performance. Public schools could react to private school competition by altering their policies, practices, or effort -- the direct competitive effect of school vouchers. In addition, school vouchers could affect public schools by changing the set of students who attend the school; if students are positively selected into private schools with the voucher, this could lead to a reduced-ability clientele remaining in the public schools, or vice versa. Figlio, Hart and Metzger (2009) find that the voucher program led to negative selection into the private schools, indicating that the ability levels of those
remaining in the public sector are higher than before. In the presence of positive peer effects, this could mean that part of a positive "competitive" effect of vouchers is the changing of the composition of the public school student body. A third possibility is that, so long as only a few students leave a public school with school vouchers, the vouchers could have a positive resource
effect on public schools, as effective per-pupil resources might increase due to the indivisibility of classroom teachers. On the other hand, especially in Title I schools (which comprise a majority of public schools in Florida), losing students eligible for free or reduced-price lunches results in resource reductions that could affect student outcomes as well.
It is possible to eliminate the composition and resource effects of school vouchers and concentrate solely on the competition effects of school vouchers by looking only at the first year of the voucher program -- in the 2001-02 school year, after the program's announcement but before students could actually leave the public schools on a voucher -- in comparison with prior years before the program was announced. During this entire academic year, students in the public schools were applying for private school vouchers but had not yet left for the private schools. We therefore begin with school fixed effects estimates of the effects of competition on student performance in the first year of the program, when students were applying for school vouchers but none had yet left the public schools.
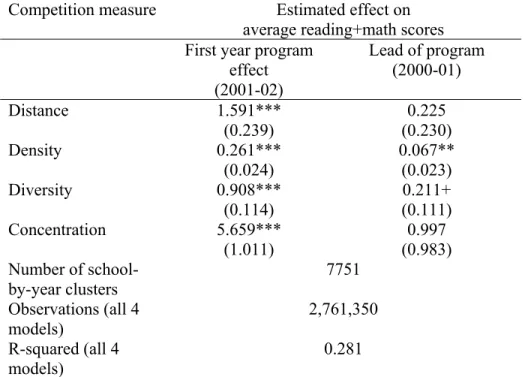
The results of this first analysis are reported in Table 3, in which the point estimates (with standard errors clustered at the school-year level) of the key competition variable for the four alternative models of competition are reported. As can be seen in the table, all four measures of competition are positively and significantly related to student performance. Every mile the nearest private school moves closer, public school math performance increases by 0.015 of a standard deviation (0.014 in reading.) Likewise, a one standard deviation increase in the number of nearby private schools increases test scores by about 0.02 to 0.03 of a standard deviation in reading and math; a one standard deviation increase in the variety of nearby private schools increases scores in both subjects by about 0.02 of a standard deviation. A one standard deviation increase in the (negative) concentration of private schools nearby is associated with about a 0.01
of a standard deviation increase in reading and math test scores. While these estimated effects are modest in magnitude, they are very precisely estimated and indicate a positive relationship between private school competition and student performance in the public schools even before any students leave the public sector to go to the private sector.12 That is, these results provide a first piece of evidence that public schools responded to the threat of losing students to the private schools via the voucher program.
The third column of Table 3 presents the results of a model in which the dependent variable is the average of a student's standardized reading and standardized math exam (or the single exam score in the case of a student taking just one or the other.) We do this for two reasons: First, in 1999-2000, elementary students took only one test or the other, but not both, in the same year, so aggregating the two tests into the same dependent variable ensures that we include all test-taking students in the same model. Second, we combine the two tests so that we do not need to report two sets of regression results in all subsequent tables. Nonetheless, the three columns yield nearly identical results.
It may be that the levels of existing private school competition merely reflect the effects of being in more densely populated areas that are changing over time. We therefore repeat the analysis reported in column three, but also control for the log of the number of students attending public schools within a five mile radius of the public school in question. As can be seen,
controlling for this measure of public school student density leads to a very modest reduction in the point estimates of the effects of voucher competition, though the overall magnitudes and statistical significance levels remain basically unchanged. We can conclude that any correlation
12
We have also estimated these models aggregated to the school-by-year level and continue to see strong positive and statistically significant estimated effects of private school competition on public school performance. These
between public school student density and private school concentration measures is not driving our estimates of the competitive threats of vouchers. We focus the remainder of the paper on specifications based on that reported in the third column of Table 3.
One potential concern is that any apparent competitive effects of private schools on public school performance picked up in regressions may simply reflect superior performance by schools that have close competitors, regardless of whether or not scholarships are offered to low-income students. For instance, perhaps schools of all different types are more likely to open up in areas with a large concentration of high-income families. This would produce a spurious positive correlation between public school scores (since high-income children tend to outperform their low-income peers on standardized tests, on average) and competition (McEwan, 2000). While the school fixed effect would control for this in a cross-sectional regression, school fixed effects will not remove spurious correlations between competition measures and longitudinal score gains, or in trends over time in the performance of public schools in a community. Therefore, it is useful to test how competition and public school performance levels and longitudinal trends were related prior to the introduction of the policy.
One test for whether there were differences in student performance based on the strength of competition prior to the introduction of the FTC scholarship program involves estimating models that include a one-year lead of the policy -- in the 2000-01 school year before the policy was announced. If schools with nearby private schools were improving over time, one would expect to observe positive coefficients on these policy lead variables. Indeed, as seen in Table 4, we do observe modest positive coefficients on the lead of the policy variable -- statistically significant in two of the four models -- suggesting that there may be some evidence that public schools with more nearby private schools (and a larger number of nearby private school types)
had been improving prior to the voucher program. That said, the coefficients on the lead of the policy variable are at most one-fifth of the magnitudes of the corresponding coefficients on the first year of the policy, suggesting that a break from trend has been taking place. Unfortunately, Florida did not collect a long panel of statewide data prior to the policy introduction that would allow us to gauge the presence of long-term trends. The results with the lead of the policy variable indicate that it is also important to see whether the policy had differential estimated effects on the schools for which we would expect to see larger impacts.
Because we have only two years of pre-program data, we cannot rule out the possibility that public schools with a larger amount of private school competition nearby had been on a different growth trajectory during the period of time prior to the policy's introduction. We can, however, use a different data source to investigate the potential presence of longer trends in public school performance. Prior to the policy's introduction, each Florida school district administered its own nationally-normed standardized test (generally the Stanford Achievement Test, Comprehensive Test of Basic Skills or the Iowa Test of Basic Skills), and the three most populous school districts in the state (Broward County, Miami-Dade County, and Palm Beach County) have provided us with school average reading and math performance on the relevant standardized tests for the years prior to the policy's introduction.13 Figures 9 through 12 present graphs showing the relationships between our four private school competition measures and school-level changes in average national percentile rankings in reading and mathematics from 1996-97, five years before the policy introduction to 2000-01, the year before the policy
introduction. As can be seen in the graphs, there is no apparent relationship between the level of
13
These three counties yield results that are roughly representative of the rest of the state. Were we to restrict our Table 4 analysis to just these three counties, the figures in the first column would be 2.218 (with a standard error of
private school competition present in 2000 (when we measure competition for the purposes of our analyses) and over-time changes in school-level test performance. The correlations between the competition measures and changes in test performance in the long difference are -0.086 for distance, -0.023 for density, +0.014 for diversity, and +0.006 for concentration.
Moreover, year-by-year comparisons demonstrate that there was no general improvement trend in the schools with more local private school competitors. Results of school fixed effect regressions of school-year average test scores in the three school districts on year dummies and year-specific leads of the competition measures indicate that there is no consistent pattern in the relationship between 2000 levels of competition measures and the leads of the policy over the longer time horizon.14 For example, with regard to the diversity measure of competition, the coefficients of the interaction between competition and dummies for 1997-98, 1998-99 and 1999-2000, compared with 1996-97, are -0.17, -0.17 and -0.18.15 The same three coefficients for the density measure of competition are +0.02, +0.00 and -0.04, and for the concentration
measure the three coefficients are -3.0, -3.6 and -2.1. For the distance measure of competition there is a trend over these three years (coefficients of +0.19, -0.09, and -0.17) but they follow no apparent pattern as compared with 1996-97 or 2000-01 and none are statistically distinct from one another. Therefore, while we cannot rule out with absolute certainty the possibility that long-term trends are responsible for our results, the available evidence contradicts that explanation.
Out of concern that results may be driven by particular districts that house a large proportion of the students in the state, we estimate the same analysis excluding, one at a time,
14
This paragraph presents some basic findings from these fixed effect regressions. Full results are available on request.
each county in the state. We find consistent evidence that, regardless of which county is
dropped, the signs and general significance levels of the competition interactions are maintained. That said, the magnitudes of our key findings are notably smaller when we exclude Dade
County, home of Miami and the largest county in the state. When Dade County is excluded, the magnitude of our estimated effects of voucher competition effects fall by between 10 and 20 percent, though remain statistically significant at effectively the same levels as when Dade County is included in the analysis. No other county apparently affects our findings at all, as when we drop any of the other 66 Florida counties, our results remain virtually identical to the full-state analysis. Therefore, it is difficult to believe that some combination of counties is driving the general nature of our results, though the results are clearly stronger in the case of Dade County than in the rest of the state.
5.3. Differential estimated effects by incentives to respond: One would expect that some schools would have a greater degree of incentive to respond to potential competition associated with school vouchers aimed at low-income students than would others. We consider two major ways in which schools may face different incentives to react to competitive pressure. First, we suspect that elementary and middle schools will have more of an incentive to respond to competitive pressure than would high schools because the vouchers cover so much more of the share of private school tuition and fees in the early grades versus in the high school grades. While the differences in the share covered might not be salient for higher-income families (and therefore estimation of differences in responsiveness across school levels might not be as relevant in the case of a universal tuition tax credit like the one studied by Chan and McMillan (2009)) the difference in out-of-pocket expenses between an elementary or middle school and a high school
might be strongly prohibitive for many low-income families. Public high schools, knowing this, might not react as strongly to voucher competition as would public elementary and middle schools. Second, we suspect that public schools who stand to gain or lose the largest amounts of revenues depending on how many voucher-eligible students they retain would be more
responsive than would those schools less likely to lose large amounts of revenues. We take advantage of plausibly naturally-occurring variation across the 67 Florida school districts in the implementation of the federal Title I program in an attempt to gain purchase on this second question.
There exists strong evidence to believe that the costs of attending a private school on a voucher would be more prohibitive in the case of high schools than in the case of elementary and middle schools, given that the voucher is capped at the same level regardless of the school level. In the case of the two Scholarship Funding Organizations that serve the southern half of Florida (Florida P.R.I.D.E. and the Carrie Meek Foundation) we have access to the actual out-of-pocket costs incurred by families for tuition, fees and books for students who participate in the voucher. As can be seen in Figure 13, the typical out-of-pocket expense is considerably higher for voucher participants in high school than it is for voucher participants in elementary and middle school. While the typical out-of-pocket expense post-voucher for elementary and middle school students is close to zero, it is around two thousand dollars for a high school student. That this is a
substantial amount of money for the low-income families eligible for school vouchers in Florida is reinforced by the findings reported in Figure 14. In order to send a child to a high school using a school voucher, the typical family must spend over one-tenth of its family income per student, more than twice the share of family income necessary to send a child to an elementary or middle school using a voucher.
Table 5 presents the estimated effects of increased private school competition through the school voucher on combined public school test scores, broken down by elementary and middle schools versus high schools. As can be seen, in each of the four model specifications, the estimated effect of voucher competition is sizably and statistically significantly stronger in the case of elementary and middle schools than in the case of high schools. In all four cases, the magnitude of the estimated effect in lower school levels is two to three times the estimated magnitude of the effect in high schools. This provides the first piece of evidence that public high schools were less responsive to private school competition that came about through the voucher program than were public elementary and middle schools.
We next consider whether public schools that face increased financial incentives to respond to voucher competition do so. As mentioned above, all public schools may experience resource effects as a consequence of losing students to private schools on the voucher. However, no schools have as large of an incentive to retain free or reduced-price lunch eligible students as those who are on the margin of receiving federal Title I aid. These federal resources, which average more than $500 per pupil, are directed to school districts, which then allocate them to the elementary and middle schools where low-income students attend.16 Not every public school with low-income students receives Title I aid; indeed, in 2001-02, 61 percent of elementary schools and 31 percent of middle schools statewide received Title I aid. Title I aid is allocated based on where schools rank within the school district; the highest-poverty schools receive Title I aid while the lower-poverty schools do not, and the poverty threshold that generates Title I funding differs considerably from district to district. In some school districts, generally very small, rural districts, all elementary or middle schools are Title I schools, and school districts
also have discretion to limit Title I funding to elementary schools. In Florida, the overwhelming majority (92 percent) of Title I schools are considered "Schoolwide" Title I schools, where the Title I aid is not required to follow individual students per se but can be spent anywhere in the school (as the school is considered to be sufficiently low-income that all uses of the money would likely serve low-income students.) The remaining eight percent of Title I schools are considered "targeted assistance" schools, where the school's allocation for Title I must be spent on the low-income students themselves.17 In either case, there is a large discrete jump in funding for a school that comes with being considered a Title I school versus not being a Title I school.
Title I funding, and the number of schools receiving Title I aid in Florida, began rising monotonically starting in 1999, and schools that were just below the 2001-02 cutoff for Title I aid were likely to believe that they stood a good chance of receiving Title I aid in 2002-03.18 The likely expansion of Title I funds, which enjoyed strong bipartisan support in Congress, was well-known to Florida schools for all or most of the 2001-02 school year, according to
conversations with school officials. While we do not know when exactly schools knew what the Title I cutoff for the next year in their school district would be, it is reasonable to believe that schools already receiving Title I funding in 2001-02 were relatively secure in the knowledge that they would likely continue to receive funding in 2002-03, and the poorest schools not yet
receiving Title I funding in 2001-02 might expect that, should they not lose many low-income students to private schools via the voucher, they might themselves become Title I schools in the next year.
17 This differs from the nation as a whole. Nationally, just over half of all Title I schools were schoolwide Title I schools in 2001-02.
18
The reauthorization of the Elementary and Secondary Education Act on January 8, 2002, and the signing of the associated appropriations law on January 10, 2002, further increased the level of Title I spending, though less in Florida than in other states. Nonetheless, this is likely to have reinforced the belief that schools close to the 2001-02
We envision that, in 2001-02, during which time public school students were applying for school vouchers, there were five different groups of public elementary and middle schools: (1) schools in districts where every school of a given level receives Title I funding; (2) schools in districts where no school in that given level receives Title I funding; (3) schools that received Title I funding in 2001-02 and, we suspect, expected to continue to receive funding in 2002-03; (4) schools on the margin of Title I funding in 2001-02 who might have expected to receive funding in 2002-03 were they to not lose many low-income students; and (5) schools below this margin who likely expected not to receive funding in 2002-2003. Of the 67 school districts, 30 districts identified all elementary schools as Title I schools, and 15 districts identified all middle schools as Title I schools in 2001-02 (group 1). All school districts had at least one Title I elementary school in 2001-02, but in 24 districts no middle schools were Title I schools (group 2). Of schools receiving Title I in 2001-02 (group 3), nearly 96 percent continued to receive Title I funding in 2002-03, indicating that ex post the presumption that with increased generosity would come some measure of Title I security appears to be accurate.
It is not obvious how to draw the dividing line between groups 4 and 5, so we choose to be agnostic and look instead at how the school districts redrew their Title I allocation thresholds between 02 and 2002-03. Specifically, we consider a school to be in group 4 if their 2001-02 student free/reduced-price lunch share is below the 2001-2001-02 threshold for inclusion but above what would be the district's 2002-03 threshold for inclusion, and we consider a school in group 5 if its 2001-02 free/reduced-price lunch share is below what would be the district's 2002-03 threshold for inclusion. This distinction appears to be discerning: 40 percent of our group 4 schools ultimately received Title I funding in 2002-03, while only 5 percent of group 5 schools did. In 17 school districts, the threshold for elementary school Title I inclusion was lower in
2002-03 than it was in 2001-02, as compared with one district in which the threshold increased. In five school districts, the threshold for middle school Title I inclusion was lower in 2002-03 than it was in 2001-02, while it increased in two districts. Hence, while we do not know how much schools knew about their prospects for receiving Title I aid the next year, this definition at least allows us to speculate as to which schools might have been on the margin of Title I receipt. We are particularly interested in the differential effects of voucher competition for group 4, these schools that we consider to be on the margin.
We estimate separate effects of voucher competition for three groups -- groups 1 (always-receivers in district), 2 (never-(always-receivers in district), and 4 (on the margin of Title I receipt) -- relative to groups 3 (almost sure receivers) and 5 (almost sure non-receivers), which we lump together for now. Table 6 reports the differential estimated effects of voucher competition for these different groups. The estimated effect of competition for schools in districts where they would always receive Title I aid tends to be negative, though it is only statistically significantly different from zero in the case of the concentration measure of competition. The estimated effects of competition for those schools that never receive Title I follows the same patterns as the estimated effects for "almost sure Title I" schools and "almost sure not Title I" schools. The estimated effect of private school competition for schools that we measure to be in group 4, on the other hand, is always positive and strongly statistically significantly different from the other groups of schools. This result indicates that public schools that are likely to receive Title I aid in the next year if they retain their low-income students, but not if they don't, tend to
disproportionately improve in the voucher-threat year.
Title I assistance is not the only way in which program-eligible students might plausibly bring resources to a school. Schools on average tend to receive more funding from their districts
the more students they have in the school, and therefore these students -- like all other students -- could generate resources for the school. We therefore repeat the same exercise, but now also include the 2001-02 percentage eligible for free or reduced-price lunch (interacted with a dummy variable for post-policy and with that dummy for post-policy times the competition measure, as is the case with the other interacted variables. This interaction allows us to consider both ways in which more program-eligible students might bring more revenues to a school. There is no need to interact the 2001-02 percentage free or reduced-price lunch with the competition measure, as this interaction is subsumed into the school fixed effect.) The results of this specification are reported in Table 7. The findings from Table 6 remain basically unchanged, and that in two of the four specifications there is a positive and significant relationship between the estimated effects of the degree of competition and the percentage in the school eligible to receive a school voucher. These results again indicate that the schools on the margin of
becoming Title I eligible -- the schools that would gain considerably were they to become Title I eligible -- are also the schools that apparently respond the most to the competitive threats of school vouchers. There is consistent evidence that the schools with the biggest incentives to improve as a result of the voucher program were the schools that improved.
5.4. Longer-term estimates of the effects of school vouchers: We also investigate whether the estimated effects of the voucher program persist to later years. After the first year of the program, in addition to the competitive effects of the program there are also resource and composition effects as students leave the public schools for private schools under the voucher program. These results can be seen in Table 8, which presents results of models that include year-by-year estimates of the effects of the voucher program competition as well as leads of the