T
ITLE
IX
AND THE
E
VOLUTION OF
H
IGH
S
CHOOL
S
PORTS
B
ETSEY
S
TEVENSON
CES
IFO
W
ORKING
P
APER
N
O
.
2159
C
ATEGORY3:
S
OCIALP
ROTECTIOND
ECEMBER2007
An electronic version of the paper may be downloaded
• from the SSRN website: www.SSRN.com
• from the RePEc website: www.RePEc.org
CESifo
Working Paper No. 2159
T
ITLE
IX
AND THE
E
VOLUTION OF
H
IGH
S
CHOOL
S
PORTS
Abstract
The passage of Title IX, the 1972 Education Amendments to the Civil Rights Act, expanded
high school athletic opportunities to include girls, revolutionizing mass sports participation in
the United States. This paper analyzes high school athletic participation in the United States
and how sports offerings for boys and girls changed subsequent to the passage of this
legislation. Girls’ sports participation rose dramatically both following the enactment of Title
IX and subsequent to enhancements to its enforcement. Approximately half of all girls
currently participate in sports during high school; however, there remains a substantial gap
between girls and boys participation in many states. States’ average education level and social
attitudes regarding Title IX and women’s rights are correlated with this remaining gender gap.
Examining individual high school students, sports participation is seen more frequently
among those with a privileged background: white students with married, wealthy, educated
parents are more likely to play sports. This finding points to an overlooked fact—while Title
IX benefited girls by increasing the opportunity to play sports, these benefits were
disproportionately reaped by those at the top of the income distribution.
JEL Code: J16, J18, J24, I2.
Betsey Stevenson
The Wharton School
University of Pennsylvania
1454 Steinberg Hall-Dietrich Hall
3620 Locust Walk
Philadelphia, PA 19104-6372
USA
betsey.stevenson@wharton.upenn.edu
I want to thank the many generous friends and colleagues who have contributed to my
thinking about Title IX and high school sports, including Richard Freeman, Claudia Goldin,
Caroline Minter Hoxby, Lawrence Katz, Brigitte Madrian, Todd Sinai, Justin Wolfers, Matt
White, Joel Waldfogel, and seminar participants at the Wharton Applied Economics
Workshop. Adam Isen and Rachel Schwartz provided excellent research assistance. Special
thanks go to Bruce Howard, John Gillis and others at the National Federation of State High
School Associations for their assistance in tracking down data. Generous funding from the
Wharton Sports Business Initiative and the Zell/Lurie Real Estate Center is gratefully
acknowledged.
I.
Introduction
Organized sports have long been an integral part of the American high school experience for boys. However, the same has not been historically true for girls. Indeed, girls only began playing sports in large numbers subsequent to the passage of legislation mandating gender equity in schools.
Specifically, Title IX of the 1972 Educational Amendments required schools to provide equal access to all school activities, including, perhaps most controversially, sports. Thus began a transformation that has moved girls from the sidelines—cheering on the boys—onto the playing field.
This policy change has been politically contested since its inception and, while perhaps an overstatement, Suggs (2005, p.2) refers to Title IX‘s applicability to sports as ―the most visible gender controversy of the past thirty years.‖ While this paper demonstrates the large effects of Title IX for mass sports participation, political commentary on Title IX has instead been dominated by discussions of its impact on a much smaller group, intercollegiate athletes. The political economy of this is perhaps unsurprising as Title IX‘s highly concentrated fiscal impact on big-time sports universities led the National Collegiate Athletic Association to launch an aggressive lobbying effort against its applicability to sports, particularly ―revenue-raising sports.‖ While these efforts have largely failed, they have succeeded in focusing most research on the impact of Title IX on the college sports experience. What is
missing from this debate is an assessment of the sea change that Title IX brought to sports participation
through its expansion of opportunities for young girls. Thus, this paper will explore the implications of Title IX for mass sports participation, focusing on high school sports.
Although Title IX applied to discrimination in educational institutions generally, most forms of explicit discrimination had been largely dismantled prior to its passage. For instance, most of the male-only colleges and universities had become coeducational prior to Title IX. While the legislation helped to consolidate and further these gains, sports was a clear exception to this, as this was a domain in which the women‘s movement had made little impact prior to Title IX. Moreover, while millions of high school boys played sports, organized high school sports for girls was a relatively obscure activity with fewer than
1 300,000 girls participating the year that Title IX was passed. In turn, this points to the potential for laws requiring gender equity to have a large impact.
To see why the focus of this paper on sports participation leads to a focus on high schools, note that there are currently over 7 million participants in high school athletics each year, dwarfing the 400,000 intercollegiate athletes. In 2005-2006, fully 53.5% of students participated in high school athletics, and
there were 3.0 million female high school athletes compared with 4.2 million male athletes.1 At the
collegiate level, female athletes comprise a similar share of athletes, and in 2004-2005 there were 170,526 female intercollegiate athletes compared with 228,106 male athletes (Bracken, 2007). All told, there are 18 times as many high school athletes as college athletes. Additionally, an even larger share of girls will participate in sports during at least 1 yr of high school. Data from the National Educational Longitudinal
Survey reveals that 51% of girls and 67% of boys participated in sports during either the 10th or 12th grade
or both.2 Thus, in terms of policy impact, Title IX‘s applicability to sports has now impacted most young
women‘s lives through its effect on high school sports programs.
While the dramatic change in female sports participation is not in doubt, four issues continue to generate debate. First, policymakers have questioned whether these dramatic changes are in fact
attributable to Title IX. As such, Section III of this paper analyzes relevant data on the evolution of sports participation by girls, suggesting that Title IX and subsequent policy interventions played a crucial role in expanding sporting opportunities. Second, there is also substantial concern that the legislation reduced sports opportunities for boys. Thus Section IV analyzes participation patterns by gender and by sport, illustrating how Title IX has changed the sports landscape in the United States. While Title IX has come under fire from the National Wrestling Coaches Association, other male sports have fared much better. The rise in sporting opportunities for girls in high school appears not to have come at the expense of opportunities for boys. It may be that the real reason for the decline in wrestling has simply been a loss of
1
These numbers do not include participation in intramural sports or sports outside the school system. However, these numbers count ―athletes‖ and hence double count some individual students who participate in more than one sport. The data are from Howard and Gillis (2007).
2 market share among boys, relative to the rising popularity of other sports, such as soccer. Third, Title IX advocates have questioned whether it has achieved its potential to create gender equity, and so Section V examines sports participation rates for boys and girls across the country. For the past decade, women have comprised about 40% of all high school athletes across the country although there remain large state differences. The analysis in this section reveals the state characteristics that are correlated with greater sports participation rates and considers how these factors contribute to differences in the gender gap across the country. Social attitudes toward gender and Title IX are also strongly associated with the gender sports gap. Finally, Section VI discusses the relevance of high school sports as an educational policy. This section discusses the observed relationship between sports participation and later outcomes in life, highlighting the difficulties of establishing a causal relationship. In addition, descriptive detail on which girls are most likely to play high school sports highlights the disproportionate impact of Title IX on children from advantaged backgrounds. But first, we begin with the legislative and policy history.
II. Title IX: Background and Legislative History
Title IX of the 1972 Education Amendments to the 1964 Civil Rights Act mandates that ―No person in the United States shall, on the basis of sex, be excluded from participation in, be denied the benefits of, or be subjected to discrimination under any educational program or activity receiving financial assistance.‖ Title IX was first conceived in 1965, although it is doubtful that at that time there was much consideration about how it would impact high school sports. Indeed, history reports that one of the architects of the legislation, Edith Green, purposefully failed to raise athletics in the debate as she feared that it might sabotage the entire legislation (Suggs 2005, p. 67). Title IX was signed into law in 1972; however, this was only the beginning of the legislative and political debate over how it would be interpreted and enforced. In particular, most of the debate about Title IX‘s applicability to sports occurred after 1972. Much of this debate focused on the potential impact on football and intercollegiate sports. Many of the strongest opponents of Title IX‘s applicability to sports sought to weaken this link through an amendment to exempt ―revenue-producing‖ sports. This concern stemmed from the fiscal
3 implications of potentially having to spend equally on male and female sports—the ramifications of
which would be particularly severe for big-time sports universities.3 Ultimately, none of these
amendments were adopted. Instead the Javits amendment, which stated that Title IX ―shall include with respect to intercollegiate athletic activities reasonable provisions considering the nature of particular sports,‖ clarified the intent of Congress to have Title IX apply to sports.
During this period there was ongoing debate as to what schools were going to need to do to come into compliance and, while Title IX had been signed into law, schools had not yet been required to be in compliance or even told what compliance would entail. The first regulation stipulating the procedures for the implementation of Title IX were not released until June 1975. Prior to issuing the rules governing the enforcement of Title IX, the Department of Health, Education, and Welfare (HEW), which was given oversight of Title IX, accepted comments from interested parties. In a letter to the president, the Secretary of HEW Caspar Weinberger stated that the applicability of Title IX to sports had raised the ―most controversy and involves some of the most difficult policy and legal points‖ (Suggs, 2005, p. 70).
One of the issues raised was whether girls needed the same sports offered separately, access to male sports, or a ―separate, but equal‖ opportunity to play sports in general. Liberal feminists, such as the National Organization of Women (NOW), typically strive for simply removing barricades for women in achieving equality with men, leading them to argue that ―the ‗separate but equal‘ concept is inappropriate for any civil rights regulation.‖ They desired instead ―open access…with one exception…where skill in the given sport is the criteria…separate teams should be provided for them on the basis that the training
and sports traditionally available to women have been limited.‖4
In other words, NOW viewed separate sports teams for girls and boys as a stopgap measure that was needed until the ―training gap is closed,‖ at which point they envisioned all coed teams. However, NOW‘s wishes for a discontinuation of the separate but equal treatment of sports have largely gone unfulfilled.
3 At the university level, most sports represent a net loss to the university, and college sports as a whole report
operating losses. The two big revenue sports are men‘s basketball and football, and most of the revenue accrues to Division I-A schools (Kahn, 2007).
4 All the quotes are from a letter from Caspar Weinberg (1975) to President Nixon that was reprinted in the
4 Final regulations for enforcing Title IX were released in 1975, and they required schools to be in compliance by 1978. The rules included stipulating that girls had to be allowed to try out for male teams involving noncontact sports if no girls‘ team was offered. In addition, there were several factors listed that would be used in assessing compliance, including accommodation of interests and equipment and availabilities of facilities for practices and games including access to fields, coaches, locker rooms, and travel costs. Finally, these rules stipulated that while ―larger budgets for men‘s sports..[are] not sufficient to prove a violation,‖ they could be considered.
These rules were controversial because of the potential fiscal implications, particularly at elite sports universities, and there continued to be political pressure for change. In 1978, these initial regulations were replaced by a three-pronged test that focused on an institution‘s obligation to provide equal opportunity, rather than relying exclusively on a single compliance standard. The three-pronged test, which remains in place today, considers the number of male and female athletes with respect to overall enrollment, the history of expansion of female athletics, and whether the institution is meeting the demand of its female students. To be in compliance with the Title IX regulations, an institution must be
in compliance with one part of the three-pronged test..5
However, this adjustment in the enforcement guidelines did not end the debate about Title IX‘s applicability to sports. Six years after Title IX went into effect the Supreme Court ruled in Grove City v. Bell that Title IX was program specific and, as such, discrimination within nonfederally funded programs was not a violation of Title IX. However, this ruling was quickly overturned in 1987 by an act of Congress—the Civil Rights Restoration Act—which specified that Title IX should apply to all programs that are part of an educational institution that receives any federal financial assistance regardless of whether federal funds are used for the specific program. This legislation was particularly controversial,
5 In practice, many feel that the requirement in recent years has boiled down to the first prong—equal participation
rates. The second prong—demonstrating a history of expansion—has become less relevant since one can be ―in process‖ of expanding for only so long. The last prong—meeting demand—is difficult to ensure since a student bringing a Title IX suit is asserting that her demand is not being met. While many schools may be resting on the third-prong as they know of no unmet demand, relying on the third prong has not proven to be a successful legal rebuttal to a suit.
5 and only passed after two-thirds of Congress voted to override President Reagan‘s veto. More recently, the National Wrestling Coaches Association sued the U.S. Department of Education claiming that Title IX was the cause of observed declines in wrestling and arguing that Title IX created a quota system. In 2003, a U.S. District Court judge dismissed the lawsuit and noted that every federal appellate court that has considered the issue has upheld Title IX.
In addition to these failed challenges, Title IX was further strengthened in the 1990s by increased enforcement under the Clinton administration. This increased enforcement was compounded by a ruling
in 1992 by the Supreme Court, Franklin v. Gwinnett County Public Schools, which stated that schools
could be held liable for discrimination toward women by individual members in the institution and allowed for punitive damages to be awarded to plaintiffs in Title IX lawsuits. This case was focused on Title IX‘s applicability to primary and secondary schools. Finally, Title IX‘s impact on intercollegiate
athletics was enhanced by the 1994 Equity in Athletics Disclosure Act,which required that any institution
of higher education participating in any Federal student financial aid program make information about the schools‘ athletic programs public. This legislation increased access to data and both made greater
scrutiny possible and increased the potential for private lawsuits for Title IX violations.
To recap, TitleIX was passed in 1972 and went into effect in 1978, meaning that schools needed
to be compliant by 1978. There was little change to Title IX at the high school level between 1978 and 1987. It was then strengthened by Congress in 1987 and the Supreme Court in 1992. These markers give a unique aspect to the time series pattern one anticipates.
III. Consequences for High School Sports Participation
The National Federation of State High School Associations (NFHS) has collected and published an annual volume that contains detailed information on the number of sports participants and teams in each sport, by gender, for each state. Each state, plus the District of Columbia, has its own high school association, which is responsible for gathering information from individual schools. The NFHS conducts a National High School Athletic Participation Survey that is completed by the state associations which
6
record the number of athletes in each sport, by gender.6 Consequently, their data report the number of
players in each sport over time in each state.
To get sports participation rates, the raw participation numbers need to be divided by total high
school enrollment by gender, for each state, for each year.7 However, high school enrollment by state and
sex is not collected. Instead, state-level high school enrollment data are collected from the National Center for Education Statistics and a gender division is imputed from the 1990 and 2000 Censuses of
Population and the 2005 American Community Survey.8
In light of the history outlined in the previous section, one might infer that if Title IX was a key factor in the rise of female sports, then girls‘ sports participation should rise between 1972, when the bill was first passed and 1978, when compliance was required. Indeed, Figure 1 shows a large and
discontinuous jump in national female high school sports participation that starts when Title IX is first passed and continues until schools had to be in compliance in 1978. There are three reasons why one might expect a gradual increase in the sports participation rate over this period. First, schools became increasingly aware of the need to comply with Title IX. Second, it became clearer over time that being in compliance would require increasing female sports participation quite extensively. And finally,
implementation is more likely to work gradually rather than a dramatic effort to move half of all girls into sports overnight.
Following 1978, however, there is little from the challenges to Title IX that would suggest a change in female high school athletic participation until 1987, at which point Congress strengthened Title IX‘s applicability to sports. Turning to Figure 1, we see that there is little change in the sports
6
Annual data exists for the number of participants for each gender, in each sport, and by state, for the academic years 1969-1970, 1971-1972, 1973-1974, 1975-1976, 1977-1978 and every academic year thereafter.
7 Participation rates will capture the ratio of athletes to students. However, this does not correspond directly to the
percent of students participating in athletics because individual students who play multiple sports will count as multiple athletes. However, it is worth noting that the number of athletic slots available is a useful measure for Title IX in that the policy implies that boys and girls should have similar opportunities as opposed to an equal likelihood of participating in at least one sport.
8
While this estimate has many problems, including the fact that state of birth is used to identify the state of high school and that people with GED degrees are counted as having graduated high school, this estimate should help control for any bias that may result from a change over time in female enrollment rates caused by the increasing athletic opportunities in high school. An alternative is to impute that half of all students are female.
7
Figure 1
Male and Female High School Sports Participation as a Percentage of Male and Female High School Enrollment (from Stevenson, 2006) 0% 10% 20% 30% 40% 50% 60% 19 70-71 19 72-73 19 73-74 19 75-76 19 77-78 19 78-79 19 79-80 19 80-81 19 81-82 19 82-83 19 83-84 19 84-85 19 85-86 19 86-87 19 87-88 19 88-89 19 89-90 19 90-91 19 91-92 19 92-93 19 93-94 19 94-95 19 95-96 19 96-97 19 97-98 19 98-99 Male Female
Notes: Participation numbers are given by the NFHS (Athletic Participation Survey). A participant is a varsity sport team member. (Individual students may be counted more than once if they play on multiple teams.) The participation rate is the sum of total team memberships in a year divided by total high school enrollment given by the National Center for Education Statistics.
participation rate of girls between 1979 and 1987 and a small rise that occurs following the legislative change in 1987. Finally, the administrative shift and Supreme Court ruling in 1992 suggests that female participation should rise, and again we see further increases in female sports participation in the late 1990s.
While the legal battles and concern over Title IX have focused on the implications of Title IX on boys‘ athletic opportunities, Figure 1 shows that overall male high school athletic participation has barely changed. Male participation rates were around 50% in 1969 and remain there to this day. While there is a decrease that occurs between 1978 and 1979, this small decrease is also evident for girls, and thus, it is hard to conclude that this dip reflects sporting opportunities being reallocated from boys to girls.
In assessing the role of Title IX in expanding opportunities for women, three counterfactuals are worth considering. The first is that female sports participation was rising prior to the start of Title IX and
8 the observed pattern of increase in participation was simply part of a larger trend. The second is that female participation was rising very slowly and Title IX accelerated a process that was already underway. In this scenario the counterfactual to Title IX is a steady increase in participation rates that may
eventually equal the post-Title IX participation rates. The third possibility is that female high school sports participation would remain at the low levels witnessed in the early 1970s. The kinks in the times series corresponding to legislative changes suggest that the first explanation is unlikely. However, the evidence is consistent with either the interpretation that Title IX permanently raised girls‘ sports participation, or that it sped up the process substantially.
Given the tremendous strides women were making in a number of previously male-dominated arenas, it is worth considering why inroads into high school sports had not been made. One explanation is that high schools faced a coordination problem. Varsity sports pose challenges as schools
contemplating whether to invest in a girls‘ varsity team only makes sense if nearby schools are also going to make similar investments. In addition to the network externalities at the team level—each team produces a team that other schools will benefit from playing—there are likely individual-level externalities. No girl may want to play a sport alone, but may be quite interested if a friend is also
playing. These peer effects make understanding the true demand for sports among girls difficult to assess. For example, asking girls their interest in sports in a world in which few play is unlikely to capture what their level of interest will be once sports are offered and other girls in their school have begun
participating. With this type of network externality, multiple equilibria are possible and Title IX may have served as a coordinating mechanism moving schools from an equilibrium in which few girls play sports to one in which many do. The rapid shift from effectively no participation to high participation is consistent with this interpretation.
IV. The Changing Sports Landscape
The previous section demonstrated that across the country, on aggregate, female participation rates rose subsequent to the passage of Title IX, while male participation rates were largely stable.
9 However, the consistent participation rates seen for boys across all sports hide both growth and contraction in individual sports. While it is natural to suspect that over a 35-yr period some sports may have grown in popularity while others declined, examining these changes is useful because it helps one better understand both the recent political debate and the changing sporting landscape. A natural question that arises is how schools fiscally managed to add female sports. One might anticipate that more expensive sports were cut for boys, while cheaper sports flourished. Similarly, schools may have taken advantage of economies of scale and offered similar sports to boys and girls.
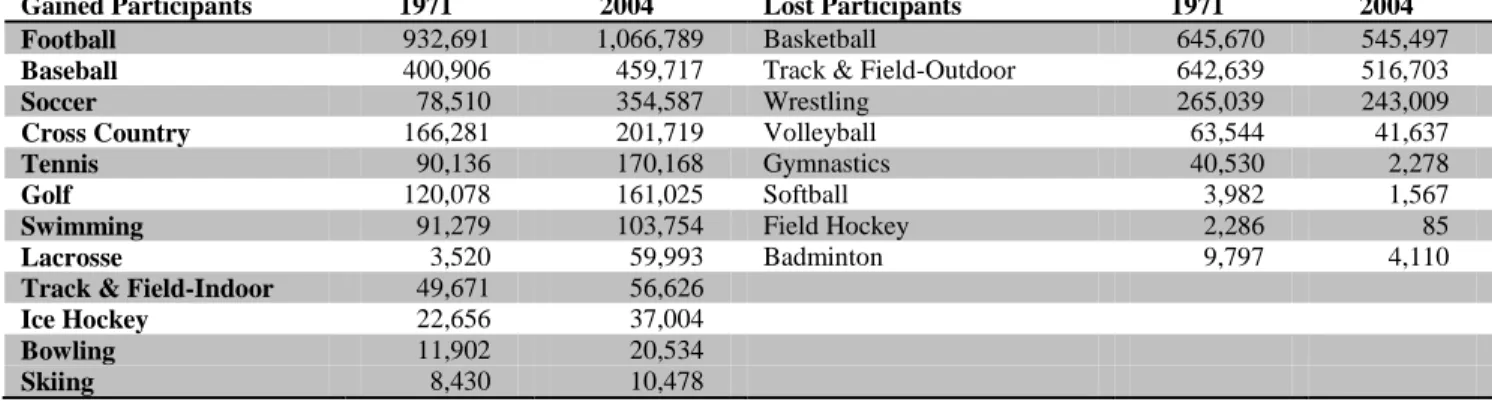
Table 1 lists sports in the right column that have lost male participants, while the left column lists sports that have gained participants. In the 1971-1972 school year the most popular sport among boys was football, with over 900,000 boys participating. It has subsequently grown by a further 15% to in excess of a million participants in 2004-2005. The second and third most popular sports among boys were basketball and outdoor track and field, each with around 600,000 participants in 1971-1972. Little has changed for boys in terms of ranking their top preferences—these three have remained the top three— however, basketball and track and field now have closer competitors. Indeed, baseball, which was ranked a distant fourth in 1971-1972, has grown to nearly half a million participants and is now a very close fourth. Soccer has emerged from a minority sport to now sit securely in the top five sports played by
Table 1
Growth and Decline in Male Sports from 1971-2004
Gained Participants 1971 2004 Lost Participants 1971 2004 Football 932,691 1,066,789 Basketball 645,670 545,497
Baseball 400,906 459,717 Track & Field-Outdoor 642,639 516,703
Soccer 78,510 354,587 Wrestling 265,039 243,009
Cross Country 166,281 201,719 Volleyball 63,544 41,637
Tennis 90,136 170,168 Gymnastics 40,530 2,278
Golf 120,078 161,025 Softball 3,982 1,567
Swimming 91,279 103,754 Field Hockey 2,286 85
Lacrosse 3,520 59,993 Badminton 9,797 4,110
Track & Field-Indoor 49,671 56,626
Ice Hockey 22,656 37,004
Bowling 11,902 20,534
Skiing 8,430 10,478
Notes: Participation numbers are given by the National Federation of High Schools (Athletic Participation Survey). A participant is a varsity sport team member. (Individual students may be counted more than once if they play on multiple teams.) Participation rates are for the 1971-1972 and 2004-2005 academic years.
10 boys; it has also attracted increasing numbers of girls. Soccer‘s newfound popularity displaced wrestling, which saw a small decline in participation over the past three decades, from being among the top five sports.
Figure 2 shows that there is a similar pattern when one examines participation rates or the total
number of schools offering each sport instead of raw counts of athletes.9 The solid lines show
participation rates by gender (corresponding to the left axis) and the dotted lines show, separately, the number of male and female teams per male and female high school enrollment (corresponding to the right
axis).10 Figure 2A focuses on the most popular sports played by boys—each typically involves 5-15% of
all high school boys. Only two of these sports saw large increases in female participation immediately upon the passage of Title IX: basketball and outdoor track and field. For both of these sports, female participation rose quickly to nearly the same rate as male participation by 1978 and has remained there to this day with little further convergence. There continues to be close to no girls participating in either wrestling or football—girls comprised less than 2% of wrestlers and 0.1% of footballers in 2004. While the same is true for baseball, a parallel sport, softball, has grown in popularity. However, the growth in softball for girls occurs largely after Title IX was implemented and as girls began to move away from some of the sports that had rapid growth following the passage of Title IX. While the discussion here has focused on participants, Figure 2 shows that the pattern in number of schools offering each of these sports over the past 35 years is quite similar to that of participation rates.
Figure 2b turns to sports with typically less than 100,000 participants in a given year, or involving 1%-4% of high school students, while Figure 2C examines those sports with less than 1% of the student population participating. Many of the sports that lost male participants were sports that had rapid increases in female participation following the passage of Title IX. For instance, while field hockey was always a minor sport, the few thousand male players in the early 1970s quickly disappeared, while female
9 The NFHS measures the number of schools offering each sport.
10
Deflating teams by students demonstrates changes in the access students have to teams. Alternatively, one could deflate teams by the number of schools. Since student-age population fluctuations typically affect both the number of schools and the number of students per school, deflating by schools will understate changes in the access to teams if school sizes increase.
11
Figure 2: Male and Female Sports Participation Rates and Teams Fielded: 1969-2004
Figure 2A 0 .7 5 1 .5 2 .2 5 3 0 .7 5 1 .5 2 .2 5 3 0 .0 4 .0 8 .1 2 .1 6 0 .0 4 .0 8 .1 2 .1 6 1970 1980 1990 2000 1970 1980 1990 2000 1970 1980 1990 2000
Baseball Basketball Football
Softball Track and Field-Outdoor Wrestling
T e a ms p e r 1 0 0 0 St u d e n ts Sp o rt s Pa rt ici p a tio n R a te s Graphs by Sport Figure 2B
0 .5 1 1 .5 2 0 .5 1 1 .5 2 0 .0 1 5 .0 3 .0 4 5 .0 6 0 .0 1 5 .0 3 .0 4 5 .0 6 1970 1980 1990 2000 1970 1980 1990 2000 1970 1980 1990 2000
Cross Country Golf Soccer
Swimming & Diving Tennis Volleyball
Girls Participation (left axis) Boys Participation (left axis) Female Teams (right axis) Male Teams (right axis)
T e a ms p e r 1 0 0 0 St u d e n ts Sp o rt s Pa rt ici p a tio n R a te s Graphs by Sport
12 Figure 2, continued Figure 2C 0 .2 5 .5 0 .2 5 .5 0 .2 5 .5 0 .0 0 5 .0 1 0 .0 0 5 .0 1 0 .0 0 5 .0 1 1970 1980 1990 2000 1970 1980 1990 2000 1970 1980 1990 2000
Badminton Field Hockey Gymnastics
Ice Hockey Lacrosse Skiing
Track and Field-Indoor Water Polo Weight Lifting
Girls Participation (left axis) Boys Participation (left axis) Female Teams (right axis) Male Teams (right axis)
T e a ms p e r 1 0 0 0 St u d e n ts Sp o rt s Pa rt ici p a tio n R a te s Graphs by Sport
Notes: Participation numbers are given by the National Federation of High Schools (Athletic Participation Survey). A participant is a junior or varsity sport team member. (Individual students may be counted more than once if they play on multiple teams.) The participation rate, shown on the left axis, is the sum of total sport memberships in a year for each gender, divided by total high school enrollment for each gender. Number of teams is the total number of schools offering each sport as reported to the National Federation of High Schools divided by enrollment for each gender and multiplied by 1,000. The right axis therefore shows the number of male (female) teams per 1,000 male (female) high school students.
participation exceeded 55,000 by 1980. Given the low levels of participation and the sharp decrease, this fall for boys is difficult to see in Figure 2C although the end points in Table 1 show this decline. Similar to field hockey, male participation dropped sharply in the 1970s for gymnastics, badminton, softball, and volleyball, while in these sports, female participation rose quickly. However, several of these sports recovered for males—particularly when schools introduced coed teams. For example, volleyball fell from
nearly 63,544 boys to a low of 7,059 by 1984 and participation rose over the next 20 years.11 Similarly,
male participation in softball and badminton fell to nearly 0 in the early 1980s; yet both have increased over the past 20 years.
Tennis, swimming, waterpolo, indoor track and field, lacrosse, and cross-country have all seen growth among both male and female participants although growth among girls has been stronger. For
11 The data do not record the number of coed teams nor do they record the number of participants on coed teams;
13 tennis and swimming, this growth has led to there being more female participants than male participants
in recent years. The parallel growth in male and female participation in tennis may point to coed teams.12
Finally, ice hockey and weight lifting are among the few sports that have seen continued growth for men since Title IX, with little growth for female participants.
It appears that, although far from the rule, gender-neutral sports have thrived in the post-Title IX era, while highly gendered sports have seen slower growth. Interestingly, there is nothing inherent in the legislation that requires this outcome, suggesting a strong potential role for school-level economies of scale in offering sports that are played by both genders. In particular, the rise in female sports participation in male sports like basketball and the rise in tennis among both boys and girls point toward the role of economies of scale. The rapid rise in sports like basketball would be a natural response if schools were able to take advantage of excess capacity—expanding the number of hours the basketball court was used—rather than engaging in large capital outlays (building a new court).
Title IX may also have led to changing or evolving gender norms regarding sports. In particular, the sharp drop in men‘s participation in minority sports like field hockey, badminton, and gymnastics following the sharp rise in participation by girls may reflect social concerns about playing a ―girls sport.‖ Alternatively, the resources for these sports may simply have been reallocated toward girls in the wake of Title IX.
V. State and Regional Variation in Sports Participation
While 53% of students participated in high school sports nationwide in 2005-2006, that average masks enormous heterogeneity at the state level. Figure 3 shows male and female participation rates by state for 2004-2005; the figure demonstrates both differences in how much people participate in sports
across the country and differences in the gender gap in sports participation.13 States with low levels of
12
The data document that some of the male and female players are on coed teams, but these numbers are not separately reported.
13 Recall that the participation rate measures the ratio of total athletes across all sports over total students. As a
14
Figure 3
Male and Female High School Sports Participation Rates by State in 2004
A K A L A R AZ C A C O C T D C D E F L GA H I I A I D IL I N KS KY LA M A M D ME MI M N MO M S MT N C N D NE N H NJ N M NV NY O H OK O R PA R I S C S D TN TX U T V A V T W A W I W V W Y .2 .4 .6 .8 1 S p o rt s P a rt ic ip a n ts /E n ro ll m e n t
Notes: Participation numbers are given by the National Federation of High Schools (Athletic Participation Survey). A participant is a varsity sport team member. (Individual students may be counted more than once if they play on multiple teams.) The participation rate is the sum of total team memberships in a year in a state, divided by public secondary school enrollment by state.
participation have participation rates that are about a quarter of those in states with the highest rates of
participation. Examining the inter-quartile range, a state at the 25th percentile has participation rates of
32% and 47% for girls and boys, respectively, while the comparable rates for a state at the 75th percentile
are 53% and 74%. While some of this may reflect differences across states in the number of different sports that each student-athlete plays, similar patterns (both across states and between male and female participation rates) are seen when examining the likelihood that a student played sports in high school
using individual level data from the National Longitudinal Survey of Youth (NLSY).14
The differences between boys‘ and girls‘ participation rates across states capture the difference in opportunities for boys compared with those for girls. Overall, in the median state, there remains about a 17 percentage point difference between the ratio of male athletes to male students and that ratio for girls.
14 Individual data in the NLSY 1979 contain information on sports participation including intramurals and asks
students retroactively (in 1984) if they participated in any athletic extracurricular activities at any point in high school, whereas the NFHS is measuring the annual rosters of junior- and varsity- level sports (and do not count athletic clubs or intramurals). These differences prevent direct comparison between the individual propensity to participate and the total number of athletes.
15
A state at the 90th percentile has a 29 percentage point gap between male and female participation rates,
while a state at the 10th percentile has a 9 percentage point gap. The differences in participation rates
across states are quite persistent and reflect the stability of some of the underlying drivers of these differences. For example, it has long been recognized that school size plays a role in determining access
to athletics simply because team size tends to be independent of school size.15 Additionally, weather
patterns may affect the desirability, or feasibility, of playing sports outdoors or traveling to away games. Similarly, urban areas present both greater costs for the school of providing playing fields and greater competition for teenagers‘ time but also a denser network of competing schools. Social factors may also impact the extent of sports participation in a state. For example, preferences among parents for sports opportunities for their kids may vary by race, education, and socioeconomic status. Additionally, female employment may create demand for after-school activities.
Table 2 reports ordinary least squares regressions that examine state-level athletic participation
rates in the 2000s for boys and girls separately estimating:16
, 0 1 2
3 s 5 6
7
4
Sports Participation Rate School Size Percent Urban Temperature
Rainfall Log of School Spending + Percent college + Ratio of female-to-male employment
Percent home ownership +
s g s s s s s s s
8Percent Blacks 9Log of average family incomes s
where s denotes state and g denotes gender.17 The degrees of freedom are limited since there are only 51
observations (50 states plus Washington D.C.); therefore a parsimonious list of state characteristics is considered. The first and second columns show the results of this regression for boys and girls,
respectively. The third column reports the difference between the two or the drivers of the gender gap.
15 Barron, Ewing and Waddell (2000) use school size of one of many instruments for sports participation. The
difficulty with using school size as an instrument for athletic participation, however, is that there are likely important effects of school size beyond athletic participation.
16
The data used are averages of the 2000-2001, 2001-2002, 2002-2003, 2003-2004 school years.
17 While Figure 3 suggests that there might be important regional differences in sports participation rates, these
differences are all captured by the inclusion of these state characteristics, and including region dummies yields no additional explanatory power. It should be noted that a simple regression of participation on dummy variables for region (South, Midwest, West, and Northeast) shows that the Midwest has male participation rates that are 12% greater than those in the Northeast, while the South and West have male participation rates that are 16% and 12%, respectively, lower than those in the Northeast.
16 As anticipated, athletic participation falls with school size for both boys and girls although it does so to a greater extent for boys. A state with an average school size that is one standard deviation higher
has athletic participation rates that are 6 and 3 percentage points lower for boys and girls, respectively.18
The larger the share of a state‘s population that live in urban areas, the lower are participation rates for girls, but there is no discernable relationship for boys. The difference between the two is statistically significant and results in a larger gender gap in states that are more urban. Similarly, states with a greater proportion of African Americans have lower participation rates for girls and boys although the relationship with the latter is not statistically significant. States with more extreme weather—lower temperatures and higher rainfall—have lower participation rates, but this is equally true for boys and girls
and as such there is little relationship between weather and the gender gap.19
Socioeconomic makeup of the state explains some of the variation across states in their sports participation rates. States where more parents own their home and those where women are more likely to be in the labor force have higher athletic participation rates for both boys and girls. States with a one-standard deviation greater rate of parental home ownership have 8 and 5 percentage point higher male and female participation rates, respectively; the larger association between home ownership and male participation leads to larger gender gaps in states with greater home ownership. Differences in female labor force participation are associated with large differences across states in participation and as with home ownership, the relationship is larger for boys than for girls, and states with a greater ratio of female-to-male employment have greater gender gaps, all else equal. Finally, as the proportion of the state that is college educated rises, the gender gap falls. States with a greater proportion of college graduates have
18 Data from the NFHS does not allow differentiation across states in the intensive and extensive margins of
participation—in other words, it is impossible to discern whether small schools allow a few students to play many sports or many students to play a few sports. However, data from the NLSY shows similar relationships between the proportion of students who participate in high school sports in a state and the state characteristics investigated here. In particular, a higher average school size in a state is associated with a lower probability of having participated in sports for girls and an even lower probability for boys.
19 Temperature is measured as the lowest average monthly temperature experienced in a state, while rainfall is
17 higher female participation rates, and there is little association with male rates. A state with a one-standard deviation greater proportion of college graduates has a 5 percentage point lower gender gap.
Table 2
Determinants of State High School Participation Rates and the Gender Gap
Mean (1) (2) (3) (4) (Standard
Deviation)
Boys Girls Gender Gap
(1)-(2)
Gender Gap
Proportion of athletes
Average School Size
(coefficients x100) 783 (271) -.023*** (.009) -.012** (.005) -.011 *
(.006) -.000 (.000) Proportion of state urban 69% (15) -.009 (.158) -.232** (.106) .241** (.103) .196** (.090)
Min Temperature 22 (11) .007** (.003) *.005** (.002) .002 (.001) .000 (.009) Max Rain 4.7 (1.8) -.026 (.021) -.016 (.014) -.009 (.011) .000 (.009) Log of per pupil school expenditures 9.6 (.22) .163 (.110) .213*** (.063) -.050 (.088) -.119* (.066)
Proportion of state college-educated 24% (5) .071 (.466) *.945*** (.341) -.874*** (.355) -1.02***(.315) Ratio of female employment to male
employment rate 85% (4) 2.76*** (.492) 1.61*** (.316) 1.15*** (.362) .200 (.284) Proportion of parents who are home owners 75% (6) 1.25*** (.305) .753*** (.192) .495* (.229) .242 (.181) Percent of population black 10% (11%) -.422 (.265) -.579*** (.164) .156 (.148) .249** (.104)
Log family income 11.0 (.15) -.212 (.217) -.220** (.118) .007 (.166) .119 (.129)
N 51 51 51 51 51
Adjusted R-squared .678 .779 .2511 .3577
Notes: Dependent variable in columns (1) and (2) is the state level male (female) athletic participation rate (male (female) participants divided by male (female) enrollment) averages of the 2000-2001, 2001-2002, 2002-2003, 2003-2004 school years. Per pupil school expenditures are for 2003 and are from the National Center for Education Statistics Common Core of Data. The proportion of the state that is college educated, the ratio of female-to-male employment, the proportion of the parents who are home owners, the percent of the population that is black, the proportion that is urban, and log of the state average family income are calculated from the 2000 Census. Minimum temperature is the average monthly average temperature of the month with the lowest average temperature, while maximum rainfall is the average rainfall in the month with the greatest average rainfall. The dependent variable in the third column is the difference between the male and female participation rates. The dependent variable in the fourth column is the difference in the male and female participants divided by the total number of athletes. Robust standard errors in parentheses.
*Statistically significant at the 10% level, ** Statistically significant at the 5% level, ***Statistically significant at the 1% level.
One aspect of the gender gap as depicted in Table 2 is that the greater the male participation rate, the greater the gender gap will be if all states have roughly the same proportion of athletes that are female. While Title IX‘s proportionality standard implies that states should have the same percent of male and female students participating, in the median state there are 7 female sports participants for every 10 male. This relationship is fairly similar across the distribution and, as such, a state with a 10-percentage point
greater male participation rate has a 3 percentage point greater gap in the male-female participation rate.20
Thus, to better understand differences in the gender gap, we turn to an alternative scaling, measuring it as the difference between male and female athletes as a percentage of all athletes. This definition of the
20 A regression of female participation on male participation yields an adjusted R2 of .79 and a coefficient on male
participation of .715. A scatter plot of the two shows that the relationship is similar along the distribution of male participation.
18 gender gap has a natural scaling from -1 to 1, with 0 representing equal shares of male and female athletes and 1 indicating that all athletes are male. In the 2000s, the mean gender gap as a percentage of all athletes was 16% and the standard deviation was 7%. This compares with a 17% mean and 8% standard
deviation for the raw gender gap—the gap between male and female participation rates.21 Thus, while
conceptually different measures, the distribution of the two are similar. Figure 4 shows that, as with female participation rates, the difference between the male and female shares of athletic participants fell rapidly in the 1970s and has fallen again beginning in the early 1990s. Additionally, the dispersion in the
gender gap across states has been reduced over time and the difference between the 90th and 10th
percentile states is much smaller today than in the 1980s.
Figure 4
Difference in the Male and Female Share of Athletes Median, 90th and 10th Percentile States
0 .2 .4 .6 .8 1 Ma le -F e ma le At h le te D if f O ve r T o ta l At h le te s 1969 1974 1979 1984 1989 1994 1999 2004 Year
Gap at the 50th Percentile Gap at the 90th Percentile Gap at the 10th Percentile
Notes: Reports female participation subtracted from male participation, the difference of which is then divided by the total number of athletes (male plus female). All data are from the National Federation of High Schools.
19 The last column of Table 2 considers the relationship between this alternative measure of the gender gap and the explanatory variables previously considered. Examining the gap between male and female participation as a proportion of all athletes, we see that there is no statistically discernable relationship between the gap in the proportion of athletes and school size, home ownership, and the ratio of female-to-male employment. In states with more urban areas boys make up a greater share of the athletes. The proportion of the state that is college educated is negatively related with the gap such that girls make up a greater share of athletes, the more college-educated people there are in the state. Finally, school expenditure in a state is statistically significantly associated with the gap in the proportion of athletes who are female; an increase in school spending is associated with greater gender equality among athletes.
Table 2 provides the characteristics of states with larger and smaller gender gaps, but this tells us little about whether individual states have cut boys sports in order to reduce their gender gap. Figure 1 showed that across the nation, boys‘ participation was little changed in the wake of Title IX and in 2004-2005 national male participation rates were only 4% higher on average compared with 1973-1974. However, this may mask heterogeneity at the state level. Indeed, Figure 5, which graphs the change in boys‘ and girls‘ sports participation rates from 1973-1974 to 2004-2005, shows that three decades later, a few states have male participation rates that were up to 40% lower while other states have male
participation rates that are double those of 1973. In the majority of states, male participation grew; moreover, changes in girls‘ and boys‘ participation at the state level are positively correlated: states that had the most growth in female participation post-Title IX also had growth in male participation. Thus, while some states experienced a decline in male participation rates, those that reduced boys‘ sports had the smallest gains for girls.
Figure 6 illustrates that the remaining gender gap is related to social attitudes regarding both Title IX and the appropriate role for women in society. States in which a greater proportion of people believe
20
Figure 5
State Level Changes in Male versus Female Participation Rates: 1973-1972 to 2004-2005
AK AL AR AZ CA CO CT DC DE FL GA ID IL IN KS KY LA MA MD ME MI MN MO MS MT NC ND NE NH NJ NM NV NY OH OK OR PA RI SC SD TN TX USA UT VA VT WA WI WV WY -5 0 0 50 1 0 0 1 5 0 P e rce n ta g e Ch a n g e in B o ys P a rticip a tio n 0 100 200 300 400 500 600 700
Percentage Change in Girls Participation: 1973-2004
Notes: The change in sports participation for boys and girls is calculated by taking the first full post-Title IX year in which survey data where available—1973-1974—as the denominator, while the numerator is the difference between the participation rate in the 2004-2005 school year and the participation rate in 1973-1974. The observation for the total United States is shown on the graph, but is not used to fit the regression line.
that it is fair to cut boys‘ sports when a school cannot afford to fund boys‘ and girls‘ sports equally have a
lower gender gap in sports perhaps because these states have been more willing to cut boys sports.22
However, as we see in Figure 5, few states cut sports, and a greater belief in the fairness of cutting sports has little explanatory power for which states actually did cut sports. The second panel in Figure 6 illustrates that a belief that Title IX is responsible for creating opportunities to participate in sports is
22 In 2003, a Harris poll asked 1,000 respondents: ―Some schools and universities have been forced to eliminate
men's sports such as wrestling because they cannot afford to fund all men's and women's sports equally. In your view, is this a fair or unfair result of Title IX requirements?‖ Within a month of that survey question, a Gallup poll asked 1,000 respondents ―How responsible do you think Title IX (the federal law prohibiting almost all high schools and colleges from discriminating in sports programs as well as other areas on the basis of gender) has been for the growth in women's sports in the last few decades? Do you think it has been--the main factor, a major factor but not the main factor, a minor factor, or not a factor at all?‖ The small sample size limits the precision and explanatory power of these attitudinal questions.
21
Figure 6
Social Attitudes and the Gender Gap in Sports
AL AZ AR CA COCT DE FL GA ID IL IN IA KS KY LA ME MD MA MI MN MS MO MT NE NV NH NJ NM NY NC ND OH OK OR PA RI SC SD TN TX UT VT VA WA WV WI WY 0 .2 .4 .6 .8 1 C u tt in g Me n 's Sp o rt s is F a ir 0 .1 .2 .3 .4
(Male Athletes-Female Athletes)/Total Athletes
AL AZ AR CA CO CT DE DC FL GA ID IL IN IA KS KY LA ME MD MA MI MN MS MO MT NE NV NH NJ NM NY NC ND OH OK OR PA RI SC SD TN TX UT VT VA WA WV WI WY .4 .6 .8 1 T it le I X C a u se d t h e G ro w th i n W o me n 's Sp o rt s 0 .1 .2 .3 .4
(Male Athletes-Female Athletes)/Total Athletes
AL AK AZ AR CA CO CT DE DC FL GA IL IN IA KS KY LA MD MA MI MN MS MO MT NH NJ NY NC ND OH OK OR PA RI SC SD TN TX UT VT VA WA WV WI WY 0 .1 .2 .3 .4 .5 W o me n t a ke ca re o f h o me , n o t co u n try 0 .1 .2 .3 .4
(Male Athletes-Female Athletes)/Total Athletes
AL AK AZ AR CA CO CT DE DC FL GA IL IN IA KS KY LA MD MA MI MN MS MO MT NH NJ NY NC ND OH OK OR PA RI SC SD TN TX UT VT VA WA WV WI WY .2 .3 .4 .5 .6 .7 Ab o rt io n Sh o u ld b e L e g a l 0 .1 .2 .3 .4
(Male Athletes-Female Athletes)/Total Athletes
Notes: Sports participation numbers are averages of the 2000-2001, 2001-2002, 2002-2003, 2003-2004 school years graphed against various attitudinal measures. The top left graph is from a 2003 Harris poll asking ―Some schools and universities have been forced to eliminate men's sports such as wrestling because they cannot afford to fund all men's and women's sports equally. In your view, is this a fair or unfair result of Title IX requirements?‖ The y-axis measures percent who say ―fair‖. The top right graphs participation against a Gallup poll asking ―How responsible do you think Title IX (the federal law prohibiting almost all high schools and colleges from discriminating in sports programs as well as other areas on the basis of gender) has been for the growth in women's sports in the last few decades? Do you think it has been--the main factor, a major factor but not the main factor, a minor factor, or not a factor at all?‖ The y-axis measures the percent saying the main or a major factor. The attitudes measured along the y-axis in the bottom graph are taken from the General Social Survey, the right measures percent who think that ―women should take care of home, not country‖, while the left measures the percent who think abortion should be legal for all women.
directly correlated with gender gap—the more people in a state believe that Title IX led to growth, the lower is the gender gap.
In general, states in which a greater proportion of the population support women‘s rights have lower gender gaps in sports. The bottom two graphs in Figure 6 show that states in which a greater percent of people believe that ―Women should take care of running their homes and leave running the country up to men‖ have larger gender gaps, while states in which more people believe that ―it should be
22 possible for a pregnant woman to obtain a legal abortion if the woman wants it for any reason‖ have
lower gender gaps.23 While it is difficult to assess the future of the gender gap—have some states simply
saturated demand?—these attitudinal believes suggest that as social attitudes about women‘s role in society shift so to may the gender gap.
VI. Selection effects, athletic participation, and the impact of Title IX
Thus far, the discussion has focused on how high school sports changed for boys and girls in the wake of a mandate that schools equalize opportunities for girls and boys. Sports participation surged for girls, and it is clear that Title IX‘s applicability to sports influenced a large proportion of the population attending school in the wake of the legislation—upward of 50% of the girls in this group were given and took the opportunity to play sports. What remains less clear is the role of sports in educating children. Sports appear to be good for children. Ask any parent or teacher of a high school athlete and you are likely to hear an enthusiastic listing of the benefits of sports. Simple correlations indicate that children who participate in sports have better outcomes than those who do not. Data from the 1997 National Youth Risk Behavior Survey indicate that adolescents who play a sport are less likely to drink, smoke,
use drugs, have sex, or have suicidal thoughts.24
The role of athletics in U.S. high schools has been debated for decades. James Coleman threw
down the gauntlet in 1961, arguing in The Adolescent Society that athletics were consuming an
unwarranted amount of resources and were shifting the focus away from the main mission of the schools. In the ensuing years, researchers have tried to resolve the controversy over the costs and benefits of high school athletics. Several papers have found a positive association between educational outcomes and
23 These questions are taken from the General Social Survey, and the answers over a number of years are combined
in order to get sufficient representation for each of the states; answers were only available for 44 states.
24 Regressions using this data suggested that white adolescent girls who played on at least one sports team are 20%
less likely to engage in sexual intercourse, 50% less likely to have had a pregnancy, one-third less likely to smoke, 20% less likely to use drugs, and 5% more likely to have never had an alcoholic drink, than those who were not on a sports team. Furthermore, the same regressions comparing girls who reported participating in intensive exercise, but were not on a sports team, with those who did not exercise, show no significant relationships between exercise and behavioral outcomes for these, non-team, athletes.
23 having participated in high school sports. Athletes have been found to both have greater academic
aspirations while in high school and ultimately attain more education than nonathletes.25 In addition,
economists have examined the potential labor market returns of participating in sports and found that
athletes tend to earn more than nonathletes.26 For example, Stevenson (2006) examines the
cross-sectional relationship between high school sports and labor market outcomes using the 1979 National Longitudinal Survey of Youth (NLSY). She shows that, controlling for basic demographics, both male and female athletes get about a year more schooling than nonathletes and earn about 15% more than nonathletes. However, adding a wide-range of controls for family background, IQ, and attitudes, she shows that athletes continue to have higher educational attainment, but these controls reduce the gap in educational attainment between athletes and nonathletes to approximately 0.4 of a year of schooling for both boys and girls and about 7% higher wages as adults. There are two things to note here: measurements of family background, cognitive ability, school characteristics, and school involvement in other activities reduce the estimated effect of athletic participation on outcomes, suggesting that athletes are a positively selected group; yet, when these controls are included, a substantial portion of the athletic education and wage premium remains.
Why might one observe a positive relationship between high school athletics and educational attainment and wages? The explanations can be grouped into three categories: selection, signaling, and treatment. The selection hypothesis is that athletes will have better outcomes because the type of student who chooses to participate in athletics has greater ability. They may have greater intelligence or they may have leadership skills, strong motivation and/or aptitude in the interpersonal domain. These positively selected types may find sports either less costly or more enjoyable and thus, they may be more inclined to participate. The selection hypothesis implies that if abilities are observable to employers and colleges
25 Rehberg and Schafer (1968), Hanks (1979), Lipscomb (2007) all examine educational aspirations.
26
The relationship between sports and wages has been investigated by Long and Caudill (1991) who look at college sports participation, finding an increase in annual incomes of 4 percent for men. Barron et al. (2000) find that those who participate in high school athletics receive more education and earn higher wages. Postlewaite and Silverman (2005) find higher earnings for male high school athletes.
24 (though not to econometricians), a cross-sectional correlation between sports participation and outcomes will be observed.
The signaling hypothesis is that even if sports does not generate human capital, sports may generate private benefits to students because they signal otherwise unobservable abilities to employers and colleges. The signaling value of athletics is an increase in productivity stemming from a more efficient allocation of human capital in the economy, although under this view, the actual sports participation may confer no direct benefit and may even be socially wasteful.
Finally, the third hypothesis is that sports are directly productive—it adds to the human capital of students by fostering the development of skills valued by the market. Athletics may teach leadership, teamwork, discipline, and endurance. Sports may also contribute to adolescent development by giving students greater access to adults, a bigger or better social network, or positive peer pressure (as fellow athletes encourage each other to keep up their grades so that they can stay on the team). These latter effects may lead to positive outcomes; however, they are unlikely to be unique to athletics.
In sum, athletes may earn more because athletics fosters the development of skills that increase productivity or because athletics signals that former athletes have higher ability. Alternatively, a cross-sectional correlation may simply reflect unobserved background variables. The first two columns of Table 3 show the percent of students in various demographic categories who were high school athletes
among those who were 14-16 years old in 1979.27 These data illustrate why assessments of causality are
so difficult. Those who participate in sports are not randomly assigned to participation in sports. Those in intact families with more parental education and income are more likely to be athletes. Those who are black or live in urban areas are less likely to participate in athletics. Finally, those with high ability, as demonstrated by the Armed Forces Qualifying Exam, are more than 20% more likely to participate in athletics.
27 The data is from the NLSY 1979. Sports participation was asked of respondents retrospectively in 1984 so these
numbers represent those attending high school in the late 1970s and early 1980s. These respondents attended high school largely after Title IX compliance was required.
25 To examine how each of these factors contribute to athletic participation , holding the other factors constant, columns 3 and 4 report probit regressions separately for boys and girls where the
dependent variable is a dummy that takes value 1 if a the student was an athlete and 0 otherwise. Column 5 shows whether the observed differences in the estimated coefficients for boys and girls are statistically significant.
As the descriptive statistics made evident, athletes are positively selected and come from more privileged families. For both boys and girls, participation rises with family income. Evaluating at the mean of the dependent variable, a rise in family income of one standard deviation is associated with a 4 percentage point rise in the probability of playing sports. Living with both parents is positively associated with sports participation; however, the coefficient is larger and statistically significant only for girls, yet the estimate is still too imprecise to conclude that both parents in the household affects boys‘ and girls‘ likelihood to participate in athletics differently. Parents, particularly fathers, with higher education are associated with an increase in the likelihood of participating in sports. Interestingly, the coefficient on mother‘s education is larger for girls, while the coefficient on father‘s education is larger for boys. Each year of a father‘s education has more than twice as large an effect on male participation rates.
While African Americans are less likely to participate in sports, the probit analysis illustrates that the difference in black and white participation rates is largely due to differences in socioeconomic characteristics of families. Controlling for whether the student lives with both parents, parents‘ education, and whether they live in a city accounts for the observed lower participation rates among blacks, and indeed, holding these factors constant, black males are more likely to participate in athletics than are whites. Among girls, there is no discernable increase in the likelihood of African Americans playing sports once controls are added.
Finally, those with higher IQ scores are more likely to participate in athletics even once family background has been taken into account. However, what the probit analysis reveals is that conditional on family characteristics boys are more positively selected on IQ than are girls. For each point higher a male student scores on the Armed Forces Qualifying Test (AFQT), his probability of being an athlete rises by