DigitalCommons@University of Nebraska - Lincoln
DigitalCommons@University of Nebraska - Lincoln
Educational Administration: Theses,
Dissertations, and Student Research Educational Administration, Department of Fall 11-2012
Nebraska Public School Administrators’ Perceptions of Preschool
Nebraska Public School Administrators’ Perceptions of Preschool
Education
Education
Jacqueline M. Florendo
University of Nebraska-Lincoln, jflorend@unlserve.unl.edu
Follow this and additional works at: https://digitalcommons.unl.edu/cehsedaddiss Part of the Educational Administration and Supervision Commons
Florendo, Jacqueline M., "Nebraska Public School Administrators’ Perceptions of Preschool Education" (2012). Educational Administration: Theses, Dissertations, and Student Research. 112.
https://digitalcommons.unl.edu/cehsedaddiss/112
This Article is brought to you for free and open access by the Educational Administration, Department of at
DigitalCommons@University of Nebraska - Lincoln. It has been accepted for inclusion in Educational Administration: Theses, Dissertations, and Student Research by an authorized administrator of DigitalCommons@University of Nebraska - Lincoln.
Nebraska Public School Administrators’ Perceptions of Preschool Education
By
Jacqueline M. Florendo
A DISSERTATION
Presented to the Faculty of
The Graduate College at the University of Nebraska In Partial Fulfillment of Requirements For the Degree of Doctor of Education
Major: Educational Administration
Under the Supervision of Professor Jody Isernhagen
Lincoln, Nebraska
Nebraska Public School Administrators’ Perceptions of Preschool Education
Jacqueline M. Florendo, Ed.D. University of Nebraska, 2012 Advisor: Jody Isernhagen
The purpose of this research study was to examine Nebraska public school
administrators’ perceptions about Pre-K and its impact on student achievement for at-risk children. The research study provided information on factors that influence school
administrators’ decisions to provide Pre-K programs. Demographic data was gathered from each participant so common group data, such as rural and non-rural disaggregated data, could be used to better analyze results and identify restrictions to implementation of Pre-K programs in schools and school districts.
An explanatory, sequential, mixed methods study was conducted during the spring and summer of 2012. The study initially gathered data using an online survey sent to elementary principals and superintendents in all public school districts in Nebraska. Interviews with a selected sample of Nebraska elementary school principals and superintendents were conducted following the survey to expand on the data results gathered from the quantitative study.
Acknowledgements
Never forget where you’ve been. Never lose sight of where you’re going. . . and
Never ever take for granted the people who travel the journey with you. Susan Gale I’ve had the privilege of working with many wonderful people throughout my life, too many to mention each by name, but two of whom could not go without my personal thanks and gratitude. Dr. Jody Isernhagen, my advisor, my mentor, my
colleague, boss and friend. Thank you for teaching me, guiding me, and encouraging me. It has been an honor and a pleasure to work under your guidance. I will be forever grateful! It was Dr. Lyn Forester who gave me the courage to begin this journey and the support to continue when the detours made the destination appear too far in the distance. I thank her for her endless support, encouragement, and friendship.
I am grateful for the support I received from faculty and friends at the University of Nebraska Education Administration Department and my colleagues within the
Education Department at Doane College. A special thanks to the NEAR Center staff who were so receptive to my many questions and guided me through the data analysis process.
To Lisa Vargason and Cindy DeRyke, your help and support were priceless! Your knowledge of technology and APA were invaluable. Knowing I had great support to lean on while preparing the final paper eased the anxiety along the way, thank you!
My sincere thanks to my committee: Dr. Jody Isernhagen, Dr. Larry Dlugosh, Dr. John Hill, , Dr. Don Uerling, and Dr. Jim Walter. I will forever be grateful for your words of encouragement, guidance throughout the research and preparation of the final paper. Most importantly, I will always treasure the passion expressed by each of you for
quality early childhood education for all children. The memories of these conversations helped keep me going through the long hours along the way.
To my friends who sent kind wishes, notes, emails and prayers while on the journey and held me accountable to “stay the course.” You will never know how much this meant to me.
With a heart filled with gratitude and love, I thank my family for allowing me to begin this journey and the endless support through its many winding roads. My parents who encouraged me to attend college, and always understood my passion for education. My sister who would continually call and check in on my progress and give those encouraging words to keep me going. Finally, to my dearest sons, their beautiful wives who shine just as much from the inside as they do from the outside, and my beautiful granddaughters, thank you! I thank you for your moral support, understanding, and patience as I put the long hours into this work. Because of the beautiful people you are, I was able to take this journey. I’m looking forward to family times ahead!
Most importantly, I want to thank my most wonderful husband! He did whatever was needed so I could complete this journey. He not only paid the bills, but was the chef, gardener, house cleaner and grocery shopper. While I was putting in the long hours on the computer, he was there to pick up the slack. He is my inspiration for patience and support and I thank him for the many times he motivated me to get to the finish line; I would not have made it there without him. You are my rock! It’s our turn now . . . I’m looking forward to “computer-free” times ahead, relaxing evenings, lighthearted
Table of Contents
Chapter 1—Introduction ... 1
Statement of the Problem and Purpose ... 1
Purpose of the Study ... 4
Research Questions ... 4
Background ... 6
Method ... 14
Definition of Terms... 15
Assumptions ... 16
Limitations and Delimitations... 17
Limitations ... 17
Delimitations ... 18
Target Audience ... 18
Significance of the Study ... 19
Chapter 2—Review of the Literature ... 21
Achievement Gap... 23
Achievement Gap and Poverty ... 24
Effects of Poverty ... 25
Increase in Poverty ... 28
Achievement Gap and English Language Learners ... 29
Achievement Gap, Race, and Ethnicity ... 30
Achievement Gap, Poverty, and Early Development ... 31
Efforts to Close the Achievement Gap ... 32
Cost Benefits of Quality Pre-K Programs ... 35
Use it or Lose it ... 41
What is Quality Early Education? ... 43
Categories of Quality Programming ... 44
High-Quality Pre-K Program Criterion ... 45
Role of Pre-K Teacher ... 48
Model Program: Educare ... 49
Nebraska Pre-K Grant Program ... 50
Bridging the Gap: Head Start and Pre-K Grant Programs ... 51
Pre-K and Achievement Gap ... 52
Summary ... 52
Chapter 3—Methods ... 54
Introduction ... 54
Purpose of the Study ... 54
Research Design ... 55
Characteristics of a Mixed Methods Research Design ... 55
Survey Variables and Measures ... 55
Purpose of the Study ... 56
Pilot Study Procedures and Results ... 57
Mixed Methods Study ... 60
Phase I: Quantitative Research Target Population ... 60
Phase I: Quantitative Research and Survey Instrument ... 61
Professional Data ... 61
School District Data ... 62
Survey Instrument Procedures ... 63
Reliability ... 67
Analysis of Data ... 68
Survey Implementation Plan ... 69
Phase II: Qualitative Research: Qualitative Case Selection ... 71
Interview Protocol ... 71
Data Collection ... 72
Research Permission and Ethical Considerations ... 72
Data Analysis ... 73
Summary ... 73
Chapter 4—Quantitative Results ... 74
Purpose ... 74
Research Questions ... 74
Research Method ... 75
Instrument ... 76
Survey Participants ... 77
School District Participation ... 77
Superintendent Participation ... 77
Elementary Principals ... 77
Demographic School District Data ... 79
Subgroup (a): Free and Reduced Lunch (FRL) Percentage Schools ... 79
Subgroup (b): Title I vs. Non-Title I Schools ... 80
Subgroup (c): English Language Learners (ELL) Percentage Schools ... 80
Subgroup (d): Rural and Non-Rural Schools ... 81
Findings of the Study ... 82
Introduction ... 82
Survey Results by Category ... 84
Quantitative Survey Results by Subcategory ... 84
Section One: Perceptions of Pre-K ... 84
Section Two: Research on Pre-K ... 85
Section Three: Curriculum ... 87
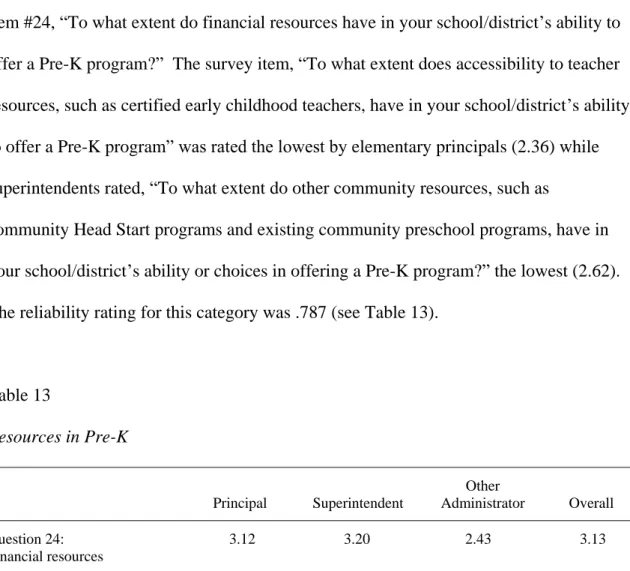
Section Four: Resources ... 88
Significant Differences Among School District Subgroups ... 89
Section Five: Free and Reduced Lunch Percentages ... 90
Section Six: Title I and Non-Title I Schools ... 92
Section Seven: English Language Learners ... 93
Section Eight: Rural Schools and Non-Rural School Districts ... 96
Section Nine: Schools with Different Student Populations ... 97
Section Ten: Schools with Preschool Programs and Schools without Preschool Programs ... 97
Pre-K Programming in School Districts ... 100
Section 11: Motivation, Limitations and Factors that Impact Access to Pre-K Programs ... 101
Section 12: Pre-K Programs in Nebraska Schools ... 101
Administrator Responses to Support Pre-K Study ... 103
Summary ... 107
Chapter 5—Qualitative Results ... 108
Introduction ... 108
Interview Protocol ... 111
Emerging Themes ... 112
Theme Summaries ... 113
Introduction ... 113
Theme 1: Perspectives on Pre-K ... 113
Theme 2: Role/Value of Pre-K ... 114
Theme 3: Research on Pre-K ... 116
Theme 4: Curriculum in Pre-K ... 117
Theme 5: Resources ... 119
Human Resources ... 119
Building/Space Resources ... 120
Financial Resources ... 121
Theme 6: Access to Pre-K Programming ... 123
Limitations and Factors that Impact Access ... 123
Transportation ... 123
All Day Programming ... 124
Policies ... 124
Expansion of Programming ... 126
Expand Pre-K to Birth-3 years ... 126
Meet Parent and Society Needs ... 127
Theme 7: Communicating Pre-K to Stakeholders ... 128
Summary ... 131
Chapter 6—Summary of Findings, Discussion and Recommendations ... 133
Introduction ... 133
Discussion and Implications of Mixed Methods Study Findings ... 133 Research Question 1 ... 134 Conclusion ... 134 Discussion ... 134 Research Question 2 ... 135 Conclusion ... 135 Discussion ... 135 Research Question 4 ... 136 Conclusion ... 136 Discussion ... 137 Recommendation 1 ... 137 Research Question 3 ... 137 Conclusion ... 137 Discussion ... 138 Recommendation 2 ... 141 Recommendation 3 ... 141 Research Question 5 ... 142 Research Question 6 ... 142 Conclusion ... 142 Discussion ... 142 Recommendation 4 ... 144 Recommendation 5 ... 144 Recommendation 6 ... 144 Recommendation 7 ... 144 Future Studies ... 145
Summary ... 146 References ... 149 Appendices ... 168
List of Tables
Table 1 Graduation Rates by Race, Ethnicity and Gender (2008-2009
School Year) ... 24
Table 2 Timeline of Study ... 70
Table 3 Administrator Titles ... 78
Table 4 School Districts Percentage of Free and Reduced Lunch Rates ... 79
Table 5 Title I and Non-Title I Schools ... 80
Table 6 Percentage of ELL Students ... 80
Table 7 Rural and Non-Rural Schools ... 81
Table 8 School District Student Population ... 82
Table 9 Category Survey Mean ... 85
Table 10 Perceptions of Pre-K ... 86
Table 11 Research in Pre-K ... 87
Table 12 Curriculum in Pre-K ... 88
Table 13 Resources in Pre-K ... 89
Table 14 Subgroup: Breakdown of Free and Reduced Lunch Rate Percentages in Schools ... 91
Table 15 Category of “Perceptions of Pre-K” Administrators with Different ELL Student Populations ... 94
Table 16 Administrators with Different ELL Student Populations ... 95
Table 17 Perceptions of Pre-K for Administrators in Rural and Non-Rural School Districts ... 96
Table 18 Schools with Preschools and Schools without Preschools Mean Ratings ... 98
Table 19 Survey Items for Perceptions of Pre-K for Schools with Pre-K and Schools without Pre-K ... 99
Table 20 Item Significant Differences between Schools with Pre-K and Schools without Pre-K ... 100
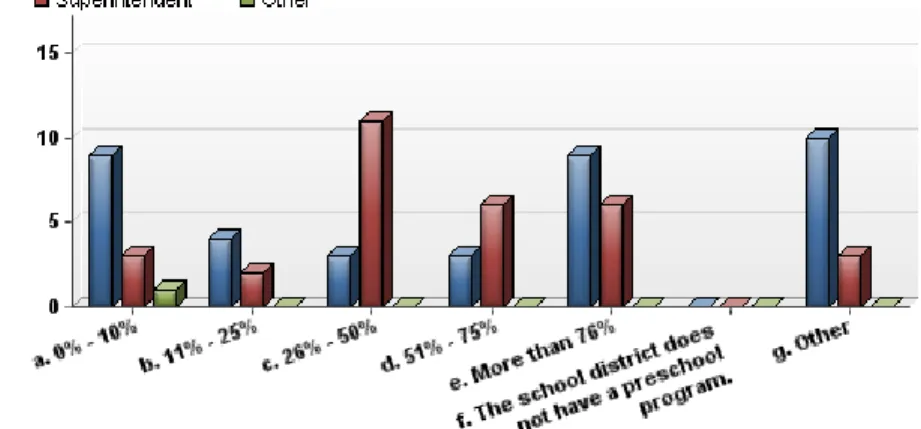
Table 21 Factors that Influence Schools to Operate a Pre-K Program ... 102
Table 22 Pre-K Programs in Nebraska School Districts ... 104
Table 23 Funding Source ... 105
List of Figures
Figure 1 Historic Increases in Education ... 35
Figure 2 Neural Circuits are Wired in a Bottom-up Sequence ... 40
Figure 3 School District Student Population ... 83
List of Appendices
Appendix A Pre-K Programs in Nebraska Schools Survey ... 168
Appendix B Telephone Script for Contacting Potential Interviewees ... 181
Appendix C Letter of Consent ... 184
Chapter 1 Introduction Statement of Problem and Purpose
Improving schools, raising academic scores, and closing the achievement gap are common sound bites heard today throughout the education arena. “It’s not good enough,” stated Nebraska Board of Education member Jim Scheer regarding Nebraska’s state math test results released in October, 2011 (Dejka & Braden, 2011, p. 3B). “Fewer than one in five black 11th graders statewide met or exceeded the state’s math standards last year . . . suggest(ing) bleak prospects for young blacks trying to advance to college or science and technology careers” (Dejka & Braden, 2011, p. 3B). Dr. Roger Breed, Nebraska
Education Commissioner, insisted that schools “look for solutions to the racial achievement gaps” (Reist, 2011, p. 1).
In looking for solutions to the achievement gap, referring to “the disparity in academic performance between groups of students” (Education Week, 2011, p. 1), various theories have appeared. Paul Barton (2003) in “Parsing the Achievement Gap: Baselines for Tracking Progress” identified multiple reasons for the achievement gap categorized in two arenas: Before and Beyond School factors: “Birth-weight; Lead Poisoning; Hunger and nutrition; Reading to young children; Television watching; Parent availability; Student mobility; and Parent participation” and School factors: “Rigor of Curriculum; Teacher Preparation; Teacher Experience and Attendance; Class-Size; Technology-Assisted Instruction; and School Safety.” Joshua Aronson (2004) wrote in Closing the Achievement Gap that the issue of trying to close the achievement gap is rooted “in the cultural stereotypes of intellectual inferiority that these students so
frequently complained about” (p. 14). Aronson continued that the issue is rooted in multi-faceted aspects including parents, schools, and poverty and that all three issues must be considered together in closing the gap, “Serious analyses make it clear that all of these factors matter. Unless we learn to think complexly about the problem, then surely we will continue to fail our big test, which is to find a way for all children to thrive in school” (p. 19).
Some gains have been made from 1992 through 2007 in closing the achievement gap scores between black and white 4th grade students. This is seen slightly in the narrowing of gaps in math and reading scores and 8th grade math scores between black and white students, as noted by the National Center for Education Statistics (NCES, 2009, 2011, as cited in Education Week, 2011). However, in examining the scores, NCES data revealed that schools are still behind in closing the gap. The Center offered several common recommendations for narrowing these gaps, including expanding Preschool education (Education Week, 2011).
A significant study on a preschool (Pre-K) program examined the effects of a high-quality, Pre-K program on academic achievement for children at-risk. The study, the High /Scope Perry Preschool Project (Schweinhart, Barnes, & Weikart, 1993), examined the impact of a quality preschool program on the lives of 123 African Americans who attended the program from 1962–1967 at ages 3 and 4, all born in poverty and at high risk of failing in school. The program model included two and one-half hour weekday classes for children and one and one-half hour weekly home visits to each mother and child on weekday afternoons, incorporating Jean Piaget’s active learning and developmental principles based on the natural development of young children (Schweinhart, 2003).
Long-term study results indicated that children who attended the program “improved their educational performance, contributed to their economic development, helped prevent them from committing crimes, and provide(ed) a high return on taxpayer investment” (Schweinhart, 2003, p. 4).
A similar study, known as the Abecedarian study, was conducted 20 years later. This study was based on a Pre-K program for children coming from poverty, examining longitudinal data on those who attended the high-quality intervention program
(Campbell, Ramey, Pungello, Sparling, & Miller-Johnson, 2002). This study reinforced the results from the Perry Preschool project. The study revealed that preschool age children who were at higher risk and attendeed a high-quality preschool program had higher cognitive test scores from the toddler years to age 21. They attained higher academic achievement in both reading and math from the primary grades through young adulthood (FPG Child Development Institute, 2000). Both significant long-term studies examined the impact of developmental, active learning preschool programs that
incorporated a parent/family connection.
A recent report released by the National School Board Association Center for Public Education, “Starting out Right: Pre-K and Kindergarten” (Hull, 2011) endorsed and provided additional support for the previous studies: “Students who attend Pre-K and then a minimum of a half day kindergarten program have significantly higher reading levels by the third grade than students who only attend full-day kindergarten” (p. 4). Additionally, “minority students, English Language Learners, and children from low-income families gain the greatest academic benefits from attending Pre-K and half day kindergarten” (Hull, 2011, p. 4). Mike Resnick, the Executive Director of National
School Board Association (NSBA), summarized the impact, “With the powerful positive impact of Pre-K and kindergarten—no matter if half or full-day—to advance student achievement, state and federal investments in early education will pay off for students, communities, and our nation” (Resnick, 2011, p. 4).
Academic, longitudinal study results from children who attended high-quality Pre-K programs present an influential case that similar programs can be a tool used to close the achievement gap. Yet, how much of this information is known to school administrators? Is early education considered as an intervention strategy to close the achievement gap in Nebraska schools?
Purpose of the Study
The purpose of this research study was to examine Nebraska public school
administrators’ perceptions about Pre-K and its impact on student achievement for at-risk children. The research study provided information on factors that influence school
administrators’ decisions to provide Pre-K programs. Demographic data was gathered from each participant so common group data, such as rural and non-rural disaggregated data, could be used to better analyze results. Common group perceptions were gathered, using the data to identify restrictions to implementation of Pre-K programs in some schools and school districts.
Research Questions
For the purpose of this study, six sub-questions were used to guide the research: 1. What do Nebraska elementary school principals and superintendents know
about research linking children in high-quality Pre-K programs and later school achievement?
2. What do Nebraska public school principals and superintendents know about research-based high-quality criteria and curriculum in Pre-K programs? 3. To what extent do Nebraska public school principals and superintendents
believe financial, facility, or human resources impact Pre-K programming in Nebraska schools?
4. Are there differences in administrators’ perceptions about Pre-K
programming, knowledge of research, understanding of curriculum, and availability of resources between:
a. elementary principals and superintendents?
b. schools with higher percentages of lower socio-economic and at-risk children and schools with lower percentages of lower socio-economic and at-risk children?
c. Title I and non-Title I schools?
d. schools with higher and lower percentages of English Language Learners (ELL) students?
d. rural and non-rural school districts?
e. school districts with different student populations?
5. What other factors influence Nebraska public school elementary principals’ and superintendents’ perceptions about Pre-K programs?
6. What types of Pre-K programs currently exist within Nebraska public schools or are associated with public schools in Nebraska?
Background
Pre-K research has been greatly impacted by new technology. The use of new medical expertise developed within the past 30 years, most specifically the Magnetic resonance imaging (MRI) has led to the newest brain development information. “It is clear that innovative methods like MRI together with MRI-based morphometry and nonhuman primate studies will transform our current understanding of human brain development” (Casey, Giedd, & Thomas, 2000, p. 1).The use of the MRI has contributed to new Pre-K research that links the importance of Pre-K with rapid brain development in the early years (Hawley & Gunner, 2000).
In 2000, a ground-breaking report was released by the National Academy of Sciences, From Neurons to Neighborhoods: The Science of Early Childhood
Development detailing the rapid brain development in the early years (Shonkoff & Phillips, 2000). This report was followed up by a report, “A Science-Based Framework for Early Childhood Policy” (Center on the Developing Child at Harvard University, 2007) reporting that, “Early experiences determine whether a child’s developing brain architecture provides a strong or weak foundation for all future learning, behavior, and health” (p. 2).
Because brain architecture and skills are built continuously over time, policies that promote healthy development throughout the early years create a foundation for later school achievement, economic productivity, responsible citizenship, and successful parenting. For children at unusually high risk, neuroscience provides a compelling argument for beginning programs at birth, if not prenatally, since a substantial amount of brain circuitry is constructed very early in life. (Center on the Developing Child, 2007, p. 3)
The research has led to the realization that the early years, the years before formal education in kindergarten begins, are critical to forming the foundation for lifelong
learning, “Neuroscience and child development research address the why and what questions about investing in young children” (Center on the Developing Child, 2007, p. 2).
This research aligns with four decades of data supporting the premise that
quality, intensive Pre-K programs can “improve a wide range of outcomes for vulnerable children well into the adult years, as well as generate benefits to society that far exceed program costs” (Center on the Developing Child, 2007, p. 2). The High/Scope Perry Preschool Study, one of the initial studies examining the long-term impact of a high-quality preschool program for children born in poverty “found evidence of preschool program effects on children’s readiness for school and their subsequent educational success, economic success in early adulthood, and reduced number of criminal arrests throughout their lives” (Schweinhart, 2003, p. 1). The Abecedarian Study supported these findings (FPG Child Development Institute, 2000). Comparable groups of children were sampled. Both groups of children, the control and intervention groups, initially were comparable on infant mental and motor tests (FPG Child Development Institute, 2000). The study provided evidence of the positive effects of preschool on intellectual development and academic achievement maintained through the age of 12 (Campbell & Ramey, 2008). Specifically, results showed that children in the intervention group had significantly higher scores on mental tests than children in the control group. Follow-up cognitive assessments completed at ages 12 and 15 years showed that the intervention group continued to have higher average scores on mental tests. The treatment/control group gap narrowed but the trajectories did not meet. Effect sizes remained moderate. Treated children scored significantly higher on tests of reading and math from the
primary grades through middle adolescence. Effect sizes for reading were large; those for math were large to moderate. . . . At age 21, cognitive functioning, academic skills, educational attainment, employment, parenthood, and social adjustment were measured and all were positively impacted (FPG Child Development Institute, 2000).
Five key principles were used in both the Perry Preschool project and the
Abecedarian study that followed guidelines for high-quality programming: (a) providing services that are of sufficient length; (b) small class sizes; (c) small teacher-student ratios; (d) programs are comprehensive in scope including a parent and family element; and (e) programs are implemented by well-trained and well-compensated staff (Center on the Developing Child, 2007).
Innovative brain development research has also opened doors to a better understanding of the important link between cognition and emotions, “When students feel socialized and accepted, they perform better academically” (Jensen, 2009, p. 20). Jensen goes on to explain that babies are born with the six hardwired emotions: joy, anger, surprise, disgust, sadness, and fear—all the other emotions, important emotions to function successfully in a classroom, must be learned, including: cooperation, patience, embarrassment, empathy, gratitude, and forgiveness. All these learned emotions are skills critical to efficiently and successfully coping in complex social environments, most specifically, the classroom (Jensen, 2009). However, brain development research tells us these skills are developed early in life with much of their formation environmentally conditioned. “Genetic factors account for between 20% and 60% of the phenotypic variance in personality, which means that the remaining 80% to 40% of the variance is attributed to environmental factors. Clearly, the environment is very important to
temperament” (Saudino, 2005, p. 4). Jensen (2009) attributed environmental factors heavily influencing temperament, as high as 50 to 70% based on Saudino’s research. Bruce Perry, an internationally recognized researcher in children’s mental health and neurosciences, supported these claims:
The systems in the human brain that allow us to form and maintain emotional relationships develop during infancy and the first years of life. Experiences during this early vulnerable period of life are critical to shaping the capacity to form intimate and emotionally healthy relationships. Empathy, caring, sharing, inhibition of aggression, capacity to love and a host of other characteristics of a healthy, happy and productive person are related to the core attachment
capabilities which are formed in infancy and early childhood. (Perry, 2001, pp. 1-2)
From this, we come to understand the link between the impact of quality early education experiences and later school success. High-quality Pre-K programs, as defined by the National Association for the Education of Young Children (NAEYC) and outlined by Sue Bredekamp and Carol Copple in “Developmentally Appropriate Practices in Early Childhood Programs (1997), reflect opportunities for holistic development. Specifically,
early childhood curriculum should reflect development of all the domains, including physical, social, emotional, aesthetic and cognitive development. Development in one domain effects development in the other domains (Bredekamp & Copple, 1997). Quality early education programs display curriculum that supports development of all domains (Bredekamp & Copple, 1997). Principles of child development and learning “inform and guide decisions about developmentally appropriate practice” in quality programs
(Bredekamp & Copple, 1997, 9). Quality Pre-K programs recognize the fact that
“children are active learners, drawing on direct physical and social experiences as well as culturally transmitted knowledge to construct their own understandings of the world around them” (Bredekamp & Copple, 1997, p. 13). It is within this construction of the
world around them and the world within them, that a child’s foundation for lifelong learning is being formed (Bredekamp & Copple, 1997).
Quality Pre-K programs fill an essential gap for children who do not have the environmental home conditions to support development of all domains, “For young children from low-income families, participation in very high-quality, center-based, early education programs has been demonstrated to enhance child cognitive and social
development” (Center on the Developing Child, 2007, p. 4).
The research creates a compelling argument that Pre-K can be an effective strategy to close the achievement gap and increase academic achievement, especially for those children most at-risk. It seems logical that Pre-K would appear to be a school improvement strategy for schools serving a significant number of children from lower socio economic families. Yet, how much of the information on early brain development, its impact on academic achievement and high-quality Pre-K research is known by school leaders?
In this era of school improvement and the importance of raising academic scores, is Pre-K used today as an intervention strategy in Nebraska schools? In 1991, the
Nebraska Department of Education began a program to distribute a small amount of funding for early education to Nebraska schools. Funding allotment increased each year and in 2000, it released its first round of grant funds, Pre-K Grant Program, available to school districts to support the development of preschool programs in Nebraska schools. This program:
is intended to support the development of children from birth to kindergarten age through the provision of comprehensive center-based programs. In most cases the projects expand and/or combine existing Pre-Kindergarten programs funded
through district, federal, or parent fees, including Head Start. (Nebraska Department of Education, 2011b)
In the first year of allocation, there were a small number of applications, “approximately 15-18 schools applied for these funds” according to Linda Meyer, Education Specialist with the Nebraska Department of Education (NDE) Office of Early Childhood. Since the first year, these funds have become very competitive as the number of schools applying for the grants continued to rise. Beginning with the school year in 2006-2007, state aid was calculated so that school districts with grant funded preschool programs, who have successfully met quality programming guidelines for three consecutive years as outlined in Rule 11, would be able to include the number of preschool children currently served in their district and eligible to attend kindergarten in the following year within their
calculated school district funding formula.
In 2010-2011, there were 157 districts in Nebraska that had their own preschool programs. Additionally, 21 districts were being served by ESUs as the managing entity for their district preschool program; together, 178 out of 254 districts in Nebraska claim ownership to a school-based Pre-K program and 175 Pre-K programs for the 2011-12 school year(L. Meyers, personal communication, October, 2011). However, in breaking down this figure, we find that Pre-K programs in Nebraska schools are defined
ambiguously. According to the 2009-2010 Annual Evaluation Report: Pre-K Grant Program – Ages 3-5 (NDE, 2010b), 71 of Nebraska’s school districts and Educational Service Units used Pre-K program grant funds to serve 3,042 children during 2009-10. The Individuals with Disabilities Education Act (IDEA) federal law mandates special education services for children with disabilities from the time they are born until they graduate from high school. Many schools have an early childhood special education
preschool program to serve special education students, ages three to five with peer role models, but this program does not cross into serving other “at risk” students. According to Meyer,
this is not a substantial number of the preschool programs, but there is no way for the state to track this; school districts that have received grant funds for Pre-K, must serve ‘at risk’ children, that includes special education; but ALL classrooms, regardless of preschool program, must meet Rule 11. (L. Meyers, personal
communication, October 2011)
Thus, the number of Nebraska school districts that have Pre-K programs to specifically address the needs of ‘at risk’ preschool-age children is not clear. This study provided additionally information on current Pre-K programs that are a part of Nebraska public schools.
Today Nebraska’s schools are increasingly serving more “at-risk” students. “The term ‘at risk’ is an ever-present word widely used to address a variety of topics, such as poverty, violence, substance abuse, low self-esteem, and school failure.” “At-risk” defined by Jan Murdoch of University of Texas Permian Basin, a higher education researcher and instructor of special education and early intervention, is similar to that of the Texas Education Agency’s (TEA) official position, “at-risk children have a greater likelihood of becoming [educationally] disabled because of conditions surrounding their births or home environments” (1999, p. 318). Similarly, Richard Sagor (1999) defines “at-risk” as a disparity between learner and learning system. “At-risk” defined by Nebraska Department of Education: Office of Early Childhood (2012) as children from families of income that qualifies them for participation in the federal free or reduced lunch program; who live in a home where a language other than spoken English is used as the primary means of communication; where parents are eighteen or younger and have
not met high school graduation requirements; and children who were born prematurely or at low birth weights.
The poverty indicator used most commonly by schools is the percentage of children eligible for free and reduced lunches. In Nebraska this has increased from 35% in 2005-06 to 42% in the 2010-11 school years (Nebraska Department of Education, 2011a). During the school year, 2010-2011, there were 21 schools in 14 districts in Nebraska that were Title I schools/districts in “Needs Improvement” status (Isernhagen & Florendo, 2011). In order to be identified as Title I, the school must be serving over 40% of children in the free and reduced lunch category. Additionally, the racial, cultural, and ethnic differences in Nebraska schools continue to become more racially, culturally and ethnically diverse and are being served in both rural and non-rural schools. In 2005-2006, Hispanic students enrolled in Nebraska schools numbered 32,795. Today that number has increased to 47,836. According to NDE in the Nebraska ELL Program Guide (2010a),
While many of Nebraska’s English language learners are concentrated in urban areas, many smaller, more rural communities are experiencing an influx of language-minority students. Schools in these locations are unlikely to have the large numbers of bilingual and ESL teachers and other resources enjoyed by schools in larger communities. This change in the number of limited English proficient (LEP) students presents a new challenge to many Nebraska districts. (p. 3)
This is reflected in Nebraska schools that are Persistently Lowest-Achieving Schools (PLAS) Tier I Schools, “the five (5) lowest-achieving Title I schools identified to be in school improvement, corrective action, or restructuring plus any Title I served secondary school with a graduation rate of less than 75% over the three latest years that was not captured in the above five schools” (NDE, 2011-2012, p. 1). All schools listed as PLAS
Tier 1 are also high in cultural/ ethnic diversity. The data revealed an increased need to invest in programs that can help close the achievement gap as the number of ‘at risk’ children in Nebraska continue to rise.
Furthermore, with the need to increase Pre-K accessibility in Nebraska schools, this also increases the likelihood that Nebraska school administrators will eventually supervise Pre-K programs. Additionally, the research links high-quality curriculum with long-term, positive results for at-risk children. The literature on administrator knowledge regarding Pre-K, it’s link to academic achievement and additionally, their knowledge of high-quality curriculum appears minimal. In reviewing research literature on
administrator perceptions regarding Pre-K, guidelines for increasing administrator and leadership knowledge of Pre-K were offered in some resources such as early education journals, books and online web sites. However, gauging an actual perception of
administrator current knowledge level about Pre-K was difficult to find. According to Kostelnik and Grady (2009), “many school administrators have little or no training in how to design, implement, and evaluate programs for the very young children” (p. vii). This study sheds some light on school administrators’ perceptions and understanding of quality Pre-K, best practices, and current efforts to link school improvement and Pre-K.
Method
A mixed methods research design was selected in order to address the primary and secondary research questions in this study. This design is based on the collection of quantitative data, using qualitative data to elaborate or better identify and explain quantitative results (Creswell, 2005). A survey developed by the researcher was distributed to all Nebraska school elementary principals and superintendents via email.
After the survey data was tabulated and analyzed, interviews were conducted with a sample of Nebraska school administrators. Additionally, data was collected and
categorized in subgroups with similar: student population sizes; free and reduced lunch percentages; ELL student populations; Title I and Title I schools; and rural and non-rural schools.
Definition of Terms
For the purpose of this study, the following definitions are given:
Center-based program—Programs for children ages birth to kindergarten operated for a group of children in a classroom on a part-day (less than 6 hours) or full-day (6 hours or more) basis. The program provides a learning environment that promotes holistic development across all domains and promotes instructional and interactional strategies that are individualized, family centered, and identify goals related to learning and child outcomes.
Early Head Start—Identical to Head Start except typically serving infants through 36 months old.
Head Start—National federally funded program that promotes school readiness by enhancing the social and cognitive development of children through the provision of educational, health, nutritional, social and other services to enrolled children ages 0-5 years that come from vulnerable families. Typically the program is referred to as serving 3-5 year olds.
High-quality early childhood care and education programs—Pre-K programs that demonstrate specific criteria which has been proven to produce short- and long- term positive effects on children's cognitive and social development (NAEYC, n.d.).
Infant/Toddler Programs—Pre-K and care programs serving infants through 36 months.
Kindergarten programs (K)—Programs serving five- and six-year olds.
Early Childhood Education—The period of a child’s life from birth through age 8. Pre-K - For the purpose of this study, Pre-K will specifically refer to the
preschool years, ages three through five.
Preschool—Pre-K programs serving children beginning at 36 months through five years of age.
Rule 11—Regulations for any Pre-K Program in Nebraska Schools.
Title I—Schools where at least 40 percent of the children in the school attendance area are from low-income families or at least 40 percent of the student enrollment are from low-income families are eligible to receive federal Title I funds (Great Schools, n.d.)
Assumptions
As a higher education early childhood educator, researcher, administrator, and consultant, this researcher has worked in the profession for over 22 years and has worked with schools and school administrators in various capacities for the past 18 years. One critical assumption of the researcher is that it is possible, based on the review of literature, to measure the knowledge administrators possess in the field of Pre-K. The researcher assumes that the survey and interview tools that were used for this study yielded accurate information from principals and superintendents of what they know about Pre-K. Additionally, the researcher assumed that some administrators do not possess the facts and information necessary to use with stakeholders in gaining
unconditional support for Pre-K programming in their school district. The information gained in this research can be used to support higher education efforts to better equip future administrators with Pre-K knowledge and skills, including research in the field of early childhood education that connects quality programming to student academic achievement.
Limitations and Delimitations
Limitations and delimitations are discussed to analyze possible threats to the study’s validity and to acknowledge existing flaws to the research design.
Limitations. Limitations are conditions that restrict the scope of the study or may affect the outcome and cannot be controlled by the researcher. The researcher
acknowledges these limitations in this study:
1. Only Nebraska administrators participated in this study, thus results were limited to state boundaries.
2. Quantitative results were limited to those administrators who have access to the survey and those who took the time to complete the survey. These factors may have inhibited the sample population.
3. Compilation of the research was limited to the willingness of the participants who completed the survey; this may have impacted the follow up interviews. 4. One school district chose not to participate.
5. Some school districts may have had limited access to the survey for administrators, limiting the data accumulated.
6. Some participants may not have answered truthfully or at all. 7. Qualitative data was subject to a variety of interpretations.
8. Survey participants were not perfectly, evenly distributed per administrator role, per geographic area or per school demographic category.
9. Some school districts were represented more than once if both the
superintendent and elementary principal or multiple principals participated from the same school district.
Delimitations. Delimitations are restrictions/bounds that researchers impose prior to the inception of the study to narrow the scope of a study. The researcher acknowledges delimitations to the study:
1. Only Nebraska public school administrators were used for the sample
population, thus eliminating private and other school districts outside the state who may share different perceptions about Pre-K.
2. An email survey does not guarantee that the most knowledgeable administrator within the school district participated in the study.
3. This study took place at a time when Pre-K was getting an enormous amount of attention and support to enhance programming and services. Duplicating this study five years from now may not produce identical results.
Target Audience
The target audiences for this study were administrators in Nebraska public schools, specifically, superintendents and elementary principals. While administrators were the specific focus, the findings from the study can also benefit other organizations. Higher education institutions can gain an understanding of what administrators currently know about Pre-K and what needs to be implemented in school leadership and
arena. State departments may utilize the findings to encourage school improvement efforts linked to Pre-K.
Significance of the Study
The long-term impact research studies on the benefits of Pre-K supported by brain development research affirm that quality Pre-K programs can positively influence
academic achievement for children, especially those most at-risk. This study aimed to gain an understanding of what Nebraska school administrators know and understand about this information. Currently, it is not clear what they know and the extent of their knowledge about Pre-K research. Thus, higher education institutions can benefit from having a better understanding of what administrators currently know and information they need to enhance their skills and knowledge in the arena of Pre-K. With 175 current school districts in Nebraska associated with early education programs, it is important that school administrators understand the research and quality programming criteria in order to gain the positive results from their Pre-K program, for the children, schools, and communities they serve. Additionally, state departments can benefit from the information by acquiring insight on possible factors that influence schools in providing Pre-K
programs. In disaggregating the data, additional information was gained on availability of school and community resources in implementing district Pre-K programming,
uncovering constraints and identifying restrictions.
The gathering of common group data can be used to educate and advocate for additional resources or reduce current limitations on programming. The significance of this study is supported by a lack of current information available to gage current perceptions of Pre-K by school administrators.
In today’s society with limited resources and the urgent cry to close the
achievement gap, it is critical that policy makers choose wisely among the various tools and strategies to support educational achievement for all students. Additionally, it is widely accepted that our nation’s future success and security begins with the well-being of all our children. School leaders are key, “The administrative role is so important that the National Association of Elementary School Principals has declared Pre-K to be a significant responsibility for elementary principals” (Kostelink & Grady, 2009, p. 24). In order to be effective in meeting this ‘charge’ we must first gauge what administrators know about Pre-K.
Chapter 2
Review of the Literature
For the first time ever, we are looking ourselves in the mirror and holding ourselves accountable for educating every child. That means all children, no matter their race or income level or zip code. (Former Secretary of Education, Margaret Spellings, 2006)1
“The ‘achievement gap’ in education refers to the disparity in academic performance between groups of students” (Education Week, 2011, p. 1). Wikipedia describes achievement gap as “the observed and persistent disparity on a number of educational measures between the performance of groups of students, especially groups defined by gender, race/ethnicity, and socioeconomic status” (2011, p. 1). The
achievement gap is commonly revealed in test scores, high school dropout rates, and higher education statistics as well as course selections.
It is most often used to describe the troubling performance gaps between African-American and Hispanic students, at the lower end of the performance scale, and their non-Hispanic white peers, and the similar academic disparity between students from low-income families and those who are better off. (Education Week, 2011, p. 1)
When the report, A Nation at Risk, was released in 1983, attention was given to the poor scores in mathematics and science achievement of American students,
particularly those who were economically disadvantaged (Walberg, 2010). Reform efforts in education were developed to confront the problem. The 1983 report revealed that even though 13% of all 17-year-olds in the United States would be considered functionally illiterate, minority youth account for 40% of the illiterate (U.S. Department of Education, 1983). An updated report, A Nation Still at Risk (1998), revealed how only
1
Secretary Spellings’ prepared remarks at the Urban Alternative’s 18th Annual Church Development Conference for Pastors and Church Leaders.
slight progress had been made, including little progress in the disparities between the groups of students.
Fifteen years after the initial report, 10 million American students reached the 12th grade without learning to read at a basic level, “The numbers are even bleaker in minority communities” (Bennett, et al., 1998, p. 23). Goals 2000 recommended new education efforts to “raise standards and measure achievement” (Walberg, 2010, p. 1). In 2001, a new education reform movement titled “No Child Left Behind” (NCLB) again aimed to raise student achievement and close the disparities between groups of students. At that time, only 32% of 4th graders were able to read at the proficient level; of those, only 7% of the students who scored at the proficient level were eligible for free or reduced lunch, 6% were Black, 8% were Hispanic and 16% were Native American (U.S. Department of Education Budget Service and The Nation’s Report Card, 2002b). Thus, most of the 68% who were not proficient were minority children and/or children who live in poverty (U.S. Department of Education Budget Service and The Nation’s Report Card, 2000). This is also significant as research, most notably that of the National Reading Panel (2000), has determined those who have not reached reading proficiency level by the 4th grade, the gap only grows much wider and hope diminishes significantly for reading proficiency, if no extreme intensive intervention strategies are employed. “If students don’t make this transition on time academic life will only become more challenging as the school years go on. A fourth grader who reads at a first- or second- grade level doesn’t understand one-half to two-thirds of the curriculum. . . . Researchers have found that a poor readers in third grader likely will be a poor reader in high school”
(Breazile, 2011, p.12). Thus early problems lead to long-term academic and social issues (Breavile, 2011).
Achievement Gap
Recent assessment reports disclose that African American and Hispanic students have shown improvement in their performance in reading and mathematics over the past ten years. However, a gap in achievement between whites and minority students still exists. The National Center for Education Statistics (NCES) in 2009 and 2010 reported that an average of more than 20 test-score points on the NAEP math and reading
assessments for 4th and 8th grades still exists between whites and African Americans and Hispanic students accounted for a difference of approximately two grade levels (cited in Education Week, 2011).
In July, Education Week (2011), updated an “Achievement Gap” report originally published in 2004. The updated graduation data from the Education Research Center’s for annual Diplomas Count report site:
While 82.7% of Asian students and 78.4% of white students in the class of 2008 graduated on time, that was the case for only 57.6% of Hispanic, 57% of black and 53.9% of American Indian students . . . 68% of male students graduated on time in 2008, compared with only about one half of male students from minority backgrounds. (Education Week, 2011, p. 2)
Table 1 displays the graduation rates in Nebraska for the school year 2008-2009 outlining the disparities in racial and ethnic groups of students (Breazile, 2010).
Adding to the graduation rate, disparities in college bound students are also reflected in race and ethnicity. Sixty-two percent of qualified White high school graduates enter college, while only 12% of similarly qualified Hispanic graduates and
Table 1
Graduation Rates by Race, Ethnicity and Gender (2008-2009 School Year)
Students Graduation Rate (%)
Ethnicity White 93.23 Black 69.36 Asian 93.79 Hispanic 77.79 Indian 68.59 Gender Female 91.48 Male 88.33 Nebraska Total 89.88
14% of Black high school graduates enter college (U.S. Department of Education, National Center for Education Statistics, 2010, Table 235).
Achievement Gap and Poverty
Many studies show that achievement disparities closely align to socioeconomic aspects. “Equal educational opportunity is the next great civil rights issue. . . . The educational gaps between advantaged and disadvantaged students are huge, handicapping poor children in their pursuit of higher education, good jobs, and a better life” (Bennett et al., 1998, p. 4).
One of the largest studies conducted on kindergarteners examined the link between children of lower socio-economic status - children of poverty - and school achievement and how this disparity is strikingly evident before the children enter school. Lee and Burkam, in Inequality at the Starting Gate (2002), reported a vast difference in
children’s first grade reading and mathematics scores revealing that the lower their socioeconomic status, the poorer their scores before they entered first grade.
Poverty was described as the condition of having little or no money, goods, or means of support; implies a state of provisional or lack of necessities (Dictionary.com LLC, 2012). Eric Jensen (2009) explained poverty as having insufficient income to purchase basic needs—food, shelter, clothing, and other essentials. The income level set by the Office of Management and Budget (OMB) establishes the official poverty
thresholds. Poverty is also based on geographic location, as the cost of living varies according to the region of the country one lives (Jensen, 2009). Jensen described six types of poverty. This paper will primarily refer to these five types of poverty:
1. situational - caused by a sudden crisis or loss and is often temporary; 2. generational - occurs in families with a minimum of two generations of
poverty and are not equipped to move out of the situation;
3. relative - refers to the economic conditions of a family and income does not provide for the average standard of living;
4. urban - takes place in metropolitan areas of more than 50,000 people and consists of complex and combined chronic and acute stressors (violence, noise etc.), dependent on other services and programs to meet needs; and
5. rural - occurs in areas with less than 50,000 people with less access to support services.
Effects of Poverty
Poverty has been associated with various factors that impact development and influence academic achievement. Children of poverty move more frequently, have
multiple transitions, and change schools more often. “Student mobility refers to changes in school enrollment at times other than those prompted by program design” (Rhodes, 2005, p. 2). Research indicates that as students move more frequently, they face an increased risk of lower test scores and of dropping out (Fowler & Seibert, 2008; Rumberger, 2003).
Children from poverty are associated with a lack of adequate nutrition that adversely impacts development. “Good health, both physical and behavioral, is an essential element to a productive life” (Breazile, 2010, p. 43). Inadequate nutrition can hinder mental development, disrupt cognitive development, and is particularly more devastating in the first few years of life when the brain is growing rapidly. A number of researchers in the U.S. have determined that children with a history of malnutrition attained lower scores on intelligence tests, and have attributed long-term impact on a child’s motor skills, physical growth, and social and emotional development than children of similar social and economic status who were properly nourished (Brown & Pollitt, 1996). According to Brown and Pollitt (1996) “Research has firmly established that under nutrition in early life can limit long-term intellectual development . . . low economic status can exacerbate all these factors, placing impoverished children at particular risk for cognitive impairment later in life” (p. 43). Thus the impact of poverty can dramatically affect a student’s capability to learn.
Children’s health and well-being are impacted by poverty, including prenatal care. Poverty is associated with premature births and low birth weight. In a National
Longitudinal Survey of Youth-Child Data (1986-1996) examining the impact of birth factors associated with social risk factors on children’s developmental outcomes, birth
weight is significantly associated to developmental outcomes of key social and economic controls and significantly more pronounced at very low birth weights (Boardman,
Powers, Padilla, & Hummer, 2002).
Children of poverty suffer from environmental factors that influence low-quality child care and positive early learning opportunities; poorer health and school readiness traits; they are more likely to live in unsafe neighborhoods; suffer from trauma, abuse and/or neglect; experience parental depression, and domestic violence; and experience exposure to environmental toxins; (Anderson Moore, Redd, Burkhauser, Mbwana, & Collins, 2009; Brooks-Gunn & Duncan, 1997) Additionally, Walberg (2010) explains how poverty is linked to child rearing practices that include “fewer verbal interchanges, less praise and affection and provision of poor problem-solving strategies” impact achievement (p. 34). These children can benefit from quality Pre-K, child care, or
preschool settings. “These center-based programs can offer the parent respite from child care and teach the child communication and problem-solving skills that may buffer the child from some effects of neglect” (Wasik, 1998, as cited in DePanfilis, 2006, p. 55). Impoverished families are overstressed in trying to meet the daily needs of their families, which can result in depression, difficulty in nurturing, disengagement, and difficulty focusing on the needs of the children (Jensen, 2009). Low-income children experience less cognitive stimulation, less enriched vocabulary, as well as language interaction (Hart & Risley, 1995). They are less likely to engage in literacy activities, such as visiting the library or reading at home then middle to wealthier children (Federal Interagency Forum on Child and Family Statistics, 2000). In a study conducted by Walker, Greenwood, Hart, and Carta (1994), “When combined with a composite SES
indicator, socio-economic factors, early child language production significantly increased the variance accounted for in the prediction of elementary language and academic
competencies in each subsequent year in elementary school” (abstract). Quantity and quality of vocabulary is strongly linked to literacy development and academic success. Children from lower socio-economic families enter kindergarten up to four times behind their counterparts in language, expressed in their vocabulary(Hart & Risley, 1995). In lower socio-economic families, parents were less likely to visit the library or read at home with their children. According to a national survey by U.S. Department of Health and Human Services, “59% of American parents above the poverty line were involved in three or more school activities on a regular basis; this contrasts with 36% of parents below the poverty line” (Evans, 2004, p. 81). Additionally, chronic and unpredictable stresses, which families of poverty are more prone to, weakens the brain’s capacity to learn, and decreases memory, and impairs attention and concentration (Yang, Cao, Xiong, Zhang, Zhou, & Wei, 2003).
Increase in Poverty
Poverty is on the rise. More than 16.4 million American children are poor, and living in working families, with a disproportionate number of the children Black and Latino (Children’s Defense Fund, 2011a).
46.2 million poor people in America, the largest number in the last 52 years. One in three of America’s poor were children—16.4 million—over 950,000 more than last year. The new numbers are grim and shameful—22%—or over one in five children in America—lived in poverty in 2010. Children under five suffered most—one in four—or 5.5 million infants, toddlers and preschoolers were poor in 2010. Children are the poorest age group in the country and getting poorer. . . . Children of color were disproportionately poor: 4.4 million Black children—more than one in three—and 6.1 million Hispanic children—one in three—were poor. Five million White, non-Hispanic children—more than one in ten—were poor. (Children’s Defense Fund, 2011a, p. 1)
All three levels of poverty (overall, family and child) in Nebraska have increased statistically since 2000, following a period of decline in the 1990s. The number of Nebraska children in poverty has increased from 10% to 15.2% over the past ten years (Breazile, 2010). Thus, the potential is there for more children to be impacted by poverty and its effects on school achievement. Nebraska’s State of the Schools Report (2010-2011) mirrors these research studies on the effect of poverty (Nebraska Department of Education, 2011a). Nebraska student scores overall are quite high with an overall average of 84.3% for 3rd through 8th grade. The average score for Nebraska students proficient in reading in 2009-10 for grades 3rd – 8th and 11th grade was 68.64%; in 2010-11 this was 71.82%. However, Nebraska students’ on Free and Reduced Lunch’s average proficient score in Reading in 2009-10 was 53.49% and 2010-11 was 57.96% (Nebraska Department of Education, 2011a).
Achievement Gap and English Language Learners
English language learners (ELL), another group of students associated with disparities in the achievement gap, is the term used for students whose primary language is something other than English, aged 3 through 21, enrolled or prepared to enroll in an elementary or secondary school, and who have difficulties speaking, reading, writing, or understanding English (Nebraska Department of Education, n.d.a.). Students face
academic challenges when they have difficulty speaking English. ELL students are more often placed in remedial or low level courses, taught basic skills, and have less access to courses that prepare them for college (National Council of La Raza, 2009).
. . . ELL students are much less likely than white students to score at or above the proficient level in mathematics. The measured gaps are in the double digits, such as in Florida 45% of ELL 3rd-graders scored at or above the proficient level on
the math assessment, compared with 78% of white 3rd-graders, yielding a white-to-ELL gap of 34 percentage points ” (Fry, 2008, p. iii).
Reading scores are primarily most affected (Fry, 2008, p. 3).
This too is mirrored in Nebraska test scores. Overall, 71.82% of Nebraska students scored at the proficient level on the Nebraska State Assessment (NeSA) in Reading in the 2010-11 school year. However, only 38.72% of ELL students scored proficient in Reading on the NeSA test in 2010-11 school year (Nebraska Department of Education, 2011a).
Achievement Gap, Race, and Ethnicity
There is also a correlation with race and ethnicity and the achievement gap. A number of recent studies have attempted to investigate the correlation. Status and Trends in the Education of Racial and Ethnic Minorities (KewalRamani, Gilbertson, Fox, & Provasnik, 2007) examined the education of the major racial and ethnic groups in the United States from pre-kindergarten through the postsecondary level, employment and income data. The report identified a variety of factors that are correlated with the achievement gap, then examined these in relationship to Black and White students. The report revealed that Black students were more likely than White students to come from poverty. The National Assessment of Education Progress (NAEP) attempted to isolate key variables related to the Black-White achievement gap. Barton and Coley (2007) associated student achievement, as measured by NAEP, with four home factors: the presence of two parents in the home, the hours children spend watching television, the hours parents spend reading to them, and the frequency of absence from school. The results revealed that Black students compared to White students, were less likely to come from a family with both parents in the home, spent more hours watching television, were
read to by their parents for fewer hours, and were more likely to be absent from school. Parsing the Achievement Gap II considered 16 factors that were previously associated with how well students performed in school (Barton & Coley, 2009). These include: seven school factors (curriculum rigor, teacher preparation (certification), teacher experience, teacher absence and turn over, class size, availability of instructional
technology, fear and safety at school); home and school connection (parent participation); and eight before and beyond school factors (frequent changing of schools, environmental damage, hunger and nutrition, talking and reading to babies, excessive television
watching, pupil/teacher ratio, and summer academic gains and loss).
Using data from NAEP and other sources, the report said that for all 16 factors there were gaps that favored White students over Black students--for example, White students were more likely than Black students to attend schools offering rigorous curriculums and less likely to suffer from low birth weight. (Vanneman et al., 2009, p. 2).
Achievement Gap, Poverty, and Early Development
A relationship between poverty and the achievement gap exists. Even more so, the disparities in the achievement gap for children of lower socio economic status occur even before entering kindergarten. Research from Klein and Knitzer (2007, p. 2) reveals that poverty and early development are associated:
The average cognitive scores of preschool-age children in the highest
socioeconomic group are 60% above the average scores of children in the lowest socioeconomic group.
At 4 years of age, children who live below the poverty line are 18 months below what is normal for their age group; by age 10 that gap is still present. For
children living in the poorest families, the gap is even larger.
By the time children from middle-income families with well-educated parents are in third grade, they know about 12,000 words. Third grade children from low-income families with undereducated parents who don’t talk to them very much have vocabularies of around 4,000 words, one-third as many words as their middle-income peers. (Klein & Knitzer, 2007, p. 2).
Other identified factors that are associated with poverty and have been shown to impact achievement include: welfare dependency, absent parents, one-parent families, unwed mothers, and parents who did not graduate from high school (U.S. Department of Commerce: Bureau of the Census, 1997). These factors are associated with child
outcomes of ‘not in school and not working’ and teenage pregnancy (U.S. Department of Commerce: Bureau of the Census, 1997), with some factors associated with more adverse outcomes than others.
Children who are identified with one or more of any of these factors (poverty, high mobility, ELL, single parent, welfare dependency, absence of parents, unwed mothers, and parents who did not graduate from high school) are associated with being ‘at risk’ academically. The more obstacles or factors children experience, the more likely they are to stumble in school and later as adults. These risk factors align with the achievement gap and present the challenges in overcoming “the disparity in academic performance between groups of students” (Education Week, 2011, p. 1).
Efforts to Close the Achievement Gap
With passage of NCLB in 2001, a new urgency was put on schools to overcome and break through the achievement gap and set the same performance targets for children from economically disadvantaged families, for children with disabilities, for children with limited English proficiency, and for children from all major ethnic and racial groups (National Governor’s Association Center for Best Practices, n.d.). If a school fails to meet performance targets, schools may be eligible for additional financial resources. However after repetitive failure to meet academic benchmarks, schools may face