ICIS 2005 Proceedings
International Conference on Information Systems
(ICIS)
12-31-2005
Understanding Digital Inequality
JJ Hsieh
Hong Kong Polytechnic University
Mark Keil
Georgia State University
Arun Rai
Georgia State University
Follow this and additional works at:
http://aisel.aisnet.org/icis2005
This material is brought to you by the International Conference on Information Systems (ICIS) at AIS Electronic Library (AISeL). It has been accepted for inclusion in ICIS 2005 Proceedings by an authorized administrator of AIS Electronic Library (AISeL). For more information, please contact
Recommended Citation
Hsieh, JJ; Keil, Mark; and Rai, Arun, "Understanding Digital Inequality" (2005).ICIS 2005 Proceedings.Paper 45.
JJ Po-An Hsieh
Hong Kong Polytechnic University
Hong Kong
[email protected]
Mark Keil
Georgia State University
Atlanta, GA U.S.A.
[email protected]
Arun Rai
Georgia State University
Atlanta, GA U.S.A.
[email protected]
Abstract
Digital inequality is one of the most critical issues in the knowledge economy. Governments, businesses, and the public have devoted tremendous resources to address such inequality, yet the results are inconclusive. Theoretical understanding, complemented with theory-based empirical assessment of the phenomenon, is essential to inform effective policy-making and intervention. The context of our investigation is a city government project known as the LaGrange Internet TV initiative that allowed all city residents to access the Internet via their cable TVs at no additional cost. We examine the residents’ acceptance behavior through the lens of the theory of planned behavior (TPB), which focuses on attitudes, subjective norms, and perceived behavioral control, as explanatory variables of innovation decisions. The theoretical focus of TPB is expanded to include exposure to innovation. Furthermore, we elaborate potential behavioral differences between privileged and underprivileged adopters. The results of the multigroup analysis reveal different behavioral models between the two groups. Enjoyment and confidence in using information and communication technologies (ICT) and accessibility are more influential in shaping ICT innovation decisions for the underprivileged than the privileged. The privileged group has a higher tendency to respond to exposure to innovation and may adopt ICT faster than the underprivileged. Implications are discussed for policy-making and theoretical development.
Keywords: Digital divide, digital inequality, public IT policy, adoption of innovation, diffusion of innovation
Introduction
Digital Inequality
The Internet, or the information superhighway, is recognized as a strategic building block for the development of a nation’s economy. Ironically, the United States (birthplace of the Internet) has fallen behind in the household adoption of high-speed Internet access. Household penetration of high-speed Internet access in the United States is at 18 percent, putting it far behind many other countries such as Korea (75 percent), Canada (36 percent), and Japan (27 percent) (Dreazen 2003). These data signal a problem that may threaten future U.S. economic development, governmental efficiency, social structure, and ultimately the ability to compete in the global market.
President Bush recently stated a goal of offering “every American access to high-speed Internet connections by 2007” without giving specifics as to how this was going to occur (Dow Jones Newswires 2004). To reach this goal effectively and efficiently, policy makers must gain an understanding of the factors that drive the household adoption and use of ICT.
1
The concept of digital divide refers to the gap between ICT haves and have-outs, which offers a binary view of technology ownership (DiMaggio et al. 2004). This dichotomous perspective, however, permits limited insight into the continuous discrepancy in ICT post-adoption behavior. On the other hand, the concept of digital inequality goes beyond a binary perspective and should provide greater insights into the range of differences in ICT post-adoption behavior.
The Internet has tremendous economic potential for individuals, organizations, and nations, in terms of productivity and capability to compete in global markets. It also promises opportunities to increase human resource value, invigorate social and economic structures, reconfirm the sense of community, enhance citizen involvement, and improve governmental administration efficiency (United States Advisory Council on the National Information Infrastructure 1996). However, digital inequality (DI), which refers to the inequality in the access and use of information and communication technologies (ICT) (DiMaggio et al. 2004),1 between
individuals across income, education, age, race, gender, and geographic locations prevents those underprivileged from exploring digital opportunities (Lenhart 2002). Within the United States, the underprivileged are usually characterized as poorer, lower education attainment, older, black or Hispanic, disabled, and living in inner city or rural areas. Among these factors, income and education, indicators of one’s social economic status, are the most significant discriminators (Lenhart 2002). Such inequality implies that people from underprivileged and privileged groups act differently in their access and use of ICT.
Despite huge investment, telecommunication deregulation, and efforts from the U.S. government and private organizations to promote ICT, critical issues remain. Many people stubbornly cling to the belief that digital inequality can be solved by addressing a single factor: technology access. While some underprivileged may have benefited from technology-focused interventions, many others are still unable to adopt ICT (Lenhart 2002). Unfortunately, even for those underprivileged who adopted and started using ICT, factors other than technology access (e.g., knowledge) exist and cause further inequality in post-adoption behavior (DiMaggi et al. 2004; Lenhart 2002). This paper focuses on the differences in post-adoption behavior and the factors that lead to them. In fact, most efforts have focused on providing technology access, yet these efforts have been criticized as generic and treating every individual as the same (Hoffman et al. 2001). Implicit in this criticism is the notion that the underprivileged differ in their response to technology, as compared to more privileged members of society, and that there may be barriers other than technology access which impede adoption and use of ICT. Thus, researchers have begun recommending customized programs and targeted resources to meet specific needs of different groups (Hoffman et al. 2001).
Most works about digital inequality are policy documents, project reports, or Web-based working papers which descriptively profile the phenomenon and report patterns and changes in inequality (Kvasny 2002). Although examining trends and status of inequality is important, it is critical to develop a theoretical understanding about the phenomenon (DiMaggio et al. 2001). It would be particularly useful to investigate theoretically the differences in the underprivileged and privileged adopters’ innovation decisions and the factors that lead to these differences. This theoretical understanding will enable policy makers to effectively formulate policies to efficiently allocate resources to attain planned outcomes.
The Free Internet TV Initiative in LaGrange, Georgia
LaGrange, with a population of 27,000, is located 60 miles southwest of Atlanta, Georgia. The LaGrange city government, unlike most municipal governments in the United States, finances their operation by collecting sales tax and generating utility revenue by providing utility services, without charging property tax (Keil et al. 2003). The utility services offered include electricity, natural gas, sanitary, and telecommunications to both commercial and residential customers. To keep existing and to attract further business investment, the city government purchased the old cable system and upgraded it to a two-way 750 MHz hybrid system with 18 fiber optic nodes around the city in the 1990s. Each node further connects to between 500 and 900 households via coaxial cable. In addition to cable TV and broadband services offered via this infrastructure, in April 2000, the city officials devised a three-way contract with the cable company and Internet service provider (ISP) to use the excess bandwidth to provide an Internet TV service to every household at no cost. Therefore, residents do not have to pay extra beyond the $8.70 basic cable TV service per month, while such Internet service is usually charged from $4.95 to $16.95 per month. With this free Internet TV initiative, the city government expected to address digital inequality, prepare the labor force by developing their Internet skills, and eventually attract further business opportunities.
The Internet TV is a television-based Internet access device. Subscribers receive a free wireless keyboard and digital set-top-box, which connects the cable and TV. Users can use the wireless keyboard to browse the Internet via their TV. At the rate of 158 Kbits per second, the connection speed is almost three times higher than the typical dial-up service (56 Kbits/sec). Subscribers also enjoy unlimited access, a free e-mail service, 5 MB of Web space, and a technical support hotline 7 days a week (Keil et al. 2003). Training sessions are available in the community center, over cable TV, as well as through the technical support hotline.
The Internet TV is user-friendly in that users do not have to install or maintain an operating system or application programs. However, the Internet TV does not allow printing, storing files, upgrading, and browsing Websites that need software plug-ins (e.g., Adobe Acrobat and Apple QuickTime). Users also cannot use the Internet TV and watch TV simultaneously.
The LaGrange Internet TV initiative is the first project in the world in which a city government offered devices that provide free Internet access to every household. Compared to a typical Internet PC, the Internet TV is easier to use, yet more limited in its capability. Still, the Internet TV represents a chance to connect those who might not otherwise explore high-speed household Internet access and all that it has to offer. The context provides a unique opportunity to study the behavioral patterns in ICT usage across privileged and underprivileged groups when a government initiative was implemented to eliminate economic and ease technical barriers. Our interest here is whether the two groups exhibit any significant differences with respect to use of the technology and the factors that drive use.
TPB as the Theoretical Framework
Since digital inequality concerns disproportionate access and use of ICT, the solid psychological foundation of adoption of innovation (AOI) provides an excellent base to advance theoretical development of this phenomenon. The theory of planned behavior (TPB) (Ajzen 1991), which focuses on attitude (A), subjective norms (SN), and perceived behavioral control (PBC), provides a good theoretical lens for the phenomenon. Diffusion of innovation theories (Rogers 1995; Valente 1995) suggest that exposure to innovation may also shape individual adoption behavior. Therefore, we focus theoretical attention on TPB-related factors (attitude, SN, and PBC) and exposure to Innovation in our investigation.
The above discussion leads to our major research question:
In the context of government-sponsored digital inequality initiatives that provide ICT access, are there differences in post-adoption behavioral models between privileged and underprivileged adopters?
Theory, Research Model, and Hypotheses
The theory of planned behavior, the theory of reasoned action (TRA) (Fishbein and Ajzen 1975), and the technology acceptance model (TAM) (Davis 1989) are the three most applied and validated theories investigating ICT usage at the individual level and are able to explain a considerable amount of variance in the dependent variables (Legris et al. 2003). TRA contends that an individual’s attitude and subjective norms, or the perceived expectation from important others for the individual to perform the behavior of interest, will influence the individual’s behavioral intention (BI) which will in turn determine the individual’s behavior (B). TPB expands and strengthens TRA by incorporating a third belief construct, perceived behavioral control, to represent the internal and external barriers in performing the behavior (Ajzen 1991). One of the major strengths of TPB over TRA is its ability to analyze a situation where individuals do not have volitional control over their behaviors. In the context of digital inequality, underprivileged people may not have volitional control over necessary resources, knowledge, and opportunities (Kvasny 2002; Lenhart 2002).
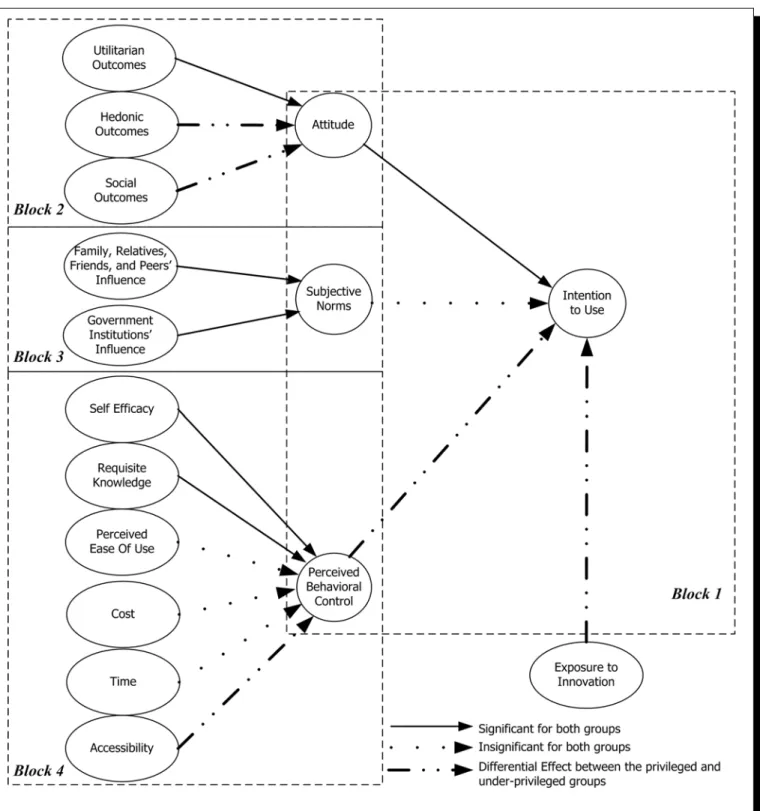
TAM proposes that perceived usefulness (PU) and perceived ease of use (PEOU) will influence BI that, in turn, determines behavior (Davis 1989). Its focus on PU and PEOU is ideal for studying the design factors of a specific technology. TPB, however, tends to capture information about social and behavioral control in the implementation process (Mathieson 1991; Taylor and Todd 1995). These social and behavioral control factors have been suggested as crucial in the context of understanding digital inequality (Kvasny 2002). TPB thus serves as an ideal theoretical background for this investigation. Since TPB suggest BI as the best predictor of behavior, we focus on behavioral intention (i.e., intention to use) as the key dependent variable in this research. Figure 1 presents the research model. TPB is displayed in Block 1.
Although we expect most propositions in TPB to be true, the relationship from SN to BI needs further elaboration in the current study. Evidence has shown that the influence of SN in BI attenuates after individuals start using ICT, as their attention shifts more toward outcome expectations (Karahanna et al. 1999). Given our focus on ICT usage after adoption, we expect this relationship to be insignificant. In addition, prior digital inequality research suggested that they tend to lack self-assurance, self-esteem, skills, opportunities, and necessary resources to use ICT. However, seldom is this the case for the privileged. It is thus reasonable to presume PBC to exert a stronger influence on BI for the underprivileged.
2
Image refers to the extent to which the adoption of innovation is perceived to enhance one’s status in one’s social system.
3
Although the Internet TV service is free, it requires the cable connection. Such connection requires at least the basic cable service ($8.70 per month). We investigated if the cost of cable TV was a financial barrier for the residents.
Decomposing TPB
Taylor and Todd (1995) and Venkatesh and Brown (2001) decomposed the three TPB belief constructs to reflect their multidimensionality. This decomposition can generate managerial information about specific factors that influence ICT usage and inform formulation of intervention initiatives. To provide useful information for policy-making, we decomposed the TPB belief constructs to reflect specific underlying factors based on a detailed literature review.
The Attitudinal Belief Structure (Block 2)
In their study of the adoption determinants of personal computers at home, Venkatesh and Brown decomposed attitudinal belief into utilitarian outcomes (UO), hedonic outcomes (HO), and social outcomes (SO). While UO approximates the concept of perceived usefulness, SO is similar to Rogers’ (1995) concept of image.2 Motivation theory suggests that both extrinsic and
intrinsic motivations are important in determining an individual’s behavioral attitude (Davis et al. 1992). Whereas UO and SO correspond to extrinsic motivation, HO parallels intrinsic motivation.
Recent digital inequality studies have suggested that the underprivileged, as compared to the privileged, tend to use ICT more for entertainment purpose (Bonfadelli 2002; DiMaggio et al. 2004; Shah et al. 2001). One plausible explanation is that the pleasure and satisfaction derived from using a technology is more important for the underprivileged than the privileged. It is, therefore, possible that hedonic outcomes have a stronger effect on attitude for the underprivileged.
Gaining social status has also been recognized as a major reason for individuals to accept new innovations (Rogers 1995, Venkatesh and Brown 2001). Nevertheless, Rogers argued that social status is not a priority in the underprivileged group. For this reason, SO’s impact on attitude may be lower for the underprivileged than the privileged.
The Normative Belief Structure (Block 3)
Family and friends are suggested to be important groups that influence individuals’ behavioral intention at home (Venkatesh and Brown 2001). To further capture influence from one’s social network, we included relatives and peers as referent others. In addition, researchers have noted the importance of investigating institutional effects on digital inequality (DiMaggio et al. 2001). In the LaGrange free Internet TV initiative, the city government played an important role in promoting and encouraging residents to use the Internet TV (Keil et al. 2003).
The Behavioral Control Belief Structure (Block 4)
Behavioral control belief is decomposed into internal and external control. Internal control refers to the personal characteristics that influence volitional control. Prior studies have suggested that self-efficacy (SE) (Taylor and Todd 1995), requisite knowledge (ReqKnow), and perceived ease of use (PEOU) (Ajzen 1991; Mathieson 1991; Venkatesh and Brown. 2001) are important internal control factors. However, with the provision of user-friendly ICT, the difficulty in using ICT shall not be a barrier for continued usage. After actual usage, adopters have more experience than before adoption. This direct experience also serves to increase their familiarity with the technology, thus minimizing the effect of PEOU. We thus expect PEOU to have no impact on PBC for the adopters.
External control refers to the facilitating factors that are external to the individual (Ajzen 1991). Prior digital inequality studies have indicated that cost3 (Venkatesh and Brown 2001), time (Lenhart 2002), and accessibility (Lenhart 2002) are barriers that
prevent people, especially the underprivileged, from successfully using ICT. However, given that most digital inequality intervention focuses on providing economic resources, particularly the LaGrange free Internet initiative, cost should be of no concern for adopters.
4
Non-adopters were also studied and the results will be presented in other manuscripts.
In addition, lack of time is an important barrier for performing behavior (Ajzen and Madden 1986). Evidence in digital inequality studies suggested that lack of time is a reason for ICT nonuse (Lenhart 2002). Nevertheless, no significant evidence has so far indicated that those who already used the Internet perceive time as a barrier for continued usage. ICTs are mostly designed to enhance people’s productivity and efficiency, including saving time. Adopters may sense or experience such advantage and are thus not as likely to see lack of time as an obstacle. Instead, the less time one has, the more likely one will use ICT. Therefore, for both privileged and underprivileged adopters, time may have no behavioral impact.
Finally, accessibility concerns the resource competition and logistics issues involved in ICT usage. A possessed technology may not be available when needed because others are using it or it is logistically inconvenient to use it (Kvasny 2002; Rogers 1995). Such a situation tends to occur at the implementation stage (Rogers 1995). As the underprivileged have less resources in control, this type of barrier may have a more significant impact on them.
Exposure to Innovation
In the context of diffusion of innovation, DiMaggio and Powell (1983) proposed the concept of mimetic pressure to represent the effect of the cumulative percentage of adopters in shaping a subject’s innovation behavior. A similar conceptualization is offered at the individual level by Valente (1995), who suggested that exposure to innovation through the cumulative proportion of adopters in one’s personal network influences individual adoption behavior. Although subjective norms in TPB represent social influence, it does not capture this aggregate mimetic pressure. Subjective norms focus solely on the expectation from important others, while exposure to innovation accounts for the observed aggregate behavior signals in the overall social network. Therefore, this concept is conceptually distinct from subjective norms. The larger the proportion of adopters in an individual’s personal network, the more likely the individual will mimic others’ behavior (Valente 1995). The direct path from exposure to innovation to behavioral intention represents this mechanism.
In addition, Valente and Rogers have found that late adopters might be less responsive to such pressure and thus take a longer time, if ever, to adopt an innovation. Thus, mimetic pressure may have a differential effect between early and later adopters. Meanwhile, Rogers indicated that early adopters, as compared to late adopters, tend to have higher income, education attainment, and social status. Such profile is similar to the profile of the privileged along digital inequality. Therefore, we expect exposure to innovation will influence BI less strongly for underprivileged non-adopters than adopters.
Control Variable
Many Internet TV adopters may also possess an Internet PC at home. Since the ownership of an Internet PC may reduce Internet TV usage, it is specified as a control variable.
Research Method
A survey instrument was developed to collect the quantitative data needed for model and hypothesis testing. For most constructs in the research model, Likert scale items were adapted from existing scales. No prior measures were found for the three external control constructs: cost, time, and accessibility. Extant literature and archival data informed the development of their measures. The survey instrument was pretested with 20 subjects from LaGrange and minor modifications were made prior to its full-scale administration.
In summer 2003, the survey instrument was administered to all LaGrange households of record who had adopted the digital set-top boxes needed to use the Internet TV.4 According to the city’s records, this included approximately 3,500 households, or roughly
40 percent of the approximately 9,000 eligible households. The survey was mailed to each adopter’s household, with two waves of reminder postcards mailed 1 week and 3 weeks after the initial survey.
5
With the exception of cost and exposure to innovation, all other constructs are operationalized as multiple-item constructs.
6
We applied the same bootstrapping approach in all of the analyses, including CFA, structural model testing, multigroup measurement invariance analysis, and multigroup path and mean comparison.
Among the adopters, we received 451 usable surveys. To investigate possible nonresponse bias, we followed the general procedure used by Ravichandran and Rai (2000). Follow-up phone interviews with 233 nonrespondents revealed no evidence of systematic nonresponse bias with issues in the survey.
Prior studies have identified that digital inequality is associated with different demographic factors, such as income, education, age, gender, race, and geographic location (Kvasny 2002; Lenhart 2002). Among these, income and education have been suggested as the best demographic predictors of ICT non-adoption (Lenhart 2002). We, therefore, employed these variables, each of which is measured on a continuous scale, to classify subjects as privileged or underprivileged. Ward’s method of hierarchical cluster analysis was applied to these variables to extract two groups (Hair et al. 1998). The procedure classified 307 subjects into the privileged group and 144 subjects into the underprivileged group.
Data Analysis and Results
Measurement Model
To verify construct validity, using AMOS 5.0, multiple item constructs5 were subjected to confirmatory factor analysis (CFA)
for both groups. Given the model complexity and available sample size, a bootstrapping simulation6 was adopted to ensure
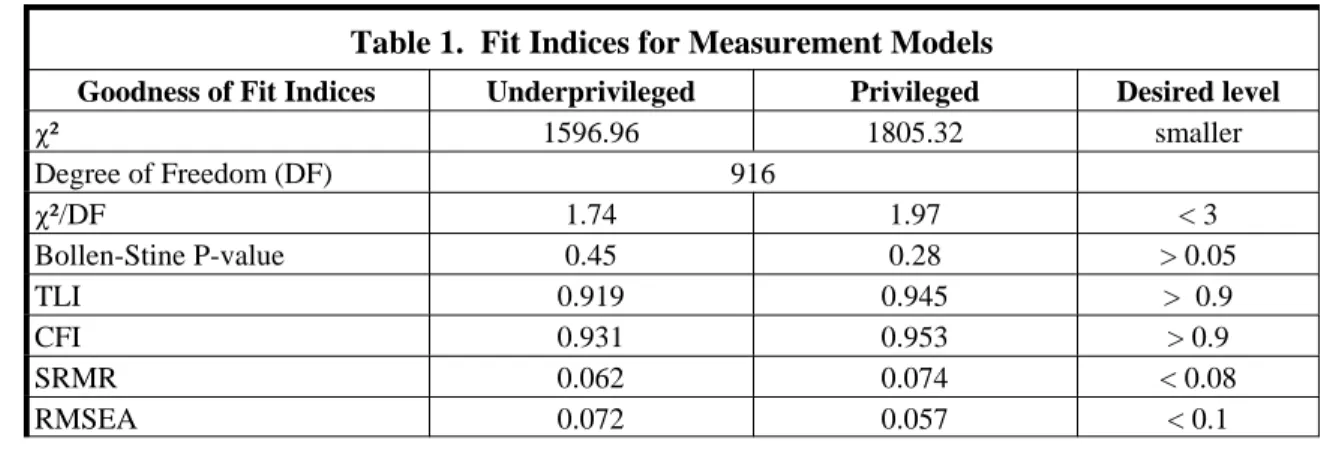
reliability of results (Agarwal and Prasad 1999; Stine 1989). Two thousand sets of samples were randomly generated with sample sizes set equal to the original sample sizes (307 and 144) and then tested against the measurement model. Two items were dropped because of low loading or high shared residual variance with other items. The resulting CFAs (Table 1) show good fit for both underprivileged and privileged groups.
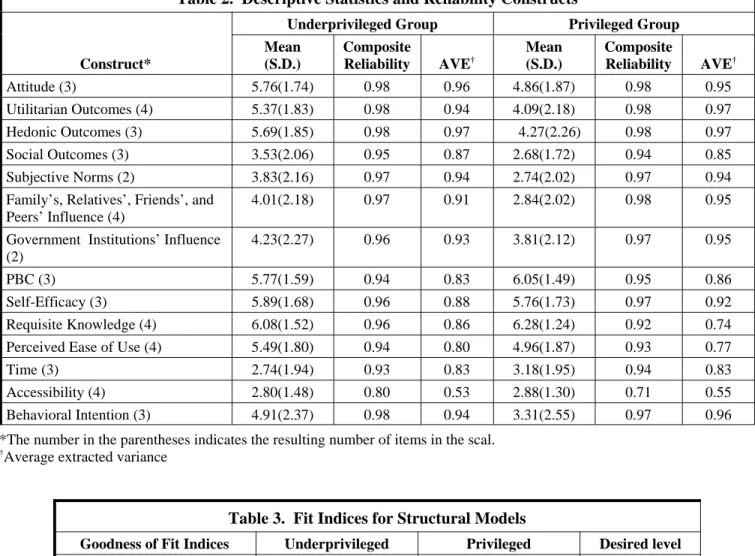
Table 2 presents the descriptive statistics, composite reliability, and average variance extracted of the constructs. Next, discriminant validity was assessed by examining if the squared correlation between a pair of latent variables was less than the average variance-extracted estimate of each variable. The results indicate good discriminant validity.
Structural Model
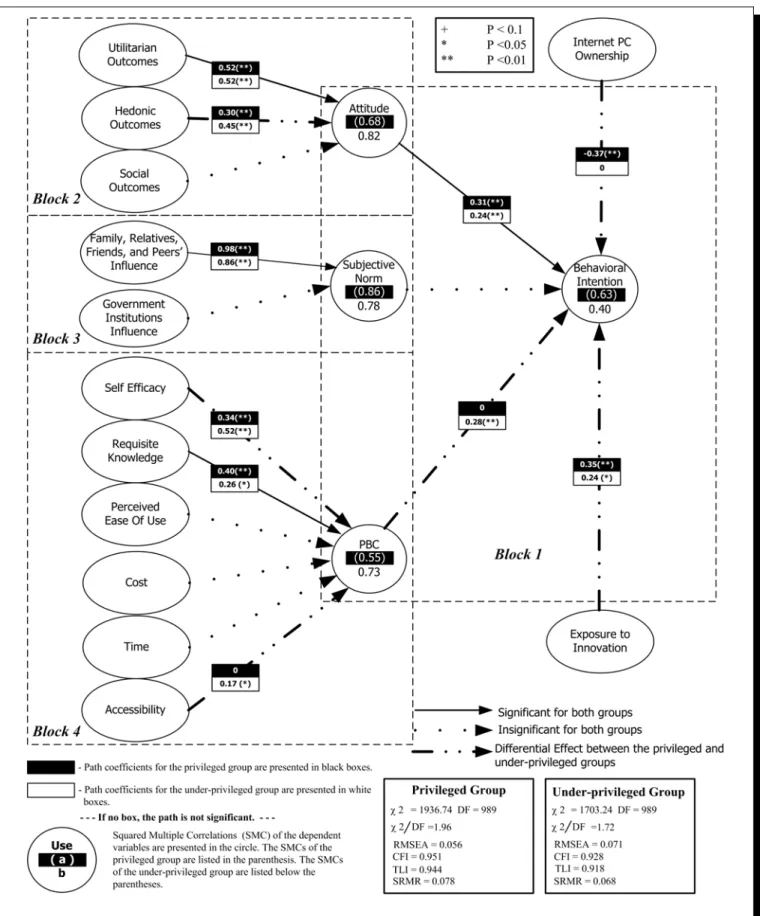
The structural model was independently tested against each group, suggesting good model fit (see Table 3). Figure 2 presents the structural models for the underprivileged and privileged adopters.
Table 1. Fit Indices for Measurement Models
Goodness of Fit Indices Underprivileged Privileged Desired level
P² 1596.96 1805.32 smaller Degree of Freedom (DF) 916 P²/DF 1.74 1.97 < 3 Bollen-Stine P-value 0.45 0.28 > 0.05 TLI 0.919 0.945 > 0.9 CFI 0.931 0.953 > 0.9 SRMR 0.062 0.074 < 0.08 RMSEA 0.072 0.057 < 0.1
Table 2. Descriptive Statistics and Reliability Constructs
Construct*
Underprivileged Group Privileged Group Mean (S.D.) Composite Reliability AVE† Mean (S.D.) Composite Reliability AVE† Attitude (3) 5.76(1.74) 0.98 0.96 4.86(1.87) 0.98 0.95 Utilitarian Outcomes (4) 5.37(1.83) 0.98 0.94 4.09(2.18) 0.98 0.97 Hedonic Outcomes (3) 5.69(1.85) 0.98 0.97 4.27(2.26) 0.98 0.97 Social Outcomes (3) 3.53(2.06) 0.95 0.87 2.68(1.72) 0.94 0.85 Subjective Norms (2) 3.83(2.16) 0.97 0.94 2.74(2.02) 0.97 0.94 Family’s, Relatives’, Friends’, and
Peers’ Influence (4)
4.01(2.18) 0.97 0.91 2.84(2.02) 0.98 0.95
Government Institutions’ Influence (2)
4.23(2.27) 0.96 0.93 3.81(2.12) 0.97 0.95
PBC (3) 5.77(1.59) 0.94 0.83 6.05(1.49) 0.95 0.86 Self-Efficacy (3) 5.89(1.68) 0.96 0.88 5.76(1.73) 0.97 0.92 Requisite Knowledge (4) 6.08(1.52) 0.96 0.86 6.28(1.24) 0.92 0.74 Perceived Ease of Use (4) 5.49(1.80) 0.94 0.80 4.96(1.87) 0.93 0.77 Time (3) 2.74(1.94) 0.93 0.83 3.18(1.95) 0.94 0.83 Accessibility (4) 2.80(1.48) 0.80 0.53 2.88(1.30) 0.71 0.55 Behavioral Intention (3) 4.91(2.37) 0.98 0.94 3.31(2.55) 0.97 0.96 *The number in the parentheses indicates the resulting number of items in the scal.
†Average extracted variance
Table 3. Fit Indices for Structural Models
Goodness of Fit Indices Underprivileged Privileged Desired level
P² 1703.25 1936.74 smaller Degree of Freedom (DF) 989 P²/DF 1.72 1.96 < 3 Bollen-Stine P-value 0.42 0.25 > 0.05 TLI 0.918 0.944 > 0.9 CFI 0.928 0.951 > 0.9 SRMR 0.068 0.078 < 0.08 RMSEA 0.071 0.056 < 0.1
7When modeling configural invariance, no restrictions are enforced on metrics across groups (Doll et al. 1998).
8
When assessing metric invariance, the latent construct loadings are constrained to be equal across groups.
9Scalar invariance can be evaluated by constraining the intercepts of measures to be the same across groups.
10Target coefficient is defined as (N-I)/(N-U). N: P² of the independent model. I: P² of the model with invariance constraint. U: P² configural
invariant model.
Multigroup Analysis for Differences Across Priviliged and Underpriviliged Groups
To make the comparison across two groups meaningful and to generate valid conclusions, it is first essential to establish measurement invariance across groups (Doll et al. 1998; MacKenzie and Spreng 1992; Marsh 1987). This requires an assessment of configural invariance, metric invariance, and scalar invariance. Configural invariance means that the patterns of item loadings are the same, or congeneric, across groups, but loadings are not necessarily the same7 (MacKenzie and Spreng 1992). Establishing
configural invariance suggests that the constructs can be conceptualized in the same way across groups and one can proceed to assess metric invariance. Metric invariance concerns whether the measures have equivalent loadings on the latent constructs across groups.8 Scalar invariance assessment follows establishment of metric invariance, and is concerned with consistency
between cross-group differences in latent construct means and the cross-group differences in observed means.9
Since these three invariance models are nested, the difference between two nested models can be assessed through a P² test. As
P² is sensitive to sample size, Doll et al. (1998) suggest evaluating changes in CFI, TLI, and target coefficient10 (Marsh 1987).
Table 4 presents the results of the measurement invariance assessment. Although the P² tests were statistically significant, RMSEA, CFI, TLI, and target coefficient for the three models collectively suggest measurement invariance between the two groups. Comparisons of path coefficients and latent construct means are thus meaningful.
Next, the individual structural paths were tested by comparing the path coefficients between the two groups (MacKenzie and Spreng 1992). Each corresponding pair of path coefficients were constrained to be equal across groups, one pair at a time, and the change in P² was tested for significance at one degree of freedom. If the test shows significance, this suggests that the paths in the two groups are different. The direction of the differences (> or <) can be evaluated by comparing the estimated coefficients from the two groups (MacKenzie and Spreng 1992). Six pairs of paths were found to be different across groups (Table 5).
Table 4. Multigroup Invariance Analysis
Model P² d.f. P RMSEA TLI CFI target coefficient
Configural Inv. 3641.88 1978 0.043 0.933 0.943 1.0000 Metric Inv. 3576.44 2009 .0000 0.044 0.935 0.940 0.9955 Scalar Inv. 3889.90 2057 .0000 0.045 0.937 0.937 0.9903
Table 5. Path Comparison
Path Underprivileged Privileged
Hedonic Outcomes
ö
Attitude 0.45** > 0.31 ** Self-Efficacyö
PBC 0.52** > 0.34 ** Accessibilityö
PBC 0.17** > Not Significant PBCö
BI 0.28** > Not Significant Exposure to Innovationö
BI 0.24* <† 0.35 **Internet PC Ownership
ö
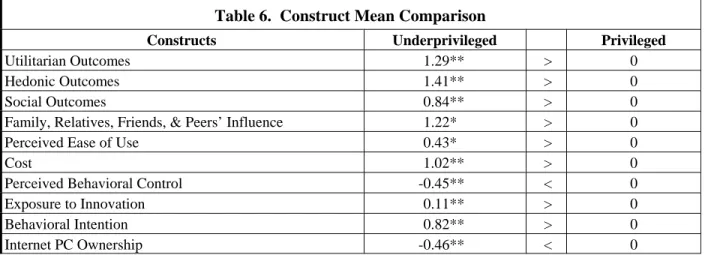
BI Not Significant > -0.37 ** The path coefficient is significant at **p < 0.01, *p < 0.05. †This pair of paths is marginally different (p < 0.1).Table 6. Construct Mean Comparison
Constructs Underprivileged Privileged
Utilitarian Outcomes 1.29** > 0
Hedonic Outcomes 1.41** > 0
Social Outcomes 0.84** > 0
Family, Relatives, Friends, & Peers’ Influence 1.22* > 0
Perceived Ease of Use 0.43* > 0
Cost 1.02** > 0
Perceived Behavioral Control -0.45** < 0 Exposure to Innovation 0.11** > 0
Behavioral Intention 0.82** > 0
Internet PC Ownership -0.46** < 0 Significant at **p < 0.01, *p < 0.05
Under scalar invariance, construct means were compared by constraining the construct means as zero for the privileged and allowing construct means of the underprivileged to be freely estimated. If an estimated construct mean of the underprivileged is significantly different from zero, this pair of construct means is different across groups (MacKenzie and Spreng 1992). Table 6 lists constructs that differ in latent means across groups. Ten factors show significant differences presented between two groups.
Discussion
We organize our discussion around the basic components of our model, focusing first on behavioral intention, then attitudes, social influence, and behavioral control.
Behavioral Intention
The results strongly suggest that people from underprivileged and privileged groups behave differently in their intention to continue using the Internet TV. As shown in Table 5, the underprivileged showed higher behavioral intention. Borrowing the notion of relative advantage from Rogers’ theory of diffusion of innovation (1995), the value of an ICT is judged in relation to other alternatives at individuals’ disposal. Given the much higher Internet PC ownership (Table 6), the privileged group may not depend on the Internet TV as much as the underprivileged group.
Attitudinal Belief
As shown in Table 6, the underprivileged exhibited more favorable outcome expectations (i.e., utilitarian, hedonic, and social) for using the Internet TV. However, for both groups, utilitarian (extrinsic) and hedonic (intrinsic) outcomes influenced attitude, while social outcomes did not. This result is in accordance with motivation theory that both extrinsic and intrinsic outcomes are important in determining behavioral attitude. Furthermore, consistent with our expectation, the path comparison (Table 5) revealed that hedonic outcomes (i.e., enjoyment) was more powerful in affecting attitude for the underprivileged than the privileged. This difference suggests that, for the underprivileged, highlighting the enjoyment in ICT usage may be a useful lever for cultivating a more positive attitude toward using the technology.
Social Influence (Subjective Norms and Exposure to Innovation)
As shown in Figure 2, expectation from the individual’s social network, including family, relatives, friends, and peers was influential in shaping subjective norms, while government influence was not found to be significant. Subjective norms, as expected, was not influential in shaping behavioral Intention. This supports the idea that the influence of subjective norms on behavioral intention attenuates after individuals start using ICT, as people’s attention shifts more toward outcome expectations
(Karahanna et al. 1999). Our results suggest that the social network still affects post-adoption behavior, but through a mimetic mechanism. As discussed earlier, while SN concerns the expectation from “important” referents, exposure to innovation focuses on “observing” the aggregate manifest behavior across the overall social network. The exposure to innovation, or the cumulative proportion of adopters in one’s social network, does significantly influence one’s behavioral intention even after adoption (see Figure 2). Therefore, to encourage continual ICT usage after adoption, it is important to design initiatives that effectively communicate aggregate patterns of ICT usage.
In line with our anticipation, the path comparison for the two groups (Table 5) reveals that exposure to innovation has a stronger influence on BI for the privileged. This suggests that the privileged group is more sensitive to responding to such mimetic pressure than the underprivileged group. This behavioral difference is in harmony with findings in the diffusion literature that the less educated and less wealthy are generally the last to adopt innovations (Roger 1995).
Behavioral Control
The path comparison (Table 5) reveals that perceived behavioral control was crucial in determining behavioral intention for the underprivileged group, but not for the privileged group. As discussed earlier, this may be because the underprivileged group has lower volitional control, even though the technology is free and cost appears not to be an important factor.
Internal Control
Extant literature has systematically suggested self-efficacy as one of the most important internal control factors. As shown in Figure 2, efficacy and requisite knowledge are influential for both groups in terms of shaping PBC. Interestingly, self-efficacy had a stronger influence on PBC for the underprivileged group (Table 5). Presumably, psychological confidence in using ICT is more influential for this group in shaping their behavioral control belief. According to Bandura (1977), repeated experience, observing others’ successful practice, verbal persuasion, and good physical condition can increase one’s self-efficacy. Designing interventions that boost this group’s confidence in using ICT should beneficially enhance their behavioral control. Perceived ease of use, as expected, was not found to be a significant determinant of behavioral control. The user-friendly design of the Internet TV might have helped the underprivileged overcome initial technical barriers. In fact, the underprivileged even demonstrate higher PEOU (Table 6).
External Control
Although cost perception was higher for the underprivileged as shown in Table 6, it was not a significant barrier in terms of PBC (Figure 2). This suggests that the “free” policy eliminated the economic barrier. However, ICT accessibility still posed a barrier even post-adoption for underprivileged adopters (Figure 2). Potential conflict between household members who want to watch TV and those who want to use the Internet TV could create accessibility issues since the device might not be accessible when needed. Such access-related issues are likely to be hard to resolve given the nature of the technology used in this particular case. The Internet TV serves as a good introductory technology for people with low knowledge and skill level. However, if users learn skills and expect to advance to sophisticated operations, they may have to move up to typical computers. According to our data, about 16 percent of the Internet TV adopters converted to Internet PC because of the Internet TV experience. This upgrade implies costs for hardware, software, and monthly charges for Internet connection. These costs might again raise the economic hurdle for members in the underprivileged group.
Limitations and Future Research
The decomposed TPB approach permits the investigation of the sophisticated attitudinal, social, and behavioral aspects of digital inequality and is especially instrumental for identifying leverage points. However, TPB assumes that human beings are rational information processors and thus it does not explicitly address the unconscious or nonrational aspects of adoption behavior. Researchers have suggested that innovation behavior can be both planned and spontaneous (e.g., DiMaggio and Powell 1983; Triandis, 1980). To study the impact of the spontaneous, or unintentional, aspect of ICT adoption behavior on digital inequality, directions for future research may include extending intention-based adoption theories by adding factors such as habits that focus
on spontaneous behavior (Limayem and Hirt 2003). This will also enhance our knowledge of how rational behavioral models can be elaborated by integrating factors that shape unintentional behavior.
Meanwhile, the theoretical approach employed is limited in its ability to study the social-structural issues embedded in digital inequality. However, given our focus on the individual instead of social structure, TPB was a reasonable choice. Future research may apply grand social theories from theorists like Giddens, Foucault, Latour, or Bourdieu to investigate the social-structural aspect of the DI phenomenon.
While digital inequality exists across different socio-demographic dimensions, we focused on income and education as key distinctions between privileged and underprivileged groups. Future research may also look into other groups, such as the disabled or racial minorities, to investigate unique barriers and facilitators of ICT usage, so that interventions can be tailored.
Finally, this study represents a snapshot of the digital inequality phenomenon. A longitudinal study tracing the ICT adoption and usage patterns of subjects will yield understanding about additional behavioral patterns, barriers, and the phenomenon.
Theoretical Contributions and Implications
For digital inequality researchers, this study stands for an important step toward understanding the problem of digital inequality using a theoretically grounded approach based on the theory of planned behavior. It demonstrates that a TPB-based model can explain a significant amount of variance in household ICT innovation decisions for both privileged and underprivileged groups. More importantly, several between-group behavioral differences were deduced a priori and empirically observed. Thus, from the standpoint of digital inequality research, this study constitutes an important contribution to the theoretical development of the phenomenon. The observed between-group differences warrant further examination as they represent promising avenues for insight into differential behavioral patterns and their causes.
For the adoption of innovation literature, this study has shown that TPB can be extended through the addition of exposure to innovation that captures the behavioral consequences of aggregate mimetic influence. As Legris et al. (2003) noted, although current IS adoption theories are useful, incorporating additional critical factors might be necessary to improve their explanatory power.
Implications for Practice
For practitioners, particularly public policy makers and Internet service providers, this research is significant because it goes beyond the usual descriptive approach and provides insights using a theoretically grounded model. Understanding what variables affect ICT use across groups is critical to effectively formulate and implement policy interventions like the free Internet TV initiative in LaGrange. This type of project involves considerable resources from many stakeholders. Unsuccessful projects might signal a waste of valuable resources, which could deter the government;s and residents’ willingness to adopt and use other innovations in the future. Based on the analysis, we believe that providing access to easy-to-use ICT alone—even at no cost—is only part of the solution. The analysis presented here pinpoints other key factors that that can affect ICT use intention, and ultimately ICT use itself. Understanding these factors and the ones particularly important for the underprivileged provide points of leverage for policy makers and service providers who wish to address the problem of digital inequality and spur high-speed Internet adoption and use in households.
To devise effective intervention, policy-makers need to incorporate these additional factors as a whole. While utilitarian outcomes is an important determinant for both groups, highlighting the intrinsic value and boosting confidence in using ICT can provide effective results with the underprivileged. Fostering an environment with high exposure to aggregate patterns of ICT usage can encourage continual ICT usage.
Finally, instead of generic interventions, the findings suggest a “smart strategy” concept that interventions should take a segmentation approach to fit the unique needs of people with different backgrounds. Potentially, policy makers may also adopt a stepwise strategy to address different needs of people at distinct innovation stages, although more comparative studies are necessary. While many questions remain unanswered, this study represents an important step in furthering our understanding of the digital inequality problem and the possible solutions that exist for dealing with it.
References
Agarwal, R., and Prasad, J. “Are Individual Differences Germane to the Acceptance of New Information Technologies?,”
Decision Sciences (30:2), 1999, pp. 361-391.
Ajzen, I. “The Theory of Planned Behavior,” Organizational Behavior and Human Decision Processes (50:2), 1991, pp. 179-211. Ajzen, I., and Madden, T. J. “Prediction of Goal-directed Behavior,” Journal of Experimental Social Psychology (22:5), 1986,
pp. 453-474.
Bandura, A. “Self-Efficacy: Toward a Unifying Theory of Behavioral Change,” Psychological Review (84:2), 1977, pp. 191-215. Bonfadelli, H. “The Internet and Knowledge Gaps: A Theoretical and Empirical Investigation,” European Journal of
Communication (17:1), 2002, pp. 65-84.
Davis, F. D. “Perceived Usefulness, Perceived Ease of Use and User Acceptance of Information Technology,” MIS Quarterly
(13:3), 1989, pp. 319-340.
Davis, F. D., Bagozzi, R. P., and Warshaw, P. R. “Extrinsic and Intrinsic Motivation to Use Computers in the Workplace,”
Journal of Applied Social Psychology (22:14), 1992, pp. 1111-1132.
DiMaggio, P., E. Hargittai, C. Celeste, and Shafer, S. “From Unequal Access to Differentiated Use: A Literature Review and Agenda for Research on Digital Inequality,” in Social Inequality, K. Neckerman (Ed. ), Russell Sage Foundation, New York, 2004, pp. 355-400.
DiMaggio, P., Hargittai, E., Neuman, W. R., and Robinson, J. P. “Social Implication of the Internet,” Annual Review of Sociology
(27:1), 2001, pp. 307-336.
DiMaggio, P. J., and Powell, W. W. “The Iron Cage Revisited: Institutional Isomorphism and Collective Rationality in Organizational Fields,” American Sociological Review (48:2), 1983, pp. 147-160.
Doll, W. J., Hendrickson, A., and Deng, X. “Using Davis’s Perceived Usefulness and Ease-of-Use Instruments for Decision Making: A Confirmatory and Multigroup Invariance Analysis,” Decision Sciences (29:4), 1998, pp. 839-869.
Dow Jones Newswires. “Bush Sees Broadband Access as a U.S. Goal,” The Wall Street Journal, March 29, 2004, p. A4. Dreazen, Y. J. “What’s Slowing Us Down?,” The Wall Street Journal, October 13, 2003, p. R4.
Fishbein, M., and Ajzen, I. Belief, Attitude, Intention, and Behavior: An Introduction to Theory and Research, Addison-Wesley Publishing Company, Reading, MA, 1975.
Hair, J. F., Anderson, R. E., Tatham, R., and Black, W. C. Multivariate Data Analysis with Readings, (5th ed. ) Macmillan, New York, 1998.
Hoffman, D. L., Novak, T. P., and Schlosser, A. E. “The Evolution of the Digital Divide: Examining the Relationship of Race to Internet Access and Usage over Time,” in The Digital Divide: Facing a Crisis or Creating a Myth?, B. M. Compaine (Ed.), MIT Press, Massachusetts, MA, 2001, pp. 47-97.
Karahanna, E., Straub, D. W., and Chervany, N. L. “Information Technology Adoption Across Time: A Cross-Sectional Comparison of Pre-Adoption and Post-Adoption Beliefs,” MIS Quarterly (23:2), 1999, pp. 183-213.
Keil, M., Meader, G. W., and Kvasny, L. “Bridging the Digital Divide: The Story of the Free Internet Initiative in LaGrange, Georgia,” in Proceedings of the 36th Annual Hawaii International Conference on Systems Sciences, R. H. Sprague (Ed.), Big
Island, Hawaii, January 6-9, 2003, pp. 1-10.
Kvasny, L. Problematizing the Digital Divide: Cultural and Social Reproduction in a Community Technology Initiative, Unpublished Ph. D. Dissertation, Georgia State University, Atlanta, GA, 2002.
Legris, P., Ingham, J., and Collerette, P. “Why Do People Use Information Technology? A Critical Review of the Technology Acceptance Model,” Information & Management (40:3), 2003, pp. 191-204.
Lenhart, A. “Barriers to Internet Access: From the Non-User and New User Perspective,” in Proceedings of the Association of Internet Researchers Conference 3.0, Maastricht, Netherlands, October 14-16 2002, pp. 1-27 (available online at
http://www.aoir.org/?q=taxonomy/term/10&from=50).
Limayem, M., and Hirt, S. G. “Force of Habit and Information Systems Usage: Theory and Initial Validation,” Journal of the Association for Information Systems (4), 2003, pp. 65-97.
MacKenzie, S. B., and Spreng, R. A. “How Does Motivation Moderate the Impact of Central and Peripheral Processing on Brand Attitude and Intentions?,” Journal of Consumer Research (18:4), 1992, pp. 519-529.
Marsh, H. W. “The Factorial Invariance of Responses by Males and Females to a Multidimensional Self-Concept Instrument: Substantive and Methodological Issues,” Multivariate Behavioral Research (22:4), 1987, pp. 457-480.
Mathieson, K. “Predicting User Intentions: Comparing the Technology Acceptance Model with the Theory of Planned Behavior,” Information Systems Research (2:3), 1991, pp. 173-191.
Ravichandran, T., and Rai, A. “Quality Management in System Development: An Organizational System Perspective,” MIS Quarterly (24:3), 2000, pp. 381-415
Shah, D. V., Kwak, T., and Holbert. R. L. “Connecting and Disconnecting with Civic Life: Patterns of Internet Use and the Production of Social Capital,” Political Communication (18), 2001, pp. 141-162.
Stine, R. “An Introduction to Bootstrap Methods: Examples and Ideas,” Sociological Methods and Research (8), 1989, pp. 243-291.
Taylor, S., and Todd, P. A. “Understanding Information Technology Usage: A Test of Competing Models,” Information Systems Research (6:2), 1995, pp. 144-176.
Triandis, H. C. “Values, Attitudes, and Interpersonal Behavior,” in Nebraska Symposium on Motivation (27), H. Howe and M. Page (Eds.), University of Nebraska Press, Lincoln, NE, 1980, pp. 195-259.
United States Advisory Council on the National Information Infrastructure. “A Nation of Opportunity,” 1996 (available online
at http://www.ed.psu.edu/INSYS/ESD/tech/Highway/nation.home.html; accessed October 22, 2004).
Valente, T. Network Models of the Diffusion of Innovations, Hampton Press, New York, 1995.
Venkatesh, V., and Brown, S. A. “A Longitudinal Investigation of Personal Computers in Homes: Adoption Determinants and Emerging Challenges,” MIS Quarterly (25:1), 2001, pp. 71-102.