New pedotransfer function (“CRC”) for the prediction of unsaturated soil hydraulic
conductivity using soil water retention data
Klaus Bohne1, Manfred Renger2, and Gerd Wessolek3*
1Universität Rostock, Institute of Soil Science, Justus-von-Liebig-Weg 6, 18051 Rostock, Germany 2Technische Universität Berlin, Institute of Ecology, Ernst-Reuter-Platz 1. 10587 Berlin, Germany
3Institut für Ökologie, Technische Universität Berlin, Ernst-Reuter-Platz 1, 10587, Germany
Received November 28, 2018; accepted October 9, 2019
*Corresponding author e-mail: gerd.wessolek@tu-berlin.de A b s t r a c t. Several review articles have emphasized, that a comprehensive set of pedotransfer functions may be applied throughout a wide range of disciplines of Earth system scienc-es and are of great importance for land surface models. Most pedotransfer functions deducing soil hydraulic data from non-hydraulic soil data such as soil texture and bulk density, yield soil water retention predictions, but do not provide information concerning soil hydraulic conductivity. For this reason, a simple method was developed to estimate soil hydraulic conductivity using soil water retention information. Empirical equations are established to predict soil hydraulic conductivity from soil water retention information. These equations are relatively straight-forward and do not require the fitting of nonlinear functions. Predictions of soil hydraulic conductivity using 106 soil samples indicates the reliable performance of the new method. The predic-tion quality of the new method was estimated from the calibrapredic-tion data set, which produced equivalent results to the Zacharias and Wessolek pedotransfer function, which were even better than the predictions obtained from the original Mualem-van Genuchten model, the Soto fractal model, and the pedotransfer function reported by Weynants and Vereecken. The stochastic structure of the calibration data reflects the presence of important soil structur-al properties, which are not represented by the soil water retention characteristics.
K e y w o r d s: soil texture, hydraulic conductivity, transfer function, soil water retention
INTRODUCTION
Pedotransfer functions (PTF) are widely used to esti-mate soil hydraulic properties from soil texture and other basic soil properties. A comprehensive overview conducted
by Minasny et al. (2017) has shown, that most of the PTFs
being used in vadose zone research predict the soil water retention characteristics (WRC) from textural data. In a se-
cond step, some models can be used to estimate the soil hydraulic conductivity function from calculated soil water retention data. This procedure is often combined into an integrated approach (van Genuchten, 1980). Since hydrau-lic conductivity depends on both pore geometry and soil water content, there is an error propagation from water retention to hydraulic conductivity estimation yielding more or less large prediction errors.
Weynants et al. (2008), analysed 136 soil data sets
obtained by steady-state downward flux and evaporation
methods and predicted soil hydraulic conductivity (K) with
a root mean square error of RMSE = 0.318 log10(K) when
using the Mualem-van Genuchten (MvG) relationship and an RMSE = 0.306 in the case of the Mualem-Ippisch model. These values hold for the prediction of hydraulic conduc-tivity from soil water retention data. The PTF developed
with their data set yielded an RMSE = 0.46. The results
obtained by two different PTFs including the ROSETTA software yielded far worse results. Puhlmann and Wilpert (2012) performed 795 multistep-outflow experiments on
100 cm3 soil cores and generated a PTF yielding an RMSE
of between 0.6 and about 1.5 log (K) for the calibration data
set. This was somewhat better than the results of Wösten et
al. (1999) obtained with his validation data set. With regard
to the usage of concepts in land surface models, the RMSE
values mentioned are not very satisfactory.
This contribution presents a new method to predict the hydraulic conductivity at specified values of the pore water
pressure head, i.e. it directly links soil water retention and
model from non-hydraulic soil properties. Instead, it uses a few measured nodes of the water retention function to directly calculate the hydraulic conductivity at these points. Please note that the method requires measured water con-tent data instead of textural data. However, we did not validate the method with a second data set. For compari-son, two continuous models of soil water retention and two known pedotransfer functions were applied to the same data set. These are:
– the van Genuchten (1980) function fitted to water retention data followed by the Mualem evaluation of unsat-urated conductivity at selected suction head points;
– a newly proposed fractal-based model (Soto et al.,
2017) which provides predictions of hydraulic conductivity based upon water retention data;
– the pedotransfer functions after (i) Vereecken
(Weynants et al., 2008) and (ii) after Zacharias and
Wessolek (2007), which both predict the parameters of the van Genuchten/ Mualem model from non-hydraulic soil data.
The database used consists of 106 mineral soils from Germany and Austria with measured water retention and hydraulic conductivity data (Fig. 1). The data set has
already been used in a previous study (Renger et al., 1999,
2014). Although the data originate from different sources
(Feichtinger, 1990, Wendroth and Nielsen, 1995, Renger et
al., 1999), for water retention, vacuum and pressure plate
equipment were used, while hydraulic conductivity was measured by different versions of the evaporation method (Peters and Durner, 2008). The size of the soil cores
var-ied between 100 and 250 cm3. Since the database contained
only a few complete data sets of clay soils, this texture group was excluded from the evaluation.
METHODS
An earlier version of the CRC method was described
by Renger et al. (1999, 2014). It was an autocorrelation
procedure, which was subject to severe error propagation. The new version described here avoids this drawback and yields stable parameters. In order to execute the method,
the soil water content at |h| = 0, 32, 63, 316 and 15850 hPa
have to be known. Then, soil hydraulic conductivity at
|h|= 32, 63, 100, 300 and 600 hPa may be calculated.
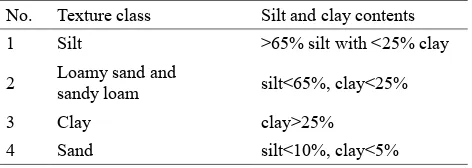
Firstly, the soil under consideration has to be assigned to one of the four texture classes listed in Table 1. In the sec-ond step, soil hydraulic csec-onductivity at a certain pressure
head hj may be calculated from water content differences
according to Eq. (1):
, (1)
j denotes one of the above mentioned pressure head values,
K is the hydraulic conductivity (cm/day), p is a parameter
explained below and di(i = 1...4) indicates the water content
difference (percent by volume) given by:
d1 = θ(0) - θ(32),
d2 = θ(32) - θ(63),
d3 = θ(63) - θ(316),
d4 = θ(316) - θ(15850). (1a)
Thus, the CRC method offers a novel way to predict unsaturated soil hydraulic conductivity directly from soil water content without fitting a continuous model.
Tests have been performed to check the quality of the
predicted ( ) vs. the measured hydraulic conductivity data
(yi) by the root mean square error (RMSE):
, (2)
by the coefficient of efficiency (COE, Legates and McCabe, 1999),
, (3)
and by the Willmott index WM (Willmott et al., 2012),
Fig. 1. Clay and silt content of the soil samples used. Due to
miss-ing values, soils with a clay content above 25% were excluded from the investigation of prediction errors.
Table 1. Definition of four texture groups, equivalent particle
diameters: clay: d < 0.002 mm, silt: 0.002 < d <0.06 mm
No. Texture class Silt and clay contents 1 Silt >65% silt with <25% clay
2 Loamy sand and sandy loam silt<65%, clay<25%
3 Clay clay>25%
4 Sand silt<10%, clay<5%
Silt (%)
. (4)
As yet, the results provide nothing more than the values of the soil hydraulic conductivity at five selected pressure head points. Since most applications require the param-eters of a continuous model, in a subsequent step the van Genuchten/Mualem model may be fitted simultaneously to the measured soil water content data and to the CRC-generated values of hydraulic conductivity.
The well known van Genuchten (1980) relationship is defined by:
, (5)
θ – volumetric water content, h – pressure head (assumed to
be positive) m = 1 - .
The figures θs, θr , α and n denote free parameters and
were fitted to the observed values of water content at |h|= 0, 32, 63, 316 and 15 850 hPa.
From S = (θ – θr)/(θs - θr),hydraulic conductivity K(S)
was calculated using Eq. (6):
, (6)
and
. (7)
The tortuosity parameter τwas set at 0.5, and K0 is a
param-eter which is commonly identified as the saturated hydraulic conductivity. Since the saturated hydraulic conductivity value was unknown, the observed hydraulic conductivity
Kmp at h = -63 hPa was chosen as a matching point, leading
to an apparent value of K0 given by:
, (8)
where: Kr represents the relative hydraulic conductivity and
Smp the saturation level at h = -63 hPa.
Several researchers recommend using a matching point
different from the saturation point. Vogel et al. (2001) has
shown that even a shift from zero to -2 cm can greatly improve hydraulic conductivity predictions. The research team used the measured value of hydraulic conductivity at -63 hPa as a matching point. Due to this necessary com-promise, the prediction quality may be judged based on the four remaining pressure head values only.
Recently, Soto et al. (2017) described a fractal-based
model of soil hydraulic functions.
Their water retention model is as follows:
for h > ha,
and θ(h) = 1 for 0 ≤ h ≤ ha. (9)
From the derivation of Eq. (9) it may be seen that λ has
a relationship with the fractal dimension D, which is given
by λ = 3 - D. The parameter ha represents the observed or
assumed bend of the water retention function indicating the air entry value and is given by:
. (10)
In this equation, Sr is given by Sr=θr / θs.
Soto et al. (2017) provided equations to calculate the
function of hydraulic conductivity on the basis of the Burdine and Mualem theories. For the Mualem method, they obtained the following:
, (11)
with . (12)
Thus, like the van Genuchten model, the fractal model has four fitting parameters. It is an advantage of this model that it is mathematically more easily accessible to the ana-lytical solutions of flow equations than the van Genuchten/ Mualem model. The Soto model originates from fractal considerations. Although we are presently not aware of a reliable method to deduce the parameters of the fractal model directly from grain size distribution, it is conceiv-able that a relationship between grain size distribution and its parameters may be found in the future. That would pro-duce new options for developing pedotransfer functions.
Weynants et al. (2008) used the database of Vereecken
(1988) containing the data of 220 soil horizons mainly orig-inating from Belgium to set up new pedotransfer functions which use textural data, bulk density and organic carbon content as input parameters. The functions not only provide the parameters of the van Genuchten function, but also the tortuosity coefficient and an apparent saturated hydraulic
conductivity K0 is also required to apply the Mualem
func-tion. K0 acts as a matching point at suction head h = 0but
it does not include the effect of macropores.
This PTF predicts the parameters of the van Genuchten water retention model from textural data and bulk density. Organic matter content was excluded from the calculations because they are often unavailable. The database used in this approach contained 676 soils mainly taken from two international databases. In order to predict hydraulic con-ductivity, the Mualem model (Eq. (3)) was used. To obtain
the missing parameters τ and K0, we followed the method
described above.
RESULTS
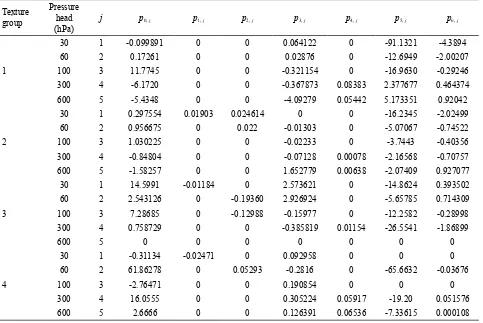
The parameters p1 through to p6 of Eq. (1) to be used
were estimated using the Levenberg-Marquardt method. The selection of the cause variables was performed itera-tively and indicates a satisfactory performance of the CRC method.
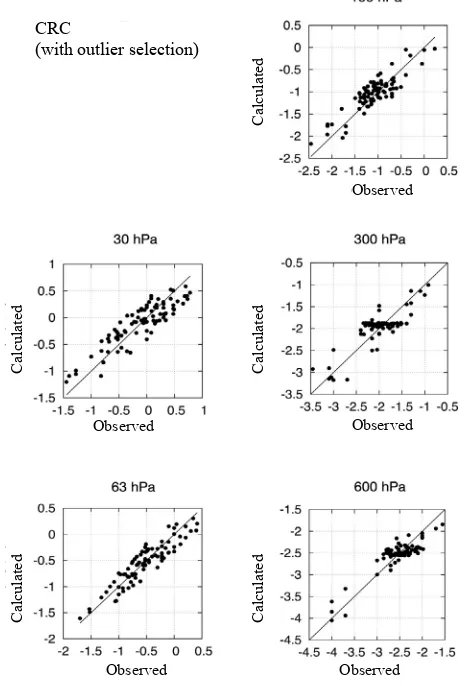
In Table 3, the RMSE values are subdivided into
dif-ferent classes of pressure head. Compared to the first three levels, the predictions for 300 and 600 hPa appear to be less reliable. Silty soils performed best and sandy soils worst. An overall view is given by Fig. 2.
Interestingly, the results depend to a large extent on the treatment of outliers. Without the elimination of outliers,
the average RMSE increases from 0.224 to 0.32 log10(K).
The use of confidence limits for α = 0.01 corresponding to a 1% error probability in the case of a normal distribution
reduces RMSE greatly. There is a possibility that outliers
are not only caused by random errors of measurement or by the bias of the model, but also by hidden soil properties. Without the elimination of outliers, the distribution of pre-diction errors shows a rapid increase at high score values. For this reason, the research team suspects that soil prop-erties, not taken into account by the predictive equations, indirectly divide the soil samples into different subgroups. These unknown soil properties may be the tortuosity and the connectivity of the soil pore system or the presence of the bimodal shape of the water retention function. In this regard, no such information was available. The inclusion of bulk density or porosity into our predictions did not lead to substantial improvements. In practice, properties which
Table 2. Parameters of Eq. (1)
Texture group
Pressure head
(hPa) j p0, j p1, j p2, j p3, j p4, j p5, j p6, j
1
30 1 -0.099891 0 0 0.064122 0 -91.1321 -4.3894
60 2 0.17261 0 0 0.02876 0 -12.6949 -2.00207
100 3 11.7745 0 0 -0.321154 0 -16.9630 -0.29246
300 4 -6.1720 0 0 -0.367873 0.08383 2.377677 0.464374
600 5 -5.4348 0 0 -4.09279 0.05442 5.173351 0.92042
2
30 1 0.297554 0.01903 0.024614 0 0 -16.2345 -2.02499
60 2 0.956675 0 0.022 -0.01303 0 -5.07067 -0.74522
100 3 1.030225 0 0 -0.02233 0 -3.7443 -0.40356
300 4 -0.84804 0 0 -0.07128 0.00078 -2.16568 -0.70757
600 5 -1.58257 0 0 1.652779 0.00638 -2.07409 0.927077
3
30 1 14.5991 -0.01184 0 2.573621 0 -14.8624 0.393502
60 2 2.543126 0 -0.19360 2.926924 0 -5.65785 0.714309
100 3 7.28685 0 -0.12988 -0.15977 0 -12.2582 -0.28998
300 4 0.758729 0 0 -0.385819 0.01154 -26.5541 -1.86899
600 5 0 0 0 0 0 0 0
4
30 1 -0.31134 -0.02471 0 0.092958 0 0 0
60 2 61.86278 0 0.05293 -0.2816 0 -65.6632 -0.03676
100 3 -2.76471 0 0 0.190854 0 0 0
300 4 16.0555 0 0 0.305224 0.05917 -19.20 0.051576
600 5 2.6666 0 0 0.126391 0.06536 -7.33615 0.000108
Table 3. Goodness of fit of hydraulic conductivity predictions of the CRC method, coefficients are derived from log10 K (cm d-1)
Pressure head (hPa)
No outlier selection Ooutlier selection t = 3 (α= 0.01)
n RMSE Willmott COE n RMSE Willmott COE
30 106 0.311 0.875 0.630 86 0.236 0.928 0.780
60 106 0.258 0.913 0.729 85 0.173 0.960 0.855
100 106 0.317 0.860 0.583 87 0.226 0.926 0.746
300 106 0.391 0.780 0.418 93 0.269 0.881 0.619
600 106 0.324 0.859 0.600 87 0.215 0.921 0.752
exceed the texture data and bulk density are unknown as a general rule. For that reason, the application of PTFs must coexist with limited soil information. Despite this prob-lem, the proposed method yields reliable results. Figure 3, which shows the probability distribution of residuals after the elimination of outliers at a 1% error level indi-cates that residuals are roughly normally distributed. The Kolmogoroff-Smirnov test does not reject the normal
dis-tribution assumption at the 5% error level. Table 3 indicates a reliable prediction of soil hydraulic conductivity by the CRC method.
As mentioned above, most applications of pedotransfer functions require a knowledge of soil hydraulic parameters rather than discrete values of soil hydraulic conductivity. For that reason, we fitted the MvG model to measured water retention data and simultaneously to the PTF-generated hydraulic conductivity data. Comparing the model-cal-culated values of hydraulic conductivity to the measured
values revealed an increase in RMSE from 0.224 as shown
in Table 3 to 0.332.
In the first step, the parameters of the MvG model were fitted to the soil water retention data. No more than five points of the WRC were available. Since this study com-pares the performance of various methods to predict soil hydraulic conductivity, similar levels of information should be used.
In order to locate the position of the global error mini-mum, in the first step, by following the Monte Carlo Method (MCM), 90000 random numbers of parameters were used. Based on these initial estimates, a Fibonacci parameter optimization was performed (Vardavas, 1989). The results of the MCM were only used as initial estimates. The fol-lowing search algorithm had the full range of reliable parameters at its disposal. The average goodness of fit was
0.0103 cm3 cm-3 after the MCM-step and 0.0064 cm3 cm-3
after the Fibonacci search indicating on average a good rep-resentation of water retention by the model.
In order to calculate soil hydraulic conductivity (Eq. (3)), a matching point at -63 hPa was used. Since the ob- served value of hydraulic conductivity at -63 hPa was cho-sen, the results at this pressure head level do not represent a prediction. The prediction results are shown in Table 4.
Prediction errors are similar to those of the CRC meth-od but were on average somewhat larger. Figure 4 indicates larger errors at -600 hPa. In order to rank the method in comparison to the CRC method, we must consider two con-flicting influences. The MvG method is in favour because much more information is provided to the MvG method than is used by the CRC method. On the other hand, the
Table 4. Goodness of fit of hydraulic conductivity predictions
of the Mualem/van Genuchten method
h
(hPa) No outlier selection
Outlier selection t = 3 (α = 0.01)
n RMSE Willm. n RMSE Willm.
-30 106 0.333 0.896 77 0.215 0.945
-60 106 0. 1. 81 0. 1.
-100 106 0.212 0.955 89 0.15 0.979
-300 106 0.583 0.769 95 0.388 0.832
-600 106 0.729 0.715 96 0.479 0.778
Mean 0.464 0.308
Fig. 2. CRC method, probability distribution of residuals.
Fig. 3. Comparison between measured and predicted values of
hydraulic conductivity, log (K), cm d-1, CRC-method.
Observed Observed
Observed Observed
Calculated
Calculated
Calculated
Calculated
Observed
CRC
(with outlier selection)
results of the CRC method are obtained by using the cali-bration data set, whereas the same data set is a validation data set for MvG. That is, the differences do not discrimi-nate between the methods in themselves but between their suitability for application in practice.
The soil parameters of the fractal method proposed
by Soto et al. (2017) were estimated from water
reten-tion data similar to the procedure outlined above. In this case, the surface of the water retention errors seems to be very irregular or ragged. An important requirement of the Fibonacci optimization technique is that there must be only one error minimum within the actual search range. Obviously, this requirement was not met when the param-eter search was perfomed over a large range. The research team had to restrict the range and allowed the parameters to be estimated only in a narrow surrounding around the
MCM results. The average RMSE was 0.0125 after
per-forming the MCM search and 0.00998 cm3 cm-3 after the
second step. Interestingly, this result is only slightly worse than that obtained with the van Genuchten model. Based on parameters estimated from soil water retention, the rela-tive hydraulic conductivity was calculated by Eq. (7). With
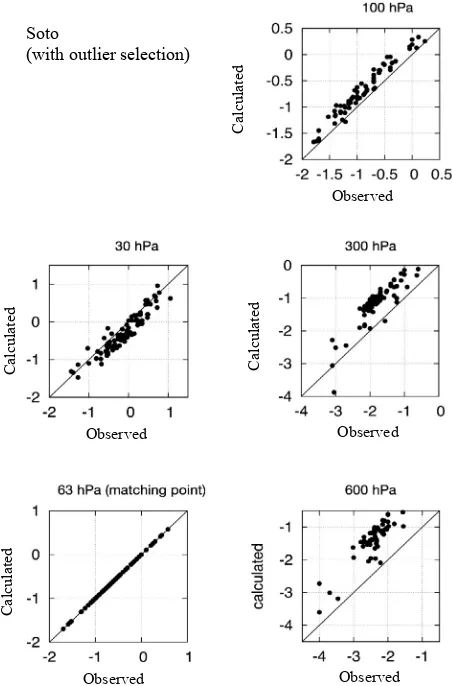
regard to the matching point we followed the same method as described above. The results shown by Table 5 indicate
favourable RMSE values down to -100 hPa.
The prediction of hydraulic conductivity at lower levels of pressure head is associated with larger errors. With our data set, the Soto method shows a tendency to overestimate hydraulic conductivity (Fig. 5).
Fig. 4. Comparison between measured and predicted values of
hydraulic conductivity, log (K), cm d-1, MvG method. MvG
(with outlier selection)
Observed Observed
Observed Observed
Calculated
Calculated
Calculated
Observed
Calculated
Calculated
Table 5. Goodness of fit of hydraulic conductivity predictions
of the Soto fractal method
h
(hPa) No outlier selection
Outlier selection t = 3 (α = 0.01)
n RMSE Willm. n RMSE Willm.
-30 106 0.333 0.899 89 0.240 0.947
-60 106 0. 1. 97 0. 1.
-100 106 0.395 0.859 71 0.235 0.957
-300 106 0.956 0.572 67 0.715 0.724
-600 106 1.367 0.436 61 1.076 0.580
Mean 0.763 0.566
Fig. 5. Comparison between measured and predicted values of
hydraulic conductivity log (K), cm d-1, fractal method. Soto
(with outlier selection)
Observed Observed
Observed Observed
Calculated
Calculated
Observed
Calculated
To complete the comparison between the new CRC method and various different methods, the pedotransfer
functions (i) after Weynants et al. (2008) and (ii) after
Zacharias and Wessolek (2007) were used to predict the hydraulic conductivity of the same set of soils. Both of them are based upon clay and silt content. Because the upper limit of silt is defined at 0.05 mm in contrast to 0.063 mm as used in our database, a logarithmic interpolation was performed. The Weynants method requires the organic carbon content to be known but this information was not available. Since the database used here contains mineral soils, an organic
carbon content of 2 g kg-1 was assumed for all soils.
The Weynants method yields the water retention para- meters of the van Genuchten model but also estimates of the tortuosity coefficient as well. Additionally, an estimate
of the apparent hydraulic conductivity K0 at zero suction is
given, which does not include the effect of macroporosity. In order to predict the hydraulic conductivity using the Zacharias PTF, the tortuosity parameter was assumed to be 0.5 and the matching point used was identified with the measured hydraulic conductivity at -63 hPa.
Results indicate that both of the methods are reliable and perform well. Surprisingly, the Zacharias and Wessolek PTF yields an excellent predicition of the hydraulic con-ductivity at -30 and -100 hPa (Tables 6 and 7).
DISCUSSION
Information concerning soil hydraulic conductivity is required for many purposes, mainly for hydrologic land surface models to predict stream discharge and land flood-ing. In order to obtain relevant information, different methods have been proposed:
1. The measurement of soil hydraulic properties has been simplified by Peters and Durner (2008).
2. Several methods to predict soil hydraulic properties from soil texture and organic matter content have been
developed (van Looy et al., 2017; Hewelke et al., 2015;
Puhlmann and Wilpert, 2012; Woesten et al., 2001, among
others). Most of these methods do not provide data con-cerning soil hydraulic conductivity, but rather they produce soil water retention data. Thus, a soil hydraulic model, for
instance, the MvG model (Vogel et al., 2001) is required to
obtain the soil hydraulic conductivity. In order to relate the non-hydraulic to the hydraulic soil properties, regression techniques and artificial neural network methods are used.
3. Databases such as UNSODA or HYPRES connected
to neural networks codes are used (Schaap et al., 2001) and
implemented into the common simulation models, such as HYDRUS.
Most pedotransfer functions are based on soil texture and provide soil hydraulic parameters. In contrast, the CRC method calculates the discrete values of hydraulic conduc-tivity from water retention data. The dataset used in this study, is a training data set originating from typical soils in Germany and Austria. It was too small to be divided into a training and a validation data set. It must be left to the users to gather experiences concerning validations of their own. Moreover it is assumed, that the new CRC method as introduced here, is not intended for world-wide appli-cation but is likely to be useful for many landscapes in Europe. Based on our results, it is a reasonable possibility that there are important soil hydraulic properties which do not express themselves in data concerning soil texture and soil water retention. To mention just two, the tortuosity and connectivity of the pore system have a significant effect on soil hydraulic conductivity. These properties depend on geological materials and the age of the soils. Thus, they vary at a regional level and this circumstances may prohibit the world-wide application of only one set of pedotransfer functions.
CONCLUSIONS
1. Because pedotransfer functions are still influenced by the geological material of the training data set, climate and land use, pedotransfer functions users should control and validate the methods using own lab or field measurements.
2. We therefore suggest using the new CRC approach which only needs a few measured nodes of the water reten-tion funcreten-tion to directly calculate the hydraulic conductivity at these points.
Table 6. Goodness of fit of hydraulic conductivity predictions
of the pedotransfer function after Weynants et al. (2008) and Zacharias and Wessolek (2007). Outlier selection at the 1% error level
h (hPa)
PTF Weynants et al. PTF Zacharias and Wessolek
n RMSE Willm. n RMSE Willm.
-30 87 0.454 0.455 82 0.199 0.953
-60 87 0.423 0.365 88 0. 1.
-100 88 0.333 0.322 88 0.149 0.979
-300 86 0.299 0.288 89 0.412 0.855
-600 91 0.307 0.425 87 0.500 0.810
Mean 0.362 0.315
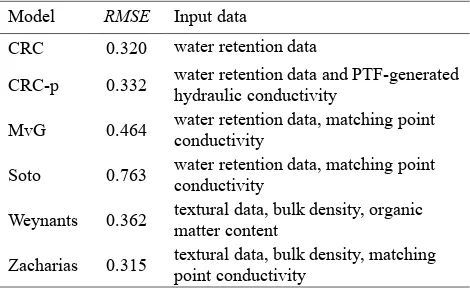
Table 7. Concise summary of prediction errors in terms of
RMSE
Model RMSE Input data
CRC 0.320 water retention data
CRC-p 0.332 water retention data and PTF-generated hydraulic conductivity
MvG 0.464 water retention data, matching point conductivity
Soto 0.763 water retention data, matching point conductivity
Weynants 0.362 textural data, bulk density, organic matter content
3. If it becomes necessary to predict unsaturated soil hydraulic conductivity without any soil hydraulic informa- tion, the Weynants method is eligible. However, the most accurate prediction for unsaturated hydraulic conductivity is the pedotransfer functions of Zacharias and Wessolek.
Conflict of interest: The Authors do not declare
con-flict of interest.
REFERENCES
Feichtinger F., 1990. Feld-, Labor- und indirekte Methoden zur
Bestimmung der kapillaren Leitfähigkeit. Mitt. Bunde- sanstalt für Kulturtechnik und Bodenwasserhaushalt.
Hewelke P., Gnatkowski T., Tyszka J., and Żakowicz S., 2015. Analysis of water retention capacity for selected forest soils in Poland. Pol. J. Environ. Stud., 24, No. 3, 1013-1019. https://doi.org/10.15244/pjoes/23259
Legates D.R. and McCabe G.J., 1999. Evaluating the use of
“goodness-of-fit” measures in hydrologic and hydroclimat-ic model validation. Water Res. Res., 35(1), 233-241. https://doi.org/10.1029/1998wr900018
Minasny B., Montzka C., Padarian J., and Verhoef A., 2017.
Pedotransfer functions in Earth system science: challenges and perspectives. Reviews of Geophysics,
DOI:10.1002/2017RG000581
Peters A. and Durner W., 2008. Simplified evaporation method
for determining soil hydraulic properties. J. Hydrol., 356, 147-162. https://doi.org/10.1016/j.jhydrol.2008.04.016
Puhlmann H. and von Wilpert K., 2012. Pedotransfer functions
for water retention and unsaturated hydraulic conductivity of forest soils. J. Plant Nutrition Soil Sci., 175, 221-235. https://doi.org/10.1002/jpln.201100139
Renger M., Bohne K., and Wessolek G., 2014. Verfahren zur
Berechnung der ungesättigten und gesättigten Wasserleit- fähigkeit aus einfach zugänglichen Daten. Bodenökologie und Bodengenese, Heft 43, TU Berlin.
Renger M., Stoffregen H., Klocke J., Facklam M., Wessolek
G., Roth C., and Plagge R., 1999. Ein autoregressives
Verfahren zur Bestimmung der gesättigten und ungesät-tigten hydraulischen Leitfähigkeit. J. Plant Nutr. Soil Sci., 162, 123-130. https://doi.org/10.1002/(sici) 1522-2624 (199903)162:2<123::aid-jpln123>3.0.co;2-y
Schaap M.G., Leij F.J., and van Genuchten M.Th., 2001.
Rosetta: a computer program for estimating soil hydraulic parameters with hierarchical pedotransfer functions. J. Hydrol., 251 163-176.
https://doi.org/10.1016/s0022-1694(01)00466-8
Soto M.A.A., Chang H.K., and van Genuchten M.Th., 2017.
Fractal-based models for the unsaturated soil hydraulic functions.Geoderma, 306, 144-151.
https://doi.org/10.1016/j.geoderma.2017.07.019
Van Genuchten M.Th., 1980. A closed-form equation for
pre-dicting the hydraulic conductivity of unsaturated soils. Soil Sci. Soc. Am. J., 44, 892-898. https://doi.org/10.2136/sssaj 1980.03615995004400050002x
Van Looy K., Bouma J., Herbst M., Koestel J., Minasny B.,
Mishra U., Montzka C., et al., 2017. Pedotransfer
func-tions in earth system science: Challenges and perspectives. Reviews of Geophysics, 55(4).
https://doi.org/10.1002/2017rg000581
Vardavas I.M., 1989. A Fibonacci search technique for model
parameter selection. Ecological Modelling, 48, 65-81, Amsterdam.
https://doi.org/10.1016/0304-3800(89)90060-4
Vereecken H., 1988. Pedotransfer functions for the generation of
hydraulicproperties for Belgian soils. Ph.D. Dissertation Katholieke Universiteit Leuven, Leuven, Belgium.
Vogel T., van Genuchten M.Th., and Cislerova M., 2001. Effect
of the shape of the soil hydraulic functions near saturation on variably-saturated flow predictions. Advances in Water Res., 24, 133-144.
https://doi.org/10.1016/s0309-1708(00)00037-3
Wendroth O. and Nielsen D.R., 1995. Land surface processes –
sampling the landscape and analyzing spatio-temporal patterns. Proceedings of a workshop. ZALF-Bericht no. 31, Müncheberg.
Weynants M., Vereecken H., and Javaux M., 2008. Revisiting
vereecken pedotransfer functions: Introducing a closed-form hydraulic model. Vadose Zone J., 8, 86-95.
https://doi.org/10.2136/vzj2008.0062
Willmott C.J., Robeson S.M., and Matsuura K., 2012. A refined index of model performance. Int. J. Climatology, 32(13), 2088-2092.
https://doi.org/10.1002/joc.2419
Woesten J.H.M., Pachepsky Y.A., and Rawls W.J., 2001.
Pedotransfer functions: bridging the gap between available basic soil data and missing soil hydraulic characteristics. J. Hydrol., 251, 123-150.
https://doi.org/10.1016/s0022-1694(01)00464-4
Wösten J.H.M., Lilly A., Nemes C., and Le Bas C., 1999.
Development and use of a data base of hydraulic properties of European soils. Geoderma, 90, 169-185.
https://doi.org/10.1016/s0016-7061(98)00132-3
Zacharias S. and Wessolek G., 2007. Excluding organic matter content from pedotransfer predictors of soil water retention. Soil Sci. Soc. Am. J., 71(1), 43-50.