Investors’ Fear and Stock Returns: Evidence from National Stock Exchange of India
Imlak Shaikh
Management Development Institute Gurgaon, MDI Gurgaon Haryana 122007, India
E-mail. imlak786@gmail.com
http://dx.doi.org/10.5755/j01.ee.29.1.14966
This study examines the asymmetric inter-temporal relationship between India volatility index (NVIX) and stock market returns (Nifty S&P 50, 100, 200 and 500) in the Indian securities markets. It is based on the daily value of the volatility index and stock indices for the period from 2009 to 2015. Findings suggest a strong negative correlation between daily changes in the NVIX and stock returns. This relationship is more prominent when NVIX is higher and more volatile. However, there is an asymmetry between India NVIX and the stock returns and the magnitude of asymmetry is not identical. Due to this asymmetry, NVIX is more of a gauge of investors’ fear and portfolio insurance price than investor positive sentiment. The impact of changes in the stock returns on India NVIX is greater when there are negative returns as compared to positive returns. Indeed, there is a spillover effect of CBOEs’ VIX and SPX index on the Indian securities market. The empirical outcome explains that the significant increase in the VIX (U.S.) index results into the momentous climb in the Nifty volatility index. Hence, Nifty volatility index is the best measure of the stock market turmoil on investors’ fear. The empirical results clearly indicate that this happens due to the market rally. These results have potential implications for the portfolio diversification, volatility traders and options trading-timing in the equity markets. The key evidence enables the stock exchange to introduce volatility products as an asset class to manage stock market volatility risk.
Keywords: Implied volatility; India NVIX; S&P CNX Nifty; Inter-temporal; Asymmetric; Stock Returns; Emerging Markets; Market Efficiency.
Introduction
The study investigates the relationship of stock returns with the investors’ sentiment in the Indian securities market. The market volatility index (VIX) of the Chicago Board Options Exchange (CBOE) is a good indicator of future short-term volatility in equity markets. The VIX is referred to as the investor fear gauge since high levels of volatility index have coincided with high degrees of market turmoil in the U.S. (Whaley, 2000). Researchers are very much interested in analyzing how stock market volatility is influenced by negative shocks and its behavior attributed to positive returns and near zero-returns. The implied volatility index is the new measure of stock market volatility and measure of investor fear on market performance. The National Stock Exchange of India (NSE) is one of the emerging markets in the trading of equities and derivatives. Nifty NVIX, of the National Stock Exchange of India (NSE), can be considered as the emerging markets’ volatility index. It is the gauge of investors’ fear and greed with short-horizon. Moreover, Indian equity markets are efficient (Shaikh & Padhi, 2014; Padhi & Shaikh, 2014) and option based implied volatility outperforms the historical return volatility in forecasting of stock market volatility.
Implied volatility explains very well the future stock market volatility hence it is the good indicator of future stock market volatility. Studies also show that stocks’ returns are highly negatively correlated to implied volatility index (Fleming et al., 1995; Giot, 2005a,b; Sarwar, 2012a,b; Shaikh & Padhi, 2016 and Shaikh, 2017). Also, the high negative returns affect implied volatility index more as compared to high positive returns. The real-time VIX value offers investors an up-to-the-minute estimate of future one-month stock
market volatility. This helps in making informed asset allocation and portfolio insurance decisions. Thus, the aim of the study is to compare the impact of high negative returns and high positive returns on the expected market volatility. Investors observe volatility to check the life of options. VIX (implied volatility index) is calculated and disseminated by the Chicago Board of Options Exchange using underlying S&P 500 options as an input.
There are mainly two basic factors that govern the relationship between stock returns and implied volatility. These two factors are volatility feedback and the leverage effects. Both factors give the same result which indicates that volatility is highly and negatively correlated to returns. The volatility feedback hypothesis (French et al., 1987; and Campbell & Hentschel, 1992) explains that the higher the expected volatility, the higher is the risk premium for the asset. The leverage effect (Black, 1976; Christie, 1982) is a bad remark for investors. With increasing expected volatility they lose faith in stocks and may result in fall in stock prices resulting in the firm potentially losing its worth and value.
et al. (2010a,b) have shown that the asymmetric impact holds on the implied volatility. However, the asymmetric nature and extent of the Indian stock market volatility in the form of NVIX have not been explored. Some of the recent works (e.g. Bates, 2000; Poteshman, 2001; Pan, 2002 and Denis et al., 2006) find the good degree of negative relationship between returns and implied volatility. Additionally, the empirical work (e.g. Fleming et al., 1995; Whaley, 2000; Low, 2004 and Bollerslev & Zhou, 2006) explains that implied volatility significantly attributed toward negative and positive return shocks. They find that implied volatility falls significantly for large positive returns shocks. Hence, at this point, one can say that implied volatility increases for the negative return shocks and falls following the positive return shocks. Ederington & Guan (2010) rightly noticed that this kind of asymmetric study became difficult in case of different prediction horizon, stock indices and data periods.
Copeland & Copeland (1999) explore the contem-poraneous relationship between the change in historical volatility and index returns, as well as in timing style (value and growth strategies) and percentage change in implied volatility indices for CBOE. The study reveals the fact that large capitalization stock outperforms small capitalization stock, and value-based portfolio outperforms growth based portfolios. Kanas (2012) examines the risk-return relationship between S&P 100 index and implied volatility index (VIX-SPX) using a variant of GARCH-M model. He believes that by allowing VIX as an exogenous factor the precision of the conditional variance measurement is improved. And, he finds a positive risk-return relationship between the two. Similarly, Kozyra & Lento (2011) analyze the trading signal based on implied volatility levels and propose that VIX level provides a large amount of profits, and reveal that a relationship holds between the level of expected volatility and profitability.
The aim of the present work is to explore the asymmetric inter-temporal relationship between market volatility (i.e., India NVIX) and the stocks returns (i.e., Nifty S&P 50, 100, 200 & 500). To determine the relationship between stock returns and NVIX, the model employed in the study is based on the framework of Fleming et al. (1995). An asymmetric relationship between stock returns and NVIX has been documented for the Indian securities market. The results suggest a strong negative correlation between daily change in the NVIX and stock returns. This relation is more prominent when NVIX is higher and more volatile. The results show that there is an asymmetry between volatility and the stock returns and the magnitude of asymmetry is not identical. Due to this asymmetry, NVIX is more of a gauge of investors’ fear and portfolio insurance price than investor positive sentiment. The impact of changes in the stock returns on the NVIX is greater when there are negative returns as compared to positive returns. The entire work is organized as follows: section “Introduction” offers the introduction and is followed by literature assessment, section “Data Sources and empirical model” deals with the data sources, descriptive analysis and empirical model, section “Empirical results and discussions”
1 For more details see Indian Securities Market: A Review (2012), National Stock Exchange of India Limited, Vol. XV. NSE now offers NVIX i.e. futures on its own volatility index India VIX (From 26th, February, 2014).
2 A ranking for single stock futures, stock index options and stock index futures is based on number of contracts traded.
discusses the results of model estimation and important conclusions are documented in the last section.
Data Sources and Empirical Model
The closing prices of India volatility index (NVIX) and various stock indices (Nifty S&P 50, 100, 200 & 500) have been collected from the website of National Stock Exchange of India (NSE). The dataset consists of sample period from 02/03/2009 to 31/12/2015. The stock market indices are calculated to capture overall behavior of securities markets. Hence, the stock indices are different from volatility index. The stock indices are being calculated based on the component stocks while volatility index is derived from the options prices. The Nifty 50 is based on 13 different sectors of the economy and it is one of the broader market-based measure. The Nifty 100 is the representative of 38 sectors of the economy and comprises of 100 stocks. The Nifty 100 index constitutes 61 % of the traded value of the NSE. The Nifty 200 index prepared with the aim to represent the behavior of large and mid-market capitalized companies. The Nifty 200 index is available from June 2004. Nifty 500 comprises the top 500 companies in the Indian economy with full market capitalization and it reports 87 % of the total trade value traded on the NSE. It is the representation of 73 industries of the Indian economy and available since March 2013. More importantly, it is to be noted that all the indices are being calculated using free float market capitalization mechanism.
The National Stock Exchange of India has introduced a number of derivative instruments in the Futures and Options section: like currency derivatives, interest rate derivatives, and recently, it also constructed the implied volatility index (India NVIX). Further, NSE has launched volatility products i.e., futures on India NVIX. The ISMR study shows that investors more prefer options than the futures in hedging the market holdings1. NSE is the main market for derivatives trading in India. The global rankings of NSE F&Os market are as: Single Stock Futures stood on the 4th, Stock Index Options on the 1st and Stock Index Futures on the 8th, based on the WFE2.
Implied volatility Index is the measure of expected volatility for the near future. It is estimated from the trading prices of the options written on the stock index. NVIX is the volatility index based on the NIFTY 50 options prices. Daily best bid-ask prices of OPTIDX (options are written on S&P CNX Nifty Equity Index) options contract are considered. The volatility in percentage term is calculated which indicates the expected market volatility over the next 30 calendar days (18 to 22, trading days). The implied volatility Index (India’s NVIX3) uses the same methodology as developed by the CBOE4.
Nifty indices are calculated using prices of their component stocks while NVIX is a volatility index derived from options rather than stock prices. India’s NVIX uses the same mechanism as adopted by CBOE with required amendments (see Appendix A). India’s first volatility index published in November 2007 and also known as Nifty
3See more about India VIX
http://www.nseindia.com/content/vix/white_paper_IndiaVIX.pdf 4 See more about CBOE VIX
volatility index symbolically named as NVIX. It is constructed in the similar fashion of the CBOE’s volatility index. NVIX is the model-free implied volatility index based on the highly liquid option. The implied volatility index does not depend on any classical asset pricing model. It is derived from the series of in-the-money (ITM) and out-of-the-money(OTM) Nifty index options for the cycle of one-month expiration. The stock indices are formed based on the stock prices and calculated as per the guidelines of S&P.
To analyze the asymmetric inter-temporal relationship between stock returns and volatility, the model of Fleming et al. (1995) has been employed as follows,
Let, ∆𝑁𝑉𝐼𝑋𝑡 = 𝑁𝑉𝐼𝑋𝑡 - 𝑁𝑉𝐼𝑋𝑡−1 (1) Where, ∆𝑁𝑉𝐼𝑋𝑡 signifies the change in India volatility index and 𝑅𝑡𝑖 =𝑙𝑛 (
𝑅𝑡 𝑅𝑡−1), 𝑅𝑡
𝑖 is the stock indices reruns, calculated for various Nifty stock indices, where: i = NIFTY S&P CNX50, 100, 200 and 500 (stock indices).𝑁𝑉𝐼𝑋𝑡= the daily close of India volatility index and 𝑅𝑡= the daily close of various broad market indices of Indian securities market.
The regression model to gauge the investors' fear is ∆𝑁𝑉𝐼𝑋𝑡 = 𝐼𝑛𝑡𝑒𝑟𝑐𝑒𝑝𝑡 + 𝑏−2𝑅𝑡−2𝑖 + 𝑏−1𝑅𝑡−1𝑖 + 𝑏0𝑅𝑡𝑖 +𝑏+1𝑅𝑡+1𝑖 + 𝑏+2𝑅𝑡+2𝑖 + 𝑏|𝑎𝑏𝑠|𝑅𝑡(𝑎𝑏𝑠)𝑖 + 𝐴𝑅(𝑝) +𝑒𝑡 (2)
The above Eq. (2) measures the co-movement between implied volatility and the stock returns. The left-hand side of the equation shows the expected volatility obtained from the closing price of NVIX and the right-hand side reported the market return which is calculated from Nifty 50, 100, 200 and 500 (stock indices). Recent evidence shows the strong negative correlation between expected future stock market volatility and stock market returns. The studies of Fleming et al. (1995), Whaley (2000), Skiodopoulos (2004), Dowly & Muthuswamy (2005) Frijns et al. (2010a) and Sarwar (2012a, b) provide the testable hypotheses for the Eq. (2): the slope should be negative (positive), and the estimated negative (positive) slope signifies that for negative stock
market returns the future ex -ante volatility increases (declines). The positive estimate explains that stock market volatility moves in the direction irrespective of the positive and negative shocks of the stock market returns.
India volatility index (NVIX) is based on the CBOE’s VIX methodology (see Appendix A). It is an indicator of investors’ sentiment (fear and greed) for the short-horizon. Now a day every stock market is interlinked with the global market, hence India’s NVIX follows the global benchmark indices, SPX and VIX index. The study also assesses the behavior of NVIX on the co-movement of SPX and VIX index as follows:
Model A:∆𝑁𝑉𝐼𝑋𝑡 = Intercept + 𝜇1𝑆𝑃𝑋𝑅𝑒𝑡𝑡+ 𝜇2AR(1) +𝑒𝑡 (3)
Model B:∆𝑁𝑉𝐼𝑋𝑡 = Intercept +𝜇1𝑆𝑃𝑋𝑅𝑒𝑡𝑡+𝜇2𝑁𝑖𝑓𝑡𝑦𝑅𝑒𝑡𝑡+
𝜇3AR(1) + 𝑒𝑡 (4)
Model C:∆𝑁𝑉𝐼𝑋𝑡 = Intercept + 𝜇1𝑆𝑃𝑋𝑅𝑒𝑡𝑡+𝜇2𝑉𝐼𝑋𝑅𝑒𝑡𝑡+
𝜇3AR(1) + 𝑒𝑡 (5)
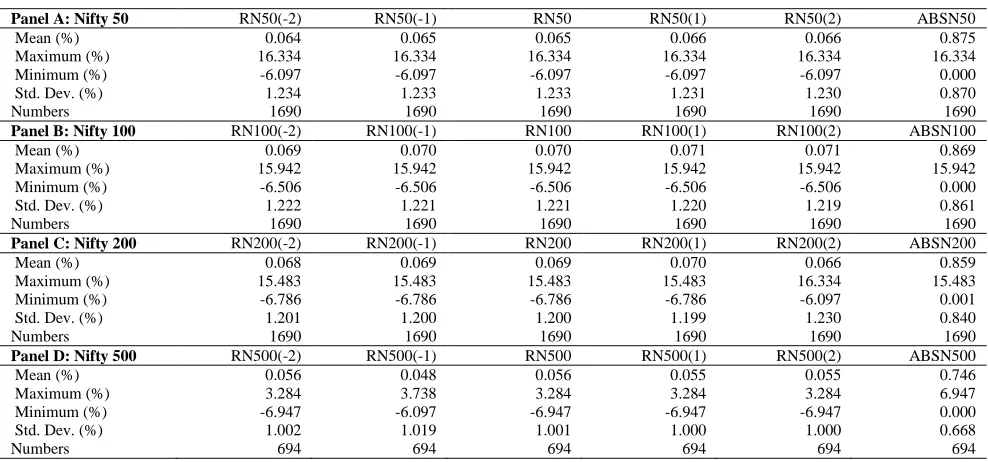
Model D:∆𝑁𝑉𝐼𝑋𝑡 = Intercept + 𝜇1𝑉𝐼𝑋𝑅𝑒𝑡𝑡+ 𝜇2AR(1) +𝑒𝑡(6) Table 1 and 2 report the summary statistics on the broader stock indices and volatility index for the Indian securities market. The descriptive measures are presented for the stock returns in percentage terms. It is also followed by lagged returns, lead returns and absolute returns. The average returns for all stock indices of the given sample period are found to be identical, but the average absolute returns appear to be higher of the mean actual returns. The stock market volatility for the crude stock returns is shown in figure 2. The corresponding values of change in the volatility index (see Table 2) appear to be negative. The degree of correlation between stock indices and the volatility index (NVIX) appear to be statistically significant. These are some of the prima facie evidence of the asymmetric inter-temporal relation between investors’ fear and stock returns. Further, this relationship has been investigated in the next section using the empirical model of Fleming et al. 1995.
Table 1 Summary Statistics
Panel A: Nifty 50 RN50(-2) RN50(-1) RN50 RN50(1) RN50(2) ABSN50
Mean (%) 0.064 0.065 0.065 0.066 0.066 0.875
Maximum (%) 16.334 16.334 16.334 16.334 16.334 16.334
Minimum (%) -6.097 -6.097 -6.097 -6.097 -6.097 0.000
Std. Dev. (%) 1.234 1.233 1.233 1.231 1.230 0.870
Numbers 1690 1690 1690 1690 1690 1690
Panel B: Nifty 100 RN100(-2) RN100(-1) RN100 RN100(1) RN100(2) ABSN100
Mean (%) 0.069 0.070 0.070 0.071 0.071 0.869
Maximum (%) 15.942 15.942 15.942 15.942 15.942 15.942
Minimum (%) -6.506 -6.506 -6.506 -6.506 -6.506 0.000
Std. Dev. (%) 1.222 1.221 1.221 1.220 1.219 0.861
Numbers 1690 1690 1690 1690 1690 1690
Panel C: Nifty 200 RN200(-2) RN200(-1) RN200 RN200(1) RN200(2) ABSN200
Mean (%) 0.068 0.069 0.069 0.070 0.066 0.859
Maximum (%) 15.483 15.483 15.483 15.483 16.334 15.483
Minimum (%) -6.786 -6.786 -6.786 -6.786 -6.097 0.001
Std. Dev. (%) 1.201 1.200 1.200 1.199 1.230 0.840
Numbers 1690 1690 1690 1690 1690 1690
Panel D: Nifty 500 RN500(-2) RN500(-1) RN500 RN500(1) RN500(2) ABSN500
Mean (%) 0.056 0.048 0.056 0.055 0.055 0.746
Maximum (%) 3.284 3.738 3.284 3.284 3.284 6.947
Minimum (%) -6.947 -6.097 -6.947 -6.947 -6.947 0.000
Std. Dev. (%) 1.002 1.019 1.001 1.000 1.000 0.668
Numbers 694 694 694 694 694 694
Table 2 Correlation Metrics
NVIX ∆NVIX RN50 RN100 RN200 RN500 N50 N100 N200 N500
NVIX 1.00 0.13 -0.03 -0.03 -0.04 -0.04 -0.35 -0.34 -0.35 -0.35
∆NVIX 0.13 1.00 -0.49 -0.50 -0.51 -0.51 -0.03 -0.03 -0.03 -0.03
RN50 -0.03 -0.49! 1.00 1.00 0.99 0.98 0.01 0.01 0.00 0.00
RN100 -0.03 -0.50! 1.00 1.00 1.00 0.99 0.02 0.01 0.01 0.01
RN200 -0.04 -0.51! 0.99 1.00 1.00 1.00 0.02 0.01 0.01 0.01
RN500 -0.04 -0.51! 0.98 0.99 1.00 1.00 0.02 0.02 0.01 0.01
N50 -0.35* -0.03 0.01 0.02 0.02 0.02 1.00 1.00 1.00 1.00
N100 -0.34* -0.03 0.01 0.01 0.01 0.02 1.00 1.00 1.00 1.00
N200 -0.35* -0.03 0.00 0.01 0.01 0.01 1.00 1.00 1.00 1.00
N500 -0.35* -0.03 0.00 0.01 0.01 0.01 1.00 1.00 1.00 1.00
[Note: the bold letter signifies: *there is a significant correlation (at 1 % level) between volatility index and broad benchmark indices, and ! implies there is a significant correlation(at 1 % level) between change in the volatility index and the stock returns.]
In order to analyze the investors’ fear and stock returns unit root and autocorrelation tests have been performed. The empirical model has been expressed in terms of returns, associated with the broad stock indices and its impact on the expected stock market volatility. Appendix B, clearly explains that returns associated with the respective stock indices are stationary at the level, at 1 % level of significance. Moreover, the LB –stat(12) shows that there is no issue of autocorrelation at 1 % level.
Figure 1 shows the time series plot of broad market indices for the Indian securities market. The time series plot has been presented in terms of future stock market volatility of 30-day horizon. The performance of stock market volatility has been plotted against the flow of stock-based indices. Figure 1 shows the plot of prices of Nifty 50, 100, 200 and 500 followed by the daily close of India volatility index. The first quadrant shows the plot of Nifty 50 and NVIX for the period ranging from March 2009 to December 2015. It is clearly visible from the graph that stock index and volatility are negatively associated. The higher volatility is due to the lower value of the underlying index observed in a particular time period. The time series plots of Nifty 50 and 100 are almost identical to each other. The first two-quadrant exhibits a strong asymmetry between stock returns and volatility. In fact, higher volatility is observed in more than 65 percent of the cases, for which the underlying stock index is observed to be very low (less than 1500 points). The plausible reason behind this asymmetric relationship is due to the stock market rally, which happens due to an aggressive participation of bulls and bears. The aggressive trading strategy adopted by the arbitrageurs in order to gain from the price differences in the short-run lead to increase in the stock market volatility. Consequently, the stock prices
fall and general level of expected stock market volatility increases. Moreover, when speculators enter the market with the intention to gain from the significant price movements that also lowers the stock prices. The negative association between the stock and volatility happens due to the leverage effects and volatility feedback. The overreaction of the investors is higher when they experience negative returns rather than the positive returns. Hence, the shock of the negative returns shows the larger impact on the stock market volatility and it is followed by further stock price decline.
Figure 1. Time Series Plot of Stock Market Volatility and Stock Indices
Figure 2. Time Series Plot of Stock Market Volatility and Benchmark Stock Indices Returns
Empirical Results and Discussions
Table 3 shows the OLS results on the relation between stock returns and volatility index. The regression equation (2) has been estimated for various benchmark stock indices traded on the National Stock Exchange of India. The table reports the estimated coefficients along with t-statistics; the right-hand side shows adjusted R2 and F-statistics of
respective models. Moreover, Durbin Watson DW -statistics have been reported to confirm that there is no problem of autocorrelation. Overall, for all the models F-statistics remains statistically significant at 1 percent of the level of significance. This implies that the regression model is sufficient to explain the relationship between change in the volatility and stock returns. In addition, the AR(p) term has been added to resolve the issue of autocorrelation. The intercept of each model seems to appear statistically
significant. This implies that there are some unobserved factors that explain the stock market volatility.
market volatility. The results are in line with the empirical evidence reported for the U.S. and emerging markets (Giot, 2005a,b; Shaikh & Padhi, 2014, 2015). The asymmetry prevails in the Indian securities market due to a negative relationship between volatility and stock returns. Hence, Nifty volatility index is the best measure of gauge of investors’ fear of the stock market turmoil. The empirical result clearly signifies that this happens due to the market rally. Most interestingly, this phenomenon can be explained by the theory of portfolio insurance. According to the portfolio insurance theory, investors buy more hedge funds when they feel nervous.
Model 2: The regression outcomes explain that there is an asymmetric inter-temporal relationship between NVIX and CNX Nifty S&P 100. The estimated significant slopes of the Model 2 are CNX100(-1) and CNX100, the respective values are 18.726(7.39) and -55.278(-24.83), which are statistically significant. The results indicate that there is an asymmetric relationship between stock index Nifty 100, and the relationship also remains true in the long-run. By looking at the lead and lag variables one could not find significant relationship except at one period lag. The one period lag of stock returns shows a positive relation with stock market volatility, which is inconsistent with the hypothesis of contemporaneous asymmetry.
Model 3: Model -3 reports the asymmetric relation between Nifty 200 and NVIX. The slope of the stock return estimated -56.216(-24.97) with significant t-statistics. This implies a strong negative association between volatility and stock market returns. In this model rest of the explanatory variables appears to be in line with the previous models.
Model 4: This model explains the inter-temporal an asymmetric relationship between Nifty & S&P 500 stock index. The calculated estimate -57.726(-14.84) again remains significant. It is apparent from the results that stock
market volatility and stock returns have a negative relationship and this happens due to the volatility feedback and leverage effects. The negative stock return shows the significant positive impact on the stock market volatility. When the investors’ see negative returns, they feel nervous and consequently, they buy more hedge funds to protect their market holdings. The overall convention of fearful market participants results into an increase of stock market volatility.
Lagged and lead impact: Fleming et al. (1995) test the lagged impact to stock returns on the stock market volatility. By taking into account variously estimated slopes of lagged returns variable, one can find some evidence of lagged relation between stock returns and volatility. The change in the stock market volatility is found to be positive for one period lagged returns. But no significant co-movement is seen for the two periods lagged values. Empirical results show that lagged returns contain some information to explain the future stock market volatility, for the one-month horizon. Moreover, it seems evident from the outcome that there is no significant co-movement for the lead returns on major stock indices for the Indian securities market.
Asymmetric relation and absolute returns: In line with the previous studies for the U.S. and emerging markets on the study of asymmetric relationship between the stock returns and stock market volatility, the present study shows similar results. Table 3 show that the slope of stock returns (NIFTY S&P 50, 100, 200 and 500) is negative and statistically significant. This implies that underlying stock prices shows significant impact on the stock market volatility. More specifically, the negative stock returns have a significant impact on the future stock market volatility. The study models the change in the stock market volatility in the form of investors’ fear gauge index. Moreover, in most of the cases, the impact of crude absolute stock return does show significant changes in the expected stock market volatility.
Table 3 OLS Estimates of Stock Returns and Investors’ Fear
[Significant @ *1 %, **5 %, ***10 %; The model ∆ 𝑁𝑉𝐼𝑋𝑡 = 𝐼𝑛𝑡𝑒𝑟𝑐𝑒𝑝𝑡 + 𝑏−2𝑅𝑖𝑡−2 + 𝑏−1𝑅𝑡−1𝑖 + 𝑏0𝑅𝑡𝑖 +𝑏+1𝑅𝑡+1𝑖 + 𝑏+2𝑅𝑡+2𝑖 + 𝑏|𝑎𝑏𝑠|𝑅𝑡(𝑎𝑏𝑠)𝑖 + AR(p)
+ 𝑒𝑡 (1) where: i = S&P100, S&P200, S&P500 and NIFTY50 (stock indices)]
Model Lagged values Return Lead values Absolute
Returns AR(p) Other statistics
Model 1 S&P 50 N = 1690
Intercept S&P100 (-2) S&P100 (-1) S&P100 S&P100 (1) S&P100 (2) S&P100 (ABS) ∆ NVIX (-2) ∆ NVIX (-1) Adj. R2 F-stat
Estimate -0.216 -1.997 17.788 -54.760 -0.184 -2.014 25.760 -0.069 0.036 0.28 83.78*
t-stat -5.61* -0.79 7.09* -24.67* -0.08 -0.92 8.16* -2.94* 1.53 DW-stat 2.00
Model 2 S&P 100 N = 1690
Intercept S&P200 (-2)
S&P200
(-1) S&P200
S&P200 (1) S&P200 (2) S&P200 (ABS) ∆ NVIX (-2) ∆ NVIX
(-1) Adj. R
2 F-stat
Estimate -0.214 -1.610 18.726 -55.278 -0.774 -1.927 25.865 -0.068 0.037 0.28 85.74*
t-stat -5.55* -0.63 7.39* -24.83* -0.35 -0.87 8.14* -2.87* 1.53 DW-stat 2.00
Model 3 S&P 200 N = 1690
Intercept S&P500 (-2)
S&P500
(-1) S&P500
S&P500 (2) S&P500 (1) S&P500 (ABS) ∆ NVIX (-2) ∆ NVIX
(-1) Adj. R
2 F-stat
Estimate -0.217 -2.283 20.585 -56.216 -1.053 -1.786 26.446 -0.072 0.040 0.29 88.41*
t-stat -5.63* -0.88 7.99* -24.97* -0.47 -0.82 8.20* -3.05* 1.68*** DW-stat 2.00
Model 4 S&P 500 N = 694
Intercept NIFTY
(-2)
NIFTY
(-1) NIFTY
NIFTY (1) NIFTY (2) NIFTY (ABS) ∆ NVIX (-2) ∆ NVIX
(-1) Adj. R
2 F-stat
Estimate -0.168 -3.500 13.252 -57.726 -2.129 3.173 26.373 -0.140 0.066 0.30 38.24*
To examine U.S. equity markets’ effects on the Indian equity market Model A to D has been estimated. The results using the empirical model are shown in the Appendix C. Model A clearly shows that SPX market and NVIX are negatively associated; as the SPX market goes down the Nifty volatility index increases significantly. Model B shows that investors are concerned about both the adverse co-movement of SPX and Nifty index, and supports the results of the previous model. Model C describes the effects of VIX on the Nifty volatility index and it is apparent from the results that there is a positive spillover effect on the Indian securities market. Model D also supports the outcome of the earlier regression model. At this point, one can say that U.S. equity market and India volatility index (NVIX) are negatively associated due to the asymmetric effects of stock returns. Moreover, the significant increase in the U.S. CBOE’s VIX index results in a significant rise in the Nifty volatility index.
Conclusion
This study shows the asymmetric relationship between the market volatility and stock returns. The empirical work has been done for the period ranging from 2009-2015, the daily closing prices of volatility index and stock indices are collected from the NSE. It is apparent from the regression outcome that there is a significant negative correlation between NVIX and stock returns. The inter-temporal asymmetric relationship has been investigated between the expected market volatility (NVIX) and broad market stock indices (i.e. Nifty 50, 100, 200 and 500). The empirical model shows that long run inter-temporal asymmetric relation persists between the implied volatility and stock
market returns. The negative stock return shows significant positive effects on the stock market volatility. When investors’ experience negative returns, they feel nervous and consequently they buy more hedge funds (more buying pressure on options, particularly put options) to protect their market portfolio. The overall convention of fearful investors results in increased stock market volatility.
There is considerable evidence available that supports the asymmetry of stock returns and stock market volatility. The benchmark stock indices of Indian securities market are negatively associated with the expected stock market volatility. This evidence enables the stock exchange to introduce volatility products to manage the stock market volatility risk. The NSE has already introduced the Futures on NVIX. In the near future with the approval from Securities and Exchange Board of India (SEBI) there is plan to add Options on NVIX. The findings suggest a strong negative relation between daily change in NVIX and stock returns. This relation is more prominent when NVIX is higher and more volatile. The results show that there is an asymmetry between NVIX and the stock returns, and the magnitude of an asymmetry is not identical. Indeed, the asymmetry persists between NVIX and the U.S. SPX market. Due to this asymmetry, NVIX is more of a gauge of investor fear and portfolio insurance price than investor positive sentiment.
Appendix A: NVIX index calculation
Following equation developed to estimate NVIX: 2
0 2
2
1 1 ) ( 2
K F T K Q e K
K
T i
RT
i i
i
Description of the Inputs of the Formula:
𝝈 Is the Nifty NVIX shown in the percentage term i.e. NVIX/100 ⇒ NVIX = 𝜎 x 100 T Time-to-expiration i.e. life of the options
F Forward index level derived from index option prices K0 First strike below the forward index level, F
Ki Strike price of ith out-of-the-money option; a call if Ki > K0 and a put if Ki< K0; both put and call if Ki=K0. Δ Ki
2 1
1
i i
i
K K K
Interval between strike prices – half the difference between the strike on either side of Ki:
(Note: ΔK for the lowest strike is simply the difference between the lowest strike and the next higher strike. Likewise, ΔK for the highest strike is the difference between the highest strike and the next lower strike.) R Risk-free-rate-of- interest to expiration (MIBOR, i.e. 30 days/90 days)
Q(Ki) The midpoint of the bid-ask spread for each option with strike Ki.
Appendix B:Stationarity and Autocorrelation Test
RN50 RN100 RN200 RN500 DNVIX
ADF-test -38.92* -38.63* -38.13* -23.11* -42.38*
p-value 0.000 0.000 0.000 0.000 0.000
PP-test -38.91* -38.61* -38.10* -22.97* -42.97*
p-value 0.000 0.000 0.000 0.000 0.000
LB-stat(12) 21.67* 23.06* 25.32* 19.13* 25.14*
p-value 0.041 0.027 0.013 0.086 0.014
Appendix C:Indian Stock Market (Nifty) and CBOE Market Volatility Index (VIX)
Dependent Variable: Change in NVIX
Model A Model B Model C Model D
Estimate t-stat Estimate t-stat estimate t-stat Estimate t-stat
Intercept -0.0059 -0.22 0.0106 0.43 -0.0114 -0.43 -0.0167 -0.64
SPXRet -27.6027 -5.72* -5.2320 -1.26 -13.4269 -1.97**
NiftyRet -50.9558 -6.73*
VIXRet 2.6009 3.08* 4.1067 7.00*
AR(1) -0.2292 -3.07* -0.1680 -1.84*** -0.2331 -3.12* -0.2292 -3.06*
Adj. R2 0.07 0.21 0.08 0.07
DW-stat 2.00 2.03 2.01 2.00
F-stat 72.89* 162.08* 52.64* 75.73*
Significant @ *1 %, **5 %, ***10 %
References
Bates, D. S. (2000). Post-'87 crash fears in the S&P 500 futures option market. Journal ofEconometrics, 94(1/2), 181– 238. https://doi.org/10.1016/S0304-4076(99)00021-4.
Black, F. (1976). Studies of the stock price volatility changes. Proceedings of the 1976 meeting of the American Statistical Association. Business and Economical Statistics Section, (pp. pp. 177–181).
Bollerslev, T., & Zhou, H. (2006). Volatility puzzles: a simple framework for gauging return-volatility regressions. Journal of Econometrics, 131(1/2), 123–150. https://doi.org/10.1016/j.jeconom.2005.01.006.
Campbell, J., & Hentschel, L. (1992). No News is Good News: An Asymmetric Model of Changing Volatility in Stock Returns. Journal of Financial Economics, 31(3), 281–318. https://doi.org/10.1016/0304-405X(92)90037-X. Chin, W. C., Lee, M. C., & Yap, G. L. (2016). Modelling Financial Market Volatility Using
Asymmetric-Skewed-ARFIMAX and-HARX Models. Inzinerine Eonomika-EngineeringEconomics, 27(4), 373–381. http://dx.doi.org/10. 57 55/j01.ee.27.4.13927.
Christie, A. A. (1982). The stochastic behavior of common stock variances:value, leverage and interest rate effects. Journal of Financial Economics, 10(4), 407–432. https://doi.org/10.1016/0304-405X(82)90018-6.
Copeland, M. M., & Copeland, T. E. (1999). Market Timing: Style and Size Rotation Using the VIX. Financial Analysts Journal, 55(2), 73–81. https://doi.org/10.2469/faj.v55.n2.2262.
Dajcman, S. (2015). An empirical investigation of the nexus between sovereign bond yields and stock market returns–a multiscale approach. Inzinerine Ekonomika-Engineering Economics, 26(2), 108–117. http://dx.doi.org/10.5 755/j01.ee.26.2.6416.
Dennis, P., Mayhew, S., & Stivers, C. (2006). Stock Returns, Implied Volatility Innovations, and the Asymmetric Volatility Phenomenon. Journal of Financial and Quantitative Analysis, 41(2), 381–406. https://doi.org/10.1017 /S0022109000002118.
Dowling, S., & Muthuswamy, J. (2005). The implied volatility of Australian index options. Working Paper, 14(1), 117– 155. https://dx.doi.org/10.2139/ssrn.500165.
Ederington, L. H., & Guan, W. (2010). How asymmetric is U.S. stock market volatility? Journal of Financial Markets, 13, (2) 225–248. https://doi.org/10.1016/j.finmar.2009.10.001.
Fleming, J., Ostdiek, B., & Whaley, R. E. (1995). Predicting stock market volatility: A new measure. Journal of Futures Markets, 15(3), 265–302. http://dx.doi.org/10.1002/fut.3990150303.
French, K. R., Schwert, G. W., & Stambaugh, R. F. (1987). Expected stock returns and volatility. Journal of Financial Economics, 19(1), 3–29. https://doi.org/10.1016/0304-405X(87)90026-2.
Frijns, B., Tallau, C., & Tourani-Rad, A. (2010a). The information content of implied volatility: Evidence from Australia. Journal of Futures Markets, 30(2), 134–155. http://dx.doi.org/10.1002/fut.20405.
Frijns, B., Tallau, C., & Tourani-Rad, A. (2010b). Australian Implied Volatility Index. Jassathe Finsia Journal of Applied Finance, 10 (1), 31–35.
Giot, P. (2005a). Relationships Between Implied Volatility Indexes and Stock Index Returns. The Journal of Portfolio Management, 31(3) 92–100. https://doi.org/10.3905/jpm.2005.500363.
Giot, P. (2005b). Implied Volatility Indexes and Daily Value at Risk Models. The Journal ofDerivatives, 12(4), 54–64. https://doi.org/10.3905/jod.2005.517186.
Kozyra, J., & Lento, C. (2011). Using VIX data to enhance technical trading signals. AppliedEconomics Letters, 18(14), 1367–1370. http://dx.doi.org/10.1080/13504851.2010.537623.
Low, C. (2004). The Fear and Exuberance from Implied Volatility of S&P 100 Index Options. The Journal of Business, 77(3), 527–546. http://dx.doi.org/10.1086/386529.
Padhi, P., & Shaikh, I. (2014). On the relationship of implied, realized and historical volatility: Evidence from NSE Equity Index Options. Journal of Business Economics and Management, 15(2), 915–934. http://dx.doi.org/10.3846 /16111699. 2013.793605.
Pan, J. (2002). The Jump-Risk Premia Implicit in Options:Evidence from an Integrated Time-Series Study. Journal of Financial Economics, 63(3), 3–50. https://doi.org/10.1016/S0304-405X(01)00088-5.
Poteshman, A. M. (2001). Underreaction, Overreaction, and Increasing Misreaction to Information in the Options Market. The Journal of Finance, 56(3), 851–876. http://dx.doi.org/10.1111/0022-1082.00348.
Sarwar, G. (2012a). Intertemporal relations between the market volatility index and stock index returns. Applied Financial Economics, 22(11), 899–909. http://dx.doi.org/10.1080/09603107.2011.629980.
Sarwar, G. (2012b). Is VIX an investor fear gauge in BRIC equity markets? Journal of Multinational Financial Management, 22(3), 55–65. https://doi.org/10.1016/j.mulfin.2012.01.003.
Schwert, G. W. (1989). Why does stock market volatility change over time? Journal of Finance, 44(5), 1115–1153. http://dx.doi.org/10.1111/j.1540-6261.1989.tb02647.x.
Schwert, G. W. (1990). Stock Volatility and the Crash of '87. Review of Financial Studies, 3(1), 77–102. https://doi.org/ 10.1093/rfs/3.1.77.
Shaikh, I. (2017). The 2016 U.S. presidential election and the Stock, FX and VIX markets. The North American Journal of Economics and Finance, 42, 546–563. https://doi.org/10.1016/j.najef.2017.08.014.
Shaikh, I., & Padhi, P. (2014). The forecasting performance of implied volatility index: Evidence from India VIX. Economic Change and Restructuring, 47(4), 251–274. https://doi.org/10.1007/s10644-014-9149-z.
Shaikh, I., & Padhi, P. (2015). The behavior of option's implied volatility index: A case of India VIX. Business: Theory and Practice /Verslas: Teorija ir Praktika, 16(2), 149–158. https://doi.org/10.3846/btp.2015.463.
Shaikh, I., & Padhi., P. (2016). On the relationship between implied volatility index and equity index returns. Journal of Economic Studies, 43(1), 27–47. https://doi.org/10.1108/JES-12-2013-0198.
Skiadopoulos, G. (2004). The Greek implied volatility index: construction and properties. Applied Financial Economics, 14(16), 1187–1196. http://dx.doi.org/10.1080/0960310042000280438.
Whaley, R. E. (2000). The Investor Fear Gauge. The Journal of Portfolio Management, 26(3), 12–17. https://doi.org/10.39 05/jpm.2000.319728.
Wu, C., Luo, P., Li, Y., & Chen, K. (2015). Stock Price Forecasting: Hybrid Model of Artificial Intelligent Methods. Inzinerine Ekonomika-Engineering Economics, 26(1), 40–48. http://dx.doi.org/10.5755/j01.ee.26.1.3836.