The Effect of Service Quality and Customer Value on Customer Satisfaction in Retail
Industry
Author’s Details: (1)
Siti Nurjanah-Kalbis Institute (2)Vina Meliana-Kalbis Institute Corresponding author: siti.nurjanah@kalbis.ac.id
Abstract
This study aims to determine the effect of service quality and customer value of Indomaret and Alfamart on satisfaction. The research design used in this study is explanatory design. The location of this research is Bekasi with the object of research being two mini markets. The research data uses primary data by distributing questionnaires to respondents, the data were analyzed using SPSS. The results of this study indicate that service quality and customer value have an influence on customer satisfaction. Median calculation results of service quality and customer value indicate that Alfamart is smaller than Indomaret. while the Median customer satisfaction perceived by Alfamart customers is greater than Indomaret.
Keywords: Service Quality, Customer Value, Satisfaction.
1. Introduction
Indonesia with a population of 252 million, 50% of whom are productive age. This makes Indonesia the most potential market in Southeast Asia. Indonesia's GDP per capita of US $ 3,500 exceeds competitor countries in ASEAN such as the Philippines and Vietnam. The number of households in Indonesia with an annual budget of around the US $ 5,000-US $ 15,000 is estimated to expand from 36% at present to 58% in 2020. More than 60 million low-income residents are projected to join the middle class in the coming decade, thus encourage stronger consumer demand. The total market for the consumer goods industry in Indonesia in 2030 is estimated to be the US $ 810 billion.
Consumer spending in Indonesia grows at an average annual rate of around 11.8% for the 2012-2015 period. In 2015, consumer spending on food was estimated at Rp 1,930 trillion, while non-food products amounted to Rp 4,369 trillion. The modern trade industry for the fast-moving consumer goods (FMCG) category in Indonesia grew by an average of 10.8% in 2015, with the highest growth occurring in the minimarket segment by 11% and super / hypermarkets at 10.6%. Modern shop sales per capita in Indonesia are estimated at the US $ 60 with a composition of 56% in minimarkets and 44% in super / hypermarkets. The market size of the minimarket industry in Indonesia is around IDR 73 trillion with an annual average growth of 13.5% for the period 2012-2015. In 2015, the highest sales growth in the modern retail industry was experienced by the personal care segment by 12.7%, while the lowest sales were pharmaceutical products at 1.8%.
Tight competition in the minimarket, convenience, and super / hypermarket segments. Alfamart carried by PT Sumber Alfaria Trijaya Tbk (AMRT) competes with PT Indomarco (Indomaret) and 7-Eleven made by PT Modern International Tbk (MDRN). While in the super / hypermarket segment, Hero competes with Hypermart which is carried by PT Matahari Putra Prima Tbk (MPPA).
In addition, the growth of the increase in outlets of each company was shown from Alfamart, Indomart, 7-eleven, Hero (Giant), and Hypermart (MPPA Retail Group). Do not forget to display expansion strategies, trends in income and profits, and financial ratios of each retailer.
The problem of service is actually not a difficult or complicated thing, but if this is not considered, it can cause things that are vulnerable because of its very sensitive nature. The service system needs to be supported by quality services, adequate facilities, and ethics or manners. While the purpose of providing services is to provide satisfaction to consumers / customers so that the resulting added value for the company.
2. Literature Review 2.1 Service Quality
Service quality is defined as a comparison of expected service with services perceived by consumers both through information and customer experience received.
2.2 Dimensions of Service Quality
Parasuraman, Zeithaml, and Berry (1988) state that there are 10 categories of Service Quality. The 10 categories according to them could be overlapping because they build them through exploratory studies which in fact use a qualitative approach. After conducting a series of validity and reliability tests, five determinants were found as dimensions of service quality, namely:
1. Reliability, related to the company's ability to provide accurate services from the first time without any errors and to prepare services in accordance with the agreed time;
2. Responsiveness, with regard to the willingness and ability of employees to help consumers and respond to their requests, and inform when services will be provided and then provide services quickly.
3. Assurance, namely the behavior of employees is able to foster consumer confidence in the company and the company can create a sense of security for its customers. Guarantees also mean that employees are always polite and master the knowledge and skills needed to deal with any consumer questions or problems.
4. Empathy means that the company understands the problems of its customers and acts in the interests of consumers, and gives personal attention to consumers and has comfortable operating hours.
5. Tangibles, with regard to the attractiveness of the physical facilities of the equipment, and the materials used by the company, as well as the appearance of employees.
Other researchers, namely Groonroos (1990) determined 3 dimensions of service quality, namely: 1. Technical or outcome dimension, related to what consumers receive.
2. Functional or process-related dimension, relating to how the service is delivered or presented. 3. Corporate image, that is related to the corporate image of the consumer.
Fitzsimmons and Fitzsimmons (2011) also establish 4 dimensions of service quality, namely:
1. Care and concern, that is the feeling of the consumer for the full attention and concern of the company, employees and the operating system aimed at solving the problem at hand.
2. Spontaneity, that is real action from personnel who show a strong and spontaneous desire to help solve problems or difficulties faced by consumers.
3. Problem solving, namely the expertise of the contact person to carry out the task carefully and follow the standard procedures set.
4. Recovery, that is a special effort taken if something goes wrong or is not expected to occur. The dimensions used in this study are tangibles, reliability, responsiveness, assurance, and empathy. 2.1 Customer Value
Based on several theoretical foundations of customer value, it can be hypothesized that customer value is the overall assessment of the consumer's benefits of a product based on perceptions of what they have received and what they have given. Customer value can be measured by 3 indicators, namely: 1) Benefits comparable to the money spent, 2) The price is reasonable / reasonable, and 3) Purchases that are useful.
3. Research Method
This research is a quantitative study, the study population is consumers of Indomaret and Alfamart minimarkets in Bekasi. The sampling technique in this study used non probability sampling techniques, namely sampling techniques that provide equal opportunities for each element (member) of the population to be selected as sample members.
4. Analysis and Discussion 4.1 Validity Test
4.1.1 Validity Test at Alfa Midi
Table 4.1.1 Validity Test Results
Indicator r count r table Information
Tangible 1 .761 0,2732 Valid
Tangible 2 .668 0,2732 Valid
Tangible 3 .546 0,2732 Valid
Reliability 1 .524 0,2732 Valid
Reliability 2 .604 0,2732 Valid
Responsiveness 1 .459 0,2732 Valid
Responsiveness 2 .682 0,2732 Valid
Responsiveness 3 .518 0,2732 Valid
Assurance 1 .547 0,2732 Valid
Assurance 2 .593 0,2732 Valid
Assurance 3 .593 0,2732 Valid
Empathy 1 .538 0,2732 Valid
Empathy 2 .663 0,2732 Valid
Customer Value 1 .370 0,2732 Valid
Customer Value 2 .510 0,2732 Valid
Customer Value 3 .610 0,2732 Valid
Satisfaction 1 .831 0,2732 Valid
Satisfaction 2 .888 0,2732 Valid
Satisfaction 3 .823 0,2732 Valid
Satisfaction 4 .654 0,2732 Valid
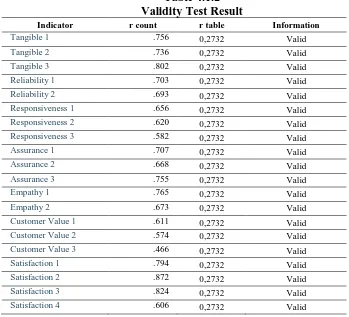
4.1.2 Validity Test at Indomaret
Validity and reliability test results are based on the calculation results Table 4.1.2
Validity Test Result
Indicator r count r table Information
Tangible 1 .756 0,2732 Valid
Tangible 2 .736 0,2732 Valid
Tangible 3 .802 0,2732 Valid
Reliability 1 .703 0,2732 Valid
Reliability 2 .693 0,2732 Valid
Responsiveness 1 .656 0,2732 Valid
Responsiveness 2 .620 0,2732 Valid
Responsiveness 3 .582 0,2732 Valid
Assurance 1 .707 0,2732 Valid
Assurance 2 .668 0,2732 Valid
Assurance 3 .755 0,2732 Valid
Empathy 1 .765 0,2732 Valid
Empathy 2 .673 0,2732 Valid
Customer Value 1 .611 0,2732 Valid
Customer Value 2 .574 0,2732 Valid
Customer Value 3 .466 0,2732 Valid
Satisfaction 1 .794 0,2732 Valid
Satisfaction 2 .872 0,2732 Valid
Satisfaction 3 .824 0,2732 Valid
4.2.Reliability Test Result
Reliability test carried out in this study the authors sought reliability using the Cronbach Alpha
technique. A variable is declared reliable if it produces a Cronbach Alpha value> 0.50 (Suyiono, 2014:87). In this study, we will see the results of Cronbach's Alpha for each variable in the questionnaire data that has been filled by 30 respondents.
Table 4.1.3 Reliability Test Result
No Variable Cronbach's
Alpha N of Item Information
1 Service Quality at Alfa 0,894 13 Reliable
2 Service Quality at
Indomaret 0,936 13 Reliable 3 Customer Value at Alfa 0,679 3 Reliable
4 Customer Value at Indo
Maret 0,730 3 Reliable
5 Satisfaction of Alfa 0,910 4 Reliable 6 Satisfaction of Indomaret 0,894 4 Reliable
Source: Processed Researchers, 2018
based on table 4.1.3 states that each dimension description has Cronbach Alpha> 0.50. That is, research on the statements of the above variables is stated to be reliable because it has a Cronbach Alpha value> 0.50.
4.3.Classic assumption test
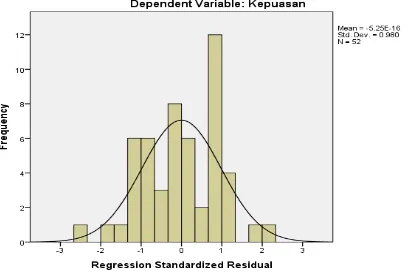
4.3.1 Normality Test at Alfa
Testing of the classic assumptions of normality aims to find out whether the data residuals from the linear regression model have a normal distribution or not. There are two ways to detect whether the residual data is normally distributed or not by looking at the normal probability plotline and the One-Sample Kolmogorov-Smirnov Test statistical test. If the normal probability line plot shows that the scattered points coincide around the diagonal line and in the direction of the diagonal line, this can be concluded that the residual data has a normal distribution or that the data meets the classical assumption of normality. Further in the Kolmogorop-Smirnov Test One-Sample test. If the significance value is more than 0.05, it can be concluded that the data is normally distributed (Latan and Temalagi, 2013: 56). Below are the results of the normality test:
The Histogram pattern appears to follow the normal curve, even though there are some data that appear outlier, but in general, the data distribution follows the normal curve, so it can be concluded that the data is normally distributed.
The Histogram pattern appears to follow the normal curve, even though there are some data that appear outlier, but in general, the data distribution follows the normal curve, so it can be concluded that the data is normally distributed.
4.3.3 Heteroscedasticity Test Results at Alfa
Heteroscedasticity Test Results at Alfa
Dari Hasil Gambar 4.3.3. terlihat bahwa Gambar scatterplot memiliki pola yang menyebar secara acak dan titik-titik menyebar diatas dan dibawah angka 0 pada sumbu Y, Hal ini Dapat disimpulkan bahwa model regresi linear berganda terbebas dari asumsi klasik heteroskedastisitas.
4.3.4 Heteroscedasticity Test Results at Indo Maret
Heteroscedasticity Test Results at Indomaret
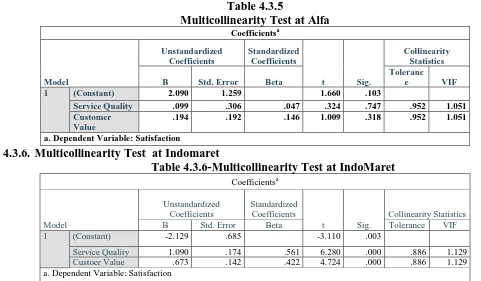
4.3.5. Multicollinearity Test at Alfa
The second classic assumption test is the multicollinearity test. Testing of the classic assumption of multicollinearity aims to determine whether or not there is a correlation between independent variables in the regression model. The classic multicollinearity assumption test can only be done if there is more than one independent variable in the regression. The general way used by researchers to detect the presence or absence of multicollinearity problems in the regression model is the value of Tolerance and VIP (Valiance Inflation Factor) the recommended value for the absence of multicollinearity problems is the Tolerance value must be> 0.10 and VIP value <10 (Hair et al. quoted by Latan and Temalangi, 2013: 63).
Table 4.3.5
Multicollinearity Test at Alfa Coefficientsa
Model
Unstandardized Coefficients
Standardized Coefficients
t Sig.
Collinearity Statistics
B Std. Error Beta
Toleranc
e VIF
1 (Constant) 2.090 1.259 1.660 .103
Service Quality .099 .306 .047 .324 .747 .952 1.051
Customer Value
.194 .192 .146 1.009 .318 .952 1.051
a. Dependent Variable: Satisfaction
4.3.6. Multicollinearity Test at Indomaret
Table 4.3.6-Multicollinearity Test at IndoMaret Coefficientsa
Model
Unstandardized Coefficients
Standardized Coefficients
t Sig.
Collinearity Statistics
B Std. Error Beta Tolerance VIF
1 (Constant) -2.129 .685 -3.110 .003
Service Quality 1.090 .174 .561 6.280 .000 .886 1.129
Custoer Value .673 .142 .422 4.724 .000 .886 1.129
a. Dependent Variable: Satisfaction
The second classic assumption test is the multicollinearity test. Testing of the classic assumption of multicollinearity aims to determine whether or not there is a correlation between independent variables in the regression model. The classic multicollinearity assumption test can only be done if there is more than one independent variable in the regression. The general way used by researchers to detect the presence or absence of multicollinearity problems in the regression model is the value of Tolerance and VIP (Valiance Inflation Factor) the recommended value for the absence of multicollinearity problems is the Tolerance value must be> 0.10 and VIP value <10 (Hair et al. quoted by Latan and Temalangi, 2013: 63).
4.4. T Test
4.4.1.T test at Alfamart
Analysis of the effect of service quality on customer satisfaction at Alfa
Coefficientsa
Model
Unstandardized Coefficients
Standardize d Coefficients
T Sig.
Collinearity Statistics
B Std. Error Beta
Toleranc
e VIF
1 (Constant) 2.537 1.179 2.152 .036
Service Quality
.167 .298 .079 .559 .579 1.000 1.000
Based on the results of the coefficients or t test results obtained t count of 0.036 with a significance level of 0.000. based on the results of coefficients stated that service quality has t count of 0.559> 0.05, this means that service quality affects customer satisfaction.
Analysis of the effect of customer value on customer satisfaction at alfamart Coefficientsa
Model
Unstandardized Coefficients
Standardize d Coefficients
T Sig.
Collinearity Statistics
B Std. Error Beta
Toleranc
e VIF
1 (Constant) 2.429 .694 3.501 .001
Customer Value
.208 .186 .156 1.118 .269 1.000 1.000
a. Dependent Variable: Satisfaction
Based on the results of the test coefficients or t test obtained t count of 3.501 with a significance level of 0.000. based on the results of coefficients stated that customer value has t count of 1.118> 0.05, this means that customer value affects customer satisfaction.
4.4.2 T Test at Indomaret
Analysis of the effect of service quality on customer satisfaction at Indomaret
Coefficientsa
Model
Unstandardized Coefficients
Standardized Coefficients
T Sig.
Collinearity Statistics
B Std. Error Beta Tolerance VIF
1 (Constant) -.847 .751 -1.129 .264
Service Quality 1.367 .195 .704 7.007 .000 1.000 1.000
a. Dependent Variable: Satisfaction
Based on the results of the test coefficients or t test obtained t count of -1.129 with a significance level of 0.000. based on the results of coefficients states that service quality has a t count of 7, 007> 0.05 this means that service quality affects customer satisfaction.
Analysis of the effect of customer value on customer satisfaction at Indomaret Coefficientsa
Model
Unstandardized Coefficients
Standardized Coefficients
t Sig.
Collinearity Statistics
B Std. Error Beta Tolerance VIF
1 (Constant) .964 .632 1.524 .134
Customer Value .975 .178 .612 5.469 .000 1.000 1.000
a. Dependent Variable: Satisfaction
Based on the test results of coefficients or t test obtained t count of 1.524 with a significance level of 0.000. based on the results of coefficients stated that customer value has t count of 5.469> 0.05 this means that customer value affects customer satisfaction.
4.5. Indepedent Test
Group Statistics
groups N Mean Std. Deviation Std. Error Mean Service Quality alfamart 52 3.9295 .41829 .05801
indomaret 52 3.7981 .61307 .08502
Independent Samples Test
Levene's Test for Equality of
Variances t-test for Equality of Means
F Sig. t df
Sig. (2-tailed) Mean Difference Std. Error Difference
95% Confidence Interval of the Difference
Lower Upper
Service Quality Equal variance s assumed
4.583 .035 1.277 102 .204 .13146 .10292 -.07268 .33560
Equal variance s not assumed
1.277 90.026 .205 .13146 .10292 -.07301 .33593
F test analysis
Hypothesis H0: Both population variances are homogeneous
Hypothesis H1: Both population variances are not equal (not homogeneous) Decision-making
If the probability value is> 0.05, then H0 is accepted If the probability value is <0.05, then H0 is rejected Decision:
It can be seen that F counts for the quality value of 4,583 with a probability of 0.035. Because the probability value is <0.05, H0 is rejected or the two population variances are not the same.
T Test Analysis Hypothesis
H0: Average - the quality value between Indomart and Alfamart is the same H1: The average quality value between Indomart and Alfamart is not the same Based on the probability value:
If the probability is> 0.05 then H0 is accepted If the probability is <0.05 then H0 is rejected
T count with a probability value of 1,277. Because probability> 0.05, H0 is accepted, it can be concluded that the average index of quality values between alpha and indomart is the same
Group Statistics
Groups N Mean Std. Deviation Std. Error Mean Customer Value Alfamart 52 3.6731 .66500 .09222
Indomaret 52 3.4679 .74757 .10367
The mean mean quality value for Alfamart is 3.6 with a standard deviation of 0.66 and the average value of Indomart quality is 3.4 with a standard deviation of 0.74
Independent Samples Test
Levene's Test for Equality of
Variances t-test for Equality of Means
F Sig. t df
Sig. (2-tailed) Mean Difference Std. Error Difference 95% Confidence Interval of the
Difference Lower Upper Custo mer Value Equal variances assumed
.751 .388 1.478 102 .142 .20513 .13875 -.07008 .48034
Equal variances not assumed
F test analysis
Hypothesis H0: Both population variances are homogeneous
Hypothesis H1: Both population variances are not equal (not homogeneous) Decision-making
If the probability value is> 0.05, then H0 is accepted If the probability value is <0.05, then H0 is rejected Decision:
It can be seen that the F count for customer value is 0.751 with probability 0.388. Because the probability value is> 0.05 then H0 is accepted or both population variances are the same
T Test Analysis Hypothesis
H0: The average value of the customer between Indomart and Alfamart is the same H1: The average customer value between Indomart and Alfamart is not the same Based on the probability value:
If the probability is> 0.05 then H0 is accepted If the probability is <0.05 then H0 is rejected
T count with a probability value of 1.478. Because probability> 0.05 then H0 is accepted, it can be concluded that the average customer value index between alpha and indomart is the same
Group Statistics
kelompok N Mean Std. Deviation Std. Error Mean
Satisfaction alfamart 52 3.1923 .88508 .12274
indomart 52 4.3462 1.19177 .16527
The mean mean quality value for Alfamart is 3.1 with a standard deviation of 0.88 and the average value of Indomaret quality is 4.3 with a standard deviation of 1.19
Independent Samples Test
Levene's Test for Equality of
Variances t-test for Equality of Means
F Sig. t df
Sig. (2-tailed
)
Mean Differenc
e
Std. Error Differenc
e
95% Confidence Interval of the
Difference Lower Upper Satisfacti
on
Equal variances assumed
2.990 .087 -5.605 102 .000 -1.15385 .20586 -1.56217 -.74552
Equal variances not assumed
-5.605 94.136 .000 -1.15385 .20586 -1.56258 -.74511
F test analysis
Hypothesis H0: Both population variances are homogeneous
Hypothesis H1: Both population variances are not equal (not homogeneous) Decision-making
If the probability value is> 0.05, then H0 is accepted If the probability value is <0.05, then H0 is rejected Decision:
T Test Analysis Hypothesis
H0: Average - the average customer satisfaction between Indomart and Alfamart is the same H1: The average customer satisfaction between Indomart and Alfamart is not the same Based on the probability value:
If the probability is> 0.05 then H0 is accepted If the probability is <0.05 then H0 is rejected
T count with a probability value of -5,605. Because probability> 0.05 then H0 is accepted, it can be concluded that the average customer value index between alpha and indomart is the same
4.6. Mean
The mean value of Alfamart and Indomaret
No Information Alfamart Indomaret Conclution
1 Appearance clerk who was dressed neatly minimarket 3,8 3,6 Alfa>Indo
2 This minimarket neatly 3,7 3,5 Alfa>Indo
3 The equipment used for transactions at the minimarket has met the needs
3,9 3,9 Alfa=Indo
4 Officers in this minimarket have the ability to serve 4,1 4,1 Alfa=Indo 5 Officers at the minimarket are willing to provide answers
in accordance with applicable regulations
3,8 3,8 Alfa=Indo
6 This Mini Market provides good service 3,7 3,7 Alfa=Indo 7 This Mini Market opens a shop on time 3,7 3,6 Alfa>Indo 8 The officers in the minimarket are responsive to consumer
questions
3,9 3,6 Alfa>Indo 9 Officers in the minimarket are polite in serving consumers 3,7 3,5 Alfa>Indo 10 Officers in the minimarket are friendly in serving
consumers
4,0 3,7 Alfa>Indo 11 Officers in the minimarket are able to communicate well 3,9 3,6 Alfa>Indo 12 Officers at the minimarket have a sensitivity to the
problems faced by consumers when shopping
3,4 3,5 Alfa<Indo 13 Officers at the minimarket have concerns about the
problems faced by consumers
3,5 3,8 Alfa<Indo 14 This mini market sells quality product products in
accordance with the value that I spend
3,5 3,3 Alfa>Indo 15 Shopping at this minimarket provides added value
compared to other minimarkets
3,6 3,4 Alfa>Indo 16 Shopping at this mini-market is cheaper than other
minimarkets
3,4 3,4 Alfa=Indo
17 The price offered with the value issued at this minimarket is as expected
3,1 2,9 Alfa>Indo 18 The services offered at this minimarket are as expected 3,1 3,1 Alfa=Indo 19 Products offered at this minimarket are quality 3,1 3,1 Alfa=Indo 20 This mini market is a quality minimarket 3,2 3,5 Alfa<Indo 4.7. Discussion
1. Based on the average value obtained for the appearance of the minimarket attendant who is well-dressed and this Minimarket is neatly arranged Alfamart is higher meaning neatly both the officer and the arrangement are neater.
2. The equipment used for the minimarket transaction has met the needs, the existing minimarket officer has the ability to serve, the minimarket existing officer is willing to provide answers in accordance with the applicable provisions, this mini Market provides good service, between Indomaret and alfamart has a service the same one.
3. This Mini Market opens the shop on time. The officer who is minimized is responsive to consumer questions. The officer who is minimized is friendly in serving consumers. The official who is in the market is able to communicate well, the service at Alfamart has a higher average value.
4. This minimized market officer has a sensitivity to the problems faced by consumers when shopping, the officers in this minimarket have concerns about the problems faced by consumers, this mini market is a quality minimarket at Alfamart which has a lower value than at Indomaret.
1. The price of goods in Alfamart tends to be expensive because the items are purchased from the distributor. While the prices offered in Indomaret tend to be cheaper because the goods sold in Indomaret are obtained directly from the manufacturer.
2. The buyers are more likely to shop at Indomaret, because the services provided tend to be better. Whereas if we shop at Alfamart, the service provided is not good.
3. Promotion carried out by Alfamart to the community is more effective and fast, while promotions carried out in Indomaret tend to be slow.
4. Indomaret have an ATM machine so that many people and students who want to make money will go to Indomaret and sometimes shop there so that they can more efficiently time and energy. Whereas in Alfamart there is no ATM machine.
5. Alfamart has CCTV, while Indomaret does not have CCTV, so the level of supervision in Inodmaret is lacking.
6. Indomaret is wider than Alfamart.
7. Availability of products between the two minimarkets is quite balanced. Many and varied. In Indonesia, there are fewer brands of ice cream that are sold while if we shop at Alfamart sell various brands of ice cream.
8. Alfamart is equipped with facilities in the form of mirrors, so customers can reflect as they please. While Indomaret does not have a mirror.
9. Indomaret has facilities such as television and music, so we can watch how Indomaret services while in Alfamart only in the form of music.
10.Arranging shelves in Indomaret shorter than Alfamart Alfamart comes with a convience store but in small amounts
11.Indomaret also won because it has been innovating with Indomaret plus and points with many locations accompanied by a wider, medium location seat, from its own layout sector I am somewhat less interested in alpha ex: for the arrangement of gallon water in alpha not provided where the gallon is stacked, indomaret is more organized
5. Conclusion
1. Based on the test results of the coefficients or t test obtained t count equal to 0.036 with a significance level of 0.000. based on the results of coefficients stated that service quality has t count of 0.559> 0.05, this means that service quality affects customer satisfaction.
2. Based on the test results of the coefficients or t test obtained t count of 3.501 with a significance level of 0.000. based on the results of coefficients stated that customer value has t count of 1.118> 0.05, this means that customer value affects customer satisfaction
3. Based on the test results of the coefficients or t test obtained t count of -1.129 with a significance level of 0.000. based on the results of coefficients states that service quality has at the count of 7, 007> 0.05 this means that service quality affects customer satisfaction.
4. Based on the test results of the coefficients or t test obtained t count of 1.524 with a significance level of 0.000. based on the results of coefficients stated that customer value has t count of 5.469> 0.05 this means that customer value affects customer satisfaction.
5. The median quality of services provided by Alfamart is slower than the median quality of services provided by Indomaret
6. The median customer value given Alfamart is smaller than the median value of the customer given by Indomaret
7. Median customer satisfaction perceived by Alfamart customers is greater than the median customer satisfaction given by Indomaret
i. Atalik O., and Arslan M. 2007. A study to Determine the Effects of Customer value on Customer Loyalty in Airline Companies operating: Case of Turkish Air Travelers. International Journal of Business and Management, Vol.4 No.6, pp.154-162.
ii. Abd-El-Salam, Eman Mohamed, Ayman Yehia Shawky and Tawfik El-Nahas, 2013, The impact of corporate citra and reputation on service quality, customer satisfaction and customer loyalty: testing the mediating role. Case analysis in an international service company, The Business & Management Review, Vol.3 Number-2, January 2013
iii. Amin, Muslim and Siti Zahora Nasharuddin, 2013, Hospital service quality and its effects on patient satisfaction and behavioural intention, Clinical Governance: An International. Journal Vol. 18 No. 3, 2013 pp. 238-254 q Emerald Group Publishing Limited 1477-7274. DOI 10.1108/CGIJ-05-2012-0016
iv. Aljoudimi, Yousf Ibrahim and Ismail B. Rejab, Zulkifflee Bin Mohamed. Service Quality toward Patient Satisfaction the Moderating Role of Time and Efforts in Public Hospitals in Tripoli, Libya International Journal of Managerial Studies and Research (IJMSR)Volume 3, Issue 6, June 2015, PP 97-116, ISSN 2349-0330 (Print) & ISSN 2349-0349 (Online), www.arcjournals.org
v. Allahham, Anas. Determinants of Customer Satisfaction in Healthcare Services International Journal of Business and Management Invention ISSN (Online): 2319 – 8028, ISSN (Print): 2319 – 801X www.ijbmi.org Volume 2 Issue 12ǁ December. 2013ǁ PP.59-63
vi. Bateson,Hoffman (2011). Service Marketing, edisi 4e, International Edition South-Western Cengage
Learning.
vii. Booms B.H. and Bitner B.J. 1980. Marketing Strategies and Organiation Structures for Service Firms.
viii. Choi, Eun, Jung., and Kim, Soo-Hyun. 2013. The Study of the Impact of Perceived Quality and Value of Social Enterprises on Customer Satisfaction and Re-Purchase Intention. Journal of Smart Home, Vol. 7, No.1.
ix. Cronin, Jr., J., Brady, M.K., Hult, G., and Tomas, M. 2000. Assessing the Effect of Quality, Value and Customer Satisfaction on Consumer Behavioral Intentions in Service Environment. Journal of Retailing, 76 (2): 193-218.
x. Engel, James et al.2006. Consumer Behaviour. Mason: Permissions Department, Thomson Business and Economics.
xi. Fitzsimmons,James A dan Mona J Fitzsimmons, (2011), Service management : operations, strategy, information technology, New York : McGraw-Hill
xii. Griffin, Jill. 2005. Customer loyalty : Menumbuhkan dan mempertahankan Pelanggan. Jakarta : Erlangga.[Customer loyalty: Grow and retain customers. Jakarta: Erlangga.
xiii. Gale, B.T. 1994. Managing Customer Value Creating quality and service that customers can see. New York: The Free Press.
xiv. Hultman, C, and Shaw, E (2003) The interface between transactional and relational orientation in small service firm’s marketing behaviour. Journal of marketing : Theory and Practice, 11 (1) ISSN 1069-6679
xv. Ham, Hye-sook et al, Predictors of Patient Satisfaction with Tertiary Hospitals in Korea, Hindawi Publishing Corporation Nursing Research and Practice Volume 2015, Article ID 749754, 6 pages xvi. Hume, Margee, and Mort, Gillian Sullivan. 2010. The Consequence of Appraisal Emotion, Service
Quality, Perceived Value and Customer Satisfaction on Repurchase Intent in the Performing Arts. Journal of Service Marketing, Vol. 24, No. 2, pp: 170-182.
xvii. Kotler, P And Keller K. L. 2012. Marketing Management. Twelfth Edition. Singapore: Perason Education International
xix. Khan, Nasreen., dan Kadir, Sharifah, Latifah, Syed A. 2011. The impact of perceived value dimension on satisfaction and behavior intention: Young-adult consumers in banking industry. Journal of Business Management Vol.5 (11), pp. 4087-4099.
xx. Lovelock, Christopher H. 2001. Services Mareketing; People, Technology, Stratrgy. Fourth Edition. xxi. Lin, Chia C. 2003. The Role of Customer Perceived Value in Generating Customer Satisfaction: An
E-Bussiness Perspective. Journal of Research in Marketing & Entrepreneurship, Vol. 5, No. 1, pp. 25-39.
xxii. Mowen, John C. and Michael S. Minor.2002. Perilaku Konsumen. [Consumer behavior]. Jakarta: Erlangga
xxiii. Mc.Kechnie, Sally, 2012. Consumer Buying behaviour in Financial Service: an Overview. North Carolina: University of North Carolina.
xxiv. Nigam, A. (2011) Experiental Marketing : Changing Paradigm for marketers, International Journal of Computer Science and Management Studies, 11(2):200-204
xxv. Novianti, Endri, dan Darlius (2018). Kepuasan Pelanggan Memediasi Pengaruh Kualitas Pelayanan dan
Promosi Terhadap Loyalitas Pelanggan, MIX: Jurnal Ilmiah Manajemen, 8(1): 90-108
xxvi. Payne, A., Storbacka, K., Frow, P., Knox ,.S (2008) Co-creating Brands: Diagnosing and Designing the relationship experience , Journal of Business Research, 62(3), 379-389
xxvii. Parasuraman, A., Zeithaml, V.A. and Berry, L.L. (1988), "SERVQUAL: a multi-item scale for measuring consumer perceptions of the service quality", Journal of Retailing, Vol. 64, No. 1, pp. 12-40.
xxviii. Plunkett , Warren R; Raymond F. Attner, Introduction to Management, 1993, , Published by South-Western Educational Publishing,ISBN 10: 0534933211
xxix. Raymond P, Stephen J. Grove. 2014, Service Marketing an interactive approach. Fourth Edition. South Western. Cengage Learning
xxx. Schiffman , Leon G. Joseph L Wisenblit. Consumer Behaviour. Eleventh Ed. Pearson : 2015.
xxxi. Sekar, M., Kalakumari, T, (2011) Experiential Marketing – Conecting Customers with Brands , Golden Research Thoughts, 1(3), 1-4
xxxii. Sweeney, J.C., and Soutar, G.N. 2001. Consumer Perceived Value: The Development of A Multiple item Scale. Journal of Retailing, Vol. 77, No. 2, pp. 203-220.
xxxiii. Zeithaml , Valarie, Mary Jo Bitner , (2009). Services Marketing , McGraw-Hill Education