Water Table Contribution to Faba Bean Water Use
Shereen A. Hamed,* E. M. A. El-Toni**, E.M. Khaled** and S. E. Heggy *
*Department of Physics and Soil Chemistry, Soil, Water and
Environment Research Institute, Agricultural Research Center , Giza, and **Soils Department, Faculty of Agriculture, Ain Shams University, Cairo, Egypt.
YSIMETER experiment on sandy loam soil was conducted to estimate the contribution of water table to meet the water requirements of Faba bean (Vicia faba L.). The lysimeters were connected to a tank with Marriotte siphon and a piezometer to maintain the water table level (WT) at the desired depths, which consisted of 50, 70 and 90 cm from the soil surface. The results of this study showed that there is no high difference between the values of actual evapotranspiration (Eta) for this crop under the three levels of
WT. It slightly increased with increasing water table depth. As well as, 70 cm WT treatment showed that it can be consider suitable conditions. At this level, the amount of water was meet the requirements of crop which cause a significant high values of its water use efficiency (WUE) and water economy (WE) and also a maximum grain yield. Compared to a high WT level 50 cm or a deep WT level 90 cm where, the crop depends basically on the water irrigation requirements.
Keywords: Water table contribution, Crop water requirements, Faba bean.
Faba bean (Vicia faba L.) is one of the most important pulse crops grown for seed in Egypt, being cultivated from the North to the Deep South. Due its high nutritive value, it is a primary source of protein in the diet of masses. The average cultivated areas are 69720 ha, with an average yield of 1896 kg/ha (AOAD, 2007). On the other side, seed yield and biomass of faba bean were highly dependent on the amount of water availability and its use efficiency (Mohamad and Dennet, 2010). Along with this fact, shallow water table areas in Egypt are likely to increase which created by indiscriminate use of irrigation water. Non functional drainage systems and also seepage from rice fields thus can result in further water table rise leading to water logging and secondary salinity problems, which are the potentially serious problems for the agricultural industry. Because of the negative impact of water table on crop yield and long-term impact on agricultural productivity; they can reduce the potential yield by 30-80 percent for many crops (McFarlane and Williamson, 2002).
On the other hand, upflow from shallow water tables can be a significant component in the root zone water balance of cropping systems and has been a topic of extensive research in the last few decades. Groundwater can contribute significantly to crop water needs and therefore reduce applied irrigation. It could also be used as sub-irrigation by adopting proper irrigation scheduling to
help bridge the gap between water demand and supply (Kahlown et al., 2005).
Reduced irrigation above shallow water tables not only results in more efficient use of water resources, but also lowers the risk of water logging and nutrient losses below the root zone. Therefore the aim of this experiment was to investigate the optimum utilization of water for faba bean crop under different three water table levels using lysimeter experiment.
Material and Methods
A lysimeter experiment was carried out in eighteen double walls concrete lysimeters of the size 1.25 m × 1.25 m in area and 1.25 m depth using the cultivar Faba bean (Vicia faba L.) as test plant. Each lysimeter consisted of a drain and a water feeding tubes from the bottom of the lysimeter to control the WT depths through a daily supplying of a tap water to saturate the soil up to the agreement levels under low pressure. A tank with Marriotte siphons and piezometer were connected to each lysimeter to maintain the WT at the desired levels where represent, 50, 70 and 90 cm from the soil surface. The amount of water used to raise a water table were monitored by the daily loss of water from the Marriotte siphon which, measured by water flow meters. In the same time, the excess amount of water percolated into the WT was measured through storage bottles attached to the bottom of each lysimeter, and the difference between them represent a water use from the water table. The soil and that the different lysimeters had similar properties of sandy loam texture extending from surface to 60 cm depth. Some physical and chemical properties of the investigated soil are shown in Tables 1 and 2.
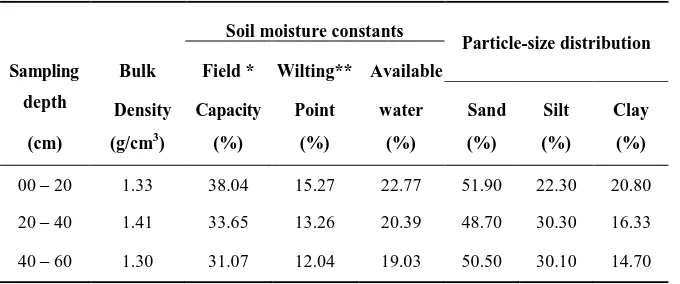
TABLE 1. Some physical properties of the soil .
Soil moisture constants
Particle-size distribution Sampling Bulk Field * Wilting** Available
depth
Density Capacity Point water Sand Silt Clay
(cm) (g/cm3) (%) (%) (%) (%) (%) (%)
00 – 20 1.33 38.04 15.27 22.77 51.90 22.30 20.80
20 – 40 1.41 33.65 13.26 20.39 48.70 30.30 16.33
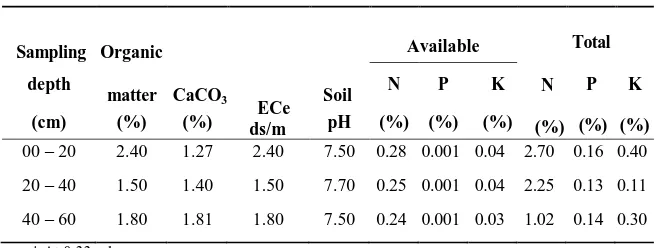
TABLE 2. Some chemical properties of the soil .
* At 0.33 mbar . ** At 15 mbar .
Faba bean (Vicia faba L.) variety Giza 843 was cultivated in 17th Nov., 2010 with 20 cm planting distances and 30 cm between rows, so, there were 24 plants in each lysimeter to record its relative dry grain yield as (g/plant). The experimental plants were fertilized before sowing according to the recommendation of the Ministry of Agriculture, and irrigated by drip irrigation system to meet the field capacity of the crop
for each treatment (liter/period) by using graduated cylinder. At the
cultivate site, the meteorological data were recorded regularly to
calculate the Eto by modified penman equation (mm/day). In the same
time, The TDR was used to measure water content after and before irrigation from 00-20, 20-40 and 40-60cm depths of the surface to calculate the water use from irrigation. A summation of water use from
water table and water use from irrigation take as an actual
evapotranspiration (Eta). The treatments were arranged in a complete
randomized plot design with three replicates and the results were statistically analyzed using F-value test and the means were compared by the L.S.D at the level of 5% probability. MSTATC was the computer program that used to calculate the obtained results and statistical analysis.
Results and Discution
Climatic conditions and reference evapotranspiration (Eto)
Values of (Eto) were fluctuated following the changes in the
climatologically norms during the growth season as shown in Table 3. Generally, they increased at the end of the growth season at the period (09 Apr. to 15 May, 2010). This finding is mainly due to the relatively high temperature, average of wind (km/d), the gradually increase of sun shine and the low relative humidity at the end of the season. These results confirmed
with the findings of Abo-Hadid et al. (1988) and El-Naggar (1997).
ECe ds/m
N (%)
Total P (%)
K (%) Sampling Organic
CaCO3
Available depth
matter Soil N P K
(cm) (%) (%) pH (%) (%) (%)
00 – 20 2.40 1.27 2.40 7.50 0.28 0.001 0.04 2.70 0.16 0.40
20 – 40 1.50 1.40 1.50 7.70 0.25 0.001 0.04 2.25 0.13 0.11
TABLE 3. Weekly meteorological data and reference evapotranspiration (Eto) in
Faculty of Agriculture, Ain Shams University site during faba bean season of 2009-2010.
Period Air Temp C° Ave.
Rh % Ave. Wind (km/d)
Sun Shine (h)
Eto
mm/day Max. Min. Ave.
21 Nov. - 28 Nov. 23.0 10.7 16.9 71.1 157.7 10.3 2.8
29 Nov. - 05 Dec. 22.3 11.1 16.7 75.1 147.4 10.2 2.2
06 Dec. - 12 Dec. 21.4 10.4 15.9 61.1 229.7 10.1 2.7
13 Dec. - 19 Dec. 20.3 10.1 15.2 64.0 267.4 10.0 3.0
20 Dec. - 26 Dec. 22.6 10.9 16.7 57.3 435.4 10.0 4.0
27 Dec. - 02 Jan. 20.7 8.4 14.6 76.1 157.7 10.0 2.0
03 Jan. - 09 Jan. 18.5 9.8 14.2 66.9 186.1 10.1 2.4
10 Jan. - 16 Jan. 19.6 10.0 14.8 56.6 154.3 10.1 2.2
17 Jan. - 23 Jan. 21.0 11.3 16.1 55.4 174.9 10.2 2.9
24 Jan. - 30 Jan. 20.6 12.6 16.6 49.9 212.6 10.3 2.8
31 Jan. - 06 Feb. 20.1 12.7 16.4 43.6 260.6 10.4 4.0
07 Feb. - 13 Feb. 23.9 11.9 17.9 49.4 168.0 10.6 3.2
14 Feb. - 20 Feb. 21.4 13.4 17.4 42.3 346.3 10.8 5.1
21 Feb. - 27 Feb. 19.3 11.6 15.4 47.3 305.1 11.0 4.3
28 Feb. - 06 Mar. 19.1 11.0 15.1 48.0 329.1 11.2 4.2
07 Mar. - 13 Mar. 25.4 14.4 19.9 37.6 246.9 11.4 5.7
14 Mar. - 20 Mar. 25.4 14.4 19.9 37.6 246.9 11.4 4.6
21 Mar. - 27 Mar. 21.3 10.9 16.1 52.4 253.7 11.9 4.6
28 Mar. - 03 Apr. 22.0 12.3 17.1 47.3 264.0 12.1 5.1
04 Apr. - 10 Apr. 26.6 14.9 20.7 51.9 164.6 12.3 5.1
11 Apr. - 17 Apr. 26.0 15.6 20.8 50.3 243.4 12.6 5.6
18 Apr. - 24 Apr. 28.4 16.3 22.4 45.9 298.3 12.8 6.8
25 Apr. - 01 May. 28.4 16.7 22.6 50.3 318.3 13.0 7.4
02 Apr. - 08 May. 27.9 16.9 22.4 46.1 336.0 13.2 7.0
09 Apr. - 15 May. 26.4 14.0 20.2 48.6 356.6 13.4 7.8
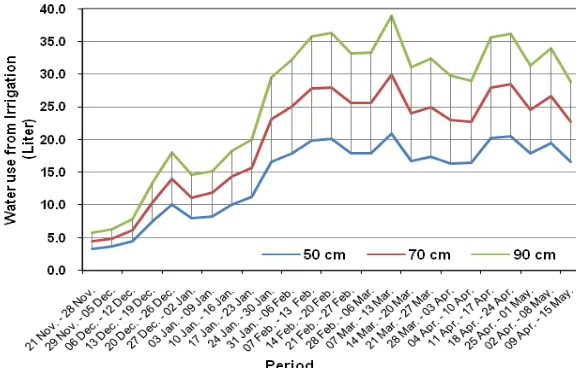
Water use from water table
Fig. 1 . Water use from water table (liter/period) for Faba Bean crop under different WT levels.
Water use from irrigation water
The irrigation requirements are minimum at 50 cm WT and increase with increasing the water table depth to meet the field capacity of the soil (Fig.2). This is mainly due to the fact that, water table contributions are higher with decreasing WT depth, which consequently reduces the irrigation requirements. These results are consistent with the finding of Kahlown et al. (2005).
Actual evapotranspiration (Eta)
It is clear to notice that the trend of (Eta) for the three WT levelis varied from
period to another depending on the change in climatic conditions (air temperature, relative humidity and solar radiation) and plant growth stage (Fig. 3). Generally, the values at the initial stage are low, because the growth of the plants is still small and it doesn't cover most of soil surface, so most of irrigation water evaporated from the soil surface only. The evaporation represents 90% of the consumptive use in this stage (Allen et al., 1998). Values of Eta increase at the
late stage where the plants are developed and reach their maximum peak at April and May because the plants in this stage reach their maximum height, leaf area, number of leaves and number of branches. Then Eta values decline as the crop
becomes mature this is mainly due to the fall down of most leaves of the plants which cause reduction of water transpiration. This trend is in agreement the results obtained by Doorenbous and Pruitt (1984) and El-Nagar (1997). On the other hand, the variation in the climatic conditions during the season affects either the transpiration or the duration of the total growing period and the various growth stages during the growth season. In a cool climate a certain crop will grow slower than in a warm climate.
Effect of water table levels on actual evapotranspiration (Eta)
The obtained results of Eta (Fig.3) show that, there is no high difference in Eta
values between the levels of WT. It slightly increases with increasing water table depth. The highest Eta value is obtained at 90 cm WT depth, where the water
table is supplying little water and the crop depends basically on the water irrigation requirements. This result probably is due to that, the crop was irrigated more frequently. Consequently, a wet surface evaporates water rapidly and a high consumption of water by crop because of an overestimation of water transpired by the crop. These due to that, under high soil water conditions the water used by the crop exceeds the need of the crop itself (‘luxury consumption’). These finding agrees with that obtained by Kahlown et al. (2005) and Cosentino et al. (2007). Comparatively with WT levels (50 and 70 cm WT), the evaporation from the soil surface decreases slightly and ET deceases consequently. Concerning the trend of slightly higher ET from 50 cm to 70 cm water tables, may be due to the highly development of vegetative growth of faba bean plants under 70 cm WT treatment which reflects their high transpiration and consumptive use of water.
Crop coefficient (Kc) of faba bean plant
One should bear in mind, that the values of Kc are a result of dividing the
weekly value of (Eta) under different WT levels by the value of the weekly
reference evapotranspiration (Eto) calculated by modified penman equation as
shown in Fig.4. The expected values of Kc would follow the same behavior of Eta
Fig. 3. Actual evapotranspiration (Eta) for Faba Bean crop under different levels of WT.
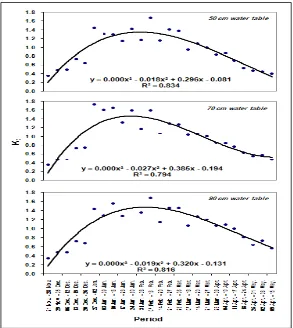
Effect of water table levels on the (Kc) values
The values of Kc for faba bean are increased with increasing water table
depth (Fig.4). On the other hand, the highest values of Kc are observed at the
with the findings of Sammis et al. (1982) and El-Naggar (1997). In other words, the crop coefficient values are highly affected by soil water stress, where the values of crop coefficient are decreased with increasing soil water stress. These are mainly due to the effect of soil water stress on plant physiological state.
Considering is the effect of plant growth stages on crop coefficient, data illustrated in Fig. 4 represent the third order polynomial regression equations and the coefficients of determination (R2) to describe the relation between the values of crop coefficient and different periods through the growth stage. It is observed that the obtained regression equations can be used to predict the crop coefficient values at any period of growth stage and in the regions having similar climatic conditions. Moreover, we can predict Kc values under different levels water table
by using modified penman equation. In other words, these equations could be used in irrigation scheduling programs under the similar conditions.
Fig. 4. Crop coefficient (Kc) for faba bean crop under different WT levels .
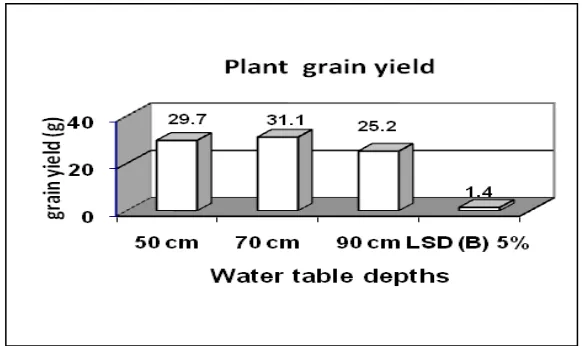
Data illustrated in Fig. 5 show that, there are significant differences in the grain yield of faba bean crop in the WT levels under studying. The highest value is found at 70 cm WT followed by 50 cm WT then 90cm WT. It is clear that supplying faba bean crop with adequate water accelerate the physiological processes and favors the mineral uptake and translocation of metabolizes, which in turn increases the total grain yield. As well as, increasing the water causes unsuitable conditions of aeration to the respiration of plant root. On the other hand, the insufficient water supply to a crop during critical stages of growth causes substantial yield loss. (Attia, 2013) reported that, pod development and seed filling stages were the most droughts sensitive. These results are agreed with Kamal et al. (2012) who indicated that Faba bean is more sensitive to drought than some other seed legumes and the physiological processes associated with drought tolerance are less understood than for other crop species .
Fig. 5. Grain yield of faba bean crop under different water table levels treatments.
Water use efficiency (WUE) of faba bean crop
Efficient use of water is becoming increasingly important, and using a suitable amount of water may contribute substantially to the best use of water for crops and improving irrigation efficiency. This improving is attributed to consumption adequate and suitable amount of water to meet a high production. Data in Fig. 6 show a significant differences between the values of water use efficiency under different WT levels. The highest value of water use efficiency is obtained under 70 cm WT, while the lowest one are found at 90 cm WT level, while 50 cm WT is in between of them. The lowest value of WUE is considered at 90 cm WT, where the crop depends basically on the water irrigation requirements. Under high soil water conditions, the water used by the crop exceeds the need of the crop itself (‘luxury consumption’), but it doesn’t give the maximum yield. And this could explain the corresponding WUE. This result agrees with that obtained
by Cosentino et al. (2007). However, the highest WUE at 70 cm WT may be due
gas exchange and transpiration water loss reduce their opening according to the available amount of water in the soil (Davies and Zhang, 1991 and Tardieu &
Davies, 1993). On the other hand, 50 cm WT gives low WUE and this is probably
due to the crop yield is reduced.
Fig. 6. Water use efficiency (WUE) of faba bean crop under different WT levels.
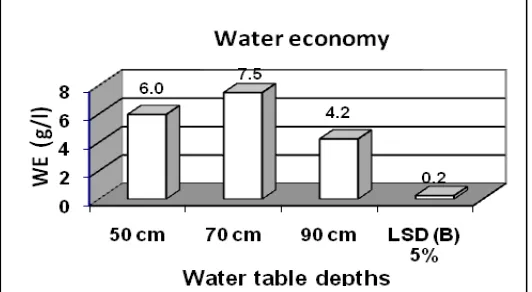
Water economy (WE) for of faba bean
The national aim in old or in new lands in Egypt is increasing the yield per unit of consumed water. Economy of water is used to evaluate the economy of irrigation practices for maximum utilization of water supplies. Data show a significant effect of contribution of WT levels on WE for crop (Fig.7). The highest value is obtained at 70 cm WT; this may be due to that, suitable amount of water added can gain a maximum grain yield automatically increases crop production per unit of water used.
Fig. 7. Water economy (WE) of faba bean crop under different WT levels.
Water table contribution is a significant component of water balance and should be recognized as providing part of the water needed by the crop for evapotranspiration. This will save water and energy and will also reduce the drainage effluent and help to keep the water table at the desired depth.
References
Abo-Hadid, A. F., El-Beltagy, A. S. and El-Said, H. M. (1988) Potential evapotanspiration for different regions and water consumptive use patterns under plastic house conditions . Egypt. J. Hort.15: 1-12.
Allen, R.G., Pereira, L.S., Raes, D. and Smith, M. (1998) Crop evapotranspiration: Guidelines for computing crop water requirements. Irrigation and Drainage, Paper No. 56. FAO, Rome, Italy, 300 p.
AOAD (2007) Arab Agriculture Statistics Year Book, 27. Arab Organization for Agricultural Development. Khartoum, Sudan.
Attia, M. A. (2013)Effect of Supplementary Irrigation Schedules and Bio-Fertilization on Yield and Yield Attributes of Faba Bean (Vicia fabaL.) and Lentil (Lens culinaris L.), under rainfed conditions. Alex. J. Agric. Res.58: (1): 39-46.
Cosentino, S. L., Cristina, P., Emanuele, S., Venera, C. and Salvatore, F. (2007) Effects of soil water content and nitrogen supply on the productivity of Miscanthus × giganteus Greef et Deu. In a Mediterranean environment. Industrial Crops and Products 25 (1): 75-88
Davies, W.J. and Zhang, J. (1991) Root signals and the regulation of growth and development of plants in drying soil. Ann. Rev. Plant Physiol. Plant Molecular Biol.42: 55–76.
Doorenbos, J. and Pruitt, W. O. (1984) Guidelines for predicting crop water requirements. Irrigation and Drainage, (24), FAO, Roma, Italy.
El-Naggar, E. M. (1997) Consumptive use under drip irrigation system. M. Sc. Thesis, Fac. Agric., Ain-shams Univ., Cairo, Egypt. El-Toni.
Kahlown, M.A., Ashraf, M. and Zia-ul-Haq. (2005) Effect of shallow groundwater table on crop water requirements and crop yields. Agricultural Water Management76: 24-35. Kamal, F.A., El Absawy, E.A. and Zakaria, A. M. (2012) Drought stress tolerance of
faba bean as studied by morphological traits and seed storage protein pattern. Journal of Plant Studies1 (2).
Mohamad, A.G. and Dennet, M.D. (2010) Responses of faba bean (Vicia faba L. cv Maris Bead) to different levels of plant available water. II. Yield, water use and water use efficiency. J. Trop. Agric. and Fd. Sc. 38(2): 145–152.
Sammis, T. W., Gregory, E. J. and Kaillsen, C. E. (1982) Estimating evapotranspiration with water production by the Blany-Criddle method. Transaction of ASAE 25(6): 1656-1661.
Tardieu, F. and Davies, W. J. (1993) Integration of hydraulic and chemical signaling in the control of stomatal conductance and water status of droughted plants. Plant, Cell Environ.16: 341–349.
(Received 27/11/2013; accepted 19/11/2014)
ا كلاهتسلأل ىضرلأا ءاملا ةمهاسم ىدم
ىلعفلا ىئامل
ىدلبلا لوفلا لوصحمل
يريش
ــ
دماح دمحا ن
*’
نوتلا
ــ
محم ى
ـ
لعد
ـ
نوتلا ى
ـ
ى
**’
يع
ـ
لاخ ىسرم د
ـد
**
و
ىجح ديسلا ديعس
**
ىضارلاا ءايميكو اقيزيفلا مسق −
دهعم ثوحب ةئيبلاو هايملاو ىضارلاا − زكرم ةيعارزلا ثوحبلا − و ةزيجلا ** ىضارلاا مسق − ةعارزلا ةيلك − ةعماج سمش نيع − ةرهاقلا − رصم .
رتموزيل ةبرجت تميقأ ىضرلأا ءاملا ةمهاسم ىدم ريدقتل هييمط هيلمر ضرأ ىف
ءاملا نم ىدلبلا لوفلا تاجايتحا دسل .
ىلع ىوتحي نازخب رتموزيلا ليصوت مت دقو
ىوتسملل ىضرلأا ءاملا ىوتسم ىلع ظافحلل رتموزيبب اضيأ لصتاو نوفيس ماظن وهو بولطملا 05 و 05 و 05 ةبرتلا حطس نم مس .
ا جئاتنلا ترهظأ دقو نكي مل هن
ثلاثلا ريثأت تحت لوصحملا اذهل ىئاملا كلاهتسلاا ميق نيب ريبك فلاتخأ كانه ىضرلاا ءاملا نم تايوتسم .
عم ىئاملا كلاهتسلاا ميق ىف هفيفط هدايز كانه ناكو
ىضرلأا ءاملا قمع ةدايز .
ةلماعم فورظ نا لوقلا نكمي كلذ نم مغرلا ىلعو
قمع 05 أ تناك ىضرلأا ءاملا نم مس تاجايتحا دسل همهاسم رثكاو ةمئلام رثك
ءاملا نم ىدلبلا لوفلا .
مادختسأ ةءافكل ةبسنلاب ميق ىلعأ هلماعملا هذه تطعأ دقو
ةنراقم بوبح لوصحم ىلعأ ىلا ةفاضلااب هايملا تايداصتقلا اضياو ءاملا ىضرأ ءام ىوتسم ىلعأ ءاوس ىرخلاا تايوتسملاب 05
ءام ىوتسم لقأ وأ مس