Apolipoprotein E Polymorphism in an Iranian
Hypercholestrolemic Population
Mohammad H. Hedayati
1and Abbas Samadi
*21
Dept. of Biochemistry, Pasteur Institute of Iran, Tehran, Iran;2Dept. of Biochemistry, Kirksville College of Osteopathic Medicine, 800W. Jefferson St., Kirksville, MO. 63501, USA
ABSTRACT
Apolipoprotein E (apo E) is a structural constituent of several serum lipoprotein classes. It plays an important role in lipid metabolism by acting as a ligand for low-density lipoprotein (LDL) and chylomicron remnant receptors. Three common alleles called2,3 and4 have been described, which code for three protein isoforms (E2, E3 and E4). The polymorphism is clinically significant, and it has therefore become very important in epidemiological studies attempting to obtain complete information about apo E allele frequencies in populations around the world. In the present study, two point mutations coding amino acid residues 112 and 158 were amplified using the polymerase chain reaction (PCR) from DNA extracted from 100 Iranian subjects. Apo E genotypes were determined by restriction fragment length polymorphism (RFLP) and allelic frequencies were estimated by gene counting (2 = 0.01, 3 = 0.88, 4 = 0.11). The Hardy-Weinberg expectation of genotype distribution was calculated from the estimated allele frequencies and a 2-test was used to test for equilibrium (2 = 0.487, P>0.05). Student’s t-test indicated that subjects with the two most common apo E genotypes (E4/E4, E3/E3) were different from each other in means serum total cholesterol (t = 3.1, P<0.01). Allele frequencies of the present study performed on Iranian subjects were similar to those of Japanese, Korean (Asian groups) Mexican and African American populations.Iran. Biomed. J. 6 (4): 117-122, 2002
Keywords: Apo E, Polymorphism, PCR, Genetic Epidemiology, Lipids.
INTRODUCTION
uman apolipoprotein E (apo E), one of the least abundant plasma apoproteins, is a normal constituent of very low-density lipoproteins (VLDL), high-density lipoproteins (HDL), intermediate density lipoproteins (IDL), chylomicrons and chylomicron remnants. Apo E is synthesized in hepatic and extrahepatic tissues including brain. It plays an important role in lipid metabolism by acting as a ligand for the LDL receptor to mediate the uptake of apo E containing lipoproteins by cells [1] and apo E mediated lipoprotein assembly [2]. Human plasma apo E is a 299-amino acid protein (34 kDa), constituted by a single polypeptide chain [3]. The apo E gene is closely linked with the apo C-I and apo C-II genes and is located on chromosome 19, spans 3.6 KB, and includes 4 exons.
Apo E is polymorphic, with three common codominant alleles 2, 3, 4) coding for three isoforms (E2, E3, E4), which differ by a single
amino acid substitutions at residues 112 and/or 158 [4, 5]. The apo 3 allele is considered to be the parental allele and amino acid substitutions at position 112 (CysArg) and 158 (ArgCys) lead to the synthesis of the apo 4 and apo 2 allele products, respectively. In the general population, the apo E polymorphism has been shown to affect the plasma levels of total cholesterol, LDL-cholesterol (LDL-C), apo B and apo E [6].
As compared to the most common apo 3 allele, apo 2 allele is associated with lower total cholesterol, LDL-C, apo B and a higher apo E while the effect of the apo 4 allele is to increase total cholesterol, LDL-C, apo B and to lower apo C [1]. Apo E polymorphism is an important determinant of risk for the development of cardiovascular and Alzheimer’s diseases; the prevalence of the apo 4 allele being increased in both diseases compared to control subjects [3]. It is not clear whether this effect is mediated through the apo E genotype on lipids or through other mechanisms [7]. Most
H
patients with type III hyperlipidemia are homo-zygous for the E2 isoform (112 Cys and 158 Cys) that binds to cellular receptors with reduced affinity [8]. In population studies, the E2 isoform is associated with decreased levels of cholesterol and betalipoproteins [9]. Recently, the methods were developed for apo E typing at the DNA level using genomic DNA for Southern-blots with allele-specific oligonucleotide (ASO) probe that span positions 112 and 158 [10, 11]. The sensitivity of these methods were increased using the PCR to amplify apo E sequences for dot-blots with ASO probes [12] single strand conformational polymor-phism (SSCP) [13] and amplification refractory mutation system (ARMS) [14]. In addition, automated sequence analysis of PCR products has been used for typing common and rare apo E isoforms. Reports from various population groups have indicated the heterogeneity of apo E polymorphism [12]. In this report, we describe restriction isotyping the common apo E isoforms from an Iranian population.
MATERIALS AND METHODS
Clinical samples. DNA samples were taken from 100 Iranian hypercholesterolemic subjects from Shahid Shorideh Clinic in Tehran. Local ethic committee approval was obtained. An appropriate questionnaire was provided to the subjects in order to record their smoking habits and medical history. The subjects with cardiovascular diseases, diabetes mellitus, and taking hypolipidemic medication were not included in the study.
Preparation of DNA. Venous blood was drawn from fasting, sitting subjects between 08:30 and 09:30 h, and 1 mg Na2-EDTA/ml of blood was
immediately added. Genomic DNA was extracted from peripheral blood by using a salting-out method [15].
DNA amplification. Leukocytic DNA was amplified for the region of the fourth exon of apo E gene, which encodes amino acid residues 112 and 158. Oligonucleotide primers F4 5’-ACAGAATTC GCCCCGGCCTGGTACAC-3’(nucleotides 3908-3 892) and F6 5’-TAAGCTTGGCACGGCTGTCCA AGGA-3’ (nucleotides 3681-3699) were used as described before [12, 16]. PCR assay was performed in a 50-µl volume of 1PCR buffer (10 mM Tris-HCl pH 8.3; 50 mM KCl, 1 mM MgCl2;
0.01% Gelatin; 10% dimethyl sulfoxide), 1 µl of
template DNA, 0.2 mM of dNTPs, 20 pmol (each) primer, and 2.5 units/l Taq DNA polymerase (Perkin Elmer, Norwalk, CT). Reactions were run at 95ºC for 5 min and 30 cycles at 94ºC for 40 seconds, 64ºC for 30 seconds and 72ºC for 1 min and final extension of 72ºC for 10 min [17, 18, 19]. PCR products (40 µl) were digested with 10 unites of HhaI (New England Biolabs, Beverly, MA). Amplified products were not purified before restriction digestion [20]. The fragments were separated using 12% poly-acrylamide gels. The gels were treated with ethidium bromide and DNA fragments were visualized by UV illumination. The HhaI generated fragments were compared with known size markers (HinfI-digested pUC19 DNA) [17].
Statistical analysis. The frequencies of2,3 and 4 alleles were estimated by gene counting, e.g., the frequency of2 = (2 apo E2/E2 + apo E3/E2 + apo E4/E2)/Total number of alleles [21, 22]. The Hardy-Weinberg expectation of genotype distribution was calculated from the estimated allele frequencies and a2-test at P = 0.05 was used to test for equilibrium (2 = 0.487, P>0.05). Because of the small sample size, subjects with the less common genotypes (E2/2, E2/4, E4/4) were not included in statistical analysis [5, 23].
RESULTS
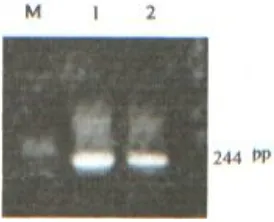
All PCR amplifications showed an expected fragment size (244 bp) on agarose gel electro-phoresis (Fig. 1). Each genotype was determined by the specific combination of fragments generated from restriction endonuclease cut. Except for a 38-bp common fragment, other 16-38-bp and 18-38-bp common fragments were too small to detect. The codon change from cysteine residues (GTCG) to arginine residues (GCGC) makes HhaI cleavage
Fig. 1. PCR products of APO E gene. M: 1Kb DNA Ladder.
Fig. 2. Genotype analysis by determination of HhaI RFLP. M: Plasmid pUC19 digested with HinfI.
sites at amino residues position 112 and 158 on apo E alleles. The E2 isoform has cysteine at residues 112 and 158, so the 2 allele had only two big fragments (91 bp and 83 bp). Whereas due to the substitution from arginine to cysteine residues at position 158 in E3, the 83-bp fragment was digested to 48-bp and 35-bp fragments in the 3 allele. In addition to E3, E4 has arginine at position 112; therefore, the 91-bp fragment was digested to a 72-bp fragment in the 4 allele (the 19-bp fragment was too small for detection). Therefore, each genotype generates unique combinations of HhaI fragment sizes. The E2/E2 sample contained 91 and 83 bp HhaI fragments reflecting the absence of sites at 112 Cys and 158 Cys. The E3/E3 sample also contained the 91-bp fragment (112 Cys), as well as 48- and 35- bp fragments from HhaI cleavage at 158 Arg site.
Fig. 3. Genotype analysis by determination of HhaI RFLP. M: Plasmid pUC19 digested with HinfI.
The E4/E4 sample also contained 48- and 35-bp fragments (158 Arg), as well as a unique 72-bp fragment from cleavage at 112 Arg (The 19-bp fragment was too small for detection). Heterozygotic alleles contained both sets of fragments from each apo E allele [17, 18]. Figs. 2 & 3 show all apo E genotypes in this study. Distribution of apo E genotypes and allele frequencies are shown in Table 1.
Table 1. Distribution of the apo E genotypes and allele frequencies in the study subjects.
Genotypes Observed No.
Hardy- Weinberg expected No.
E4/E3 22 19.40
E3/E3 76 77.40
E3/E2 2 1.80
E2/E2 0 0.01
E4/E2 0 0.22
E4/E4 0 1.20
Total 100 100.00
Allele frequencies
2 0.01
3 0.88
4 0.11
2(observed-expected ) = 0.487; P(df = 2) = 0.7- 0.8
Also, the result presented here by student’s t-test indicated that subjects with the two most common apo E genotypes (E4/3, E3/3) have different serum total cholesterol levels (t = 3.1, p<0.01) (Table 2). All frequencies in the present study were similar to those of Japanese and Chinese population (Asian groups) [24] and American, Mexicans and Indians groups [22] (Table 3).
Table 2. Comparison of mean total cholesterol levels according to the apo E genotypes.
Apo E Genotype N Cholesterol (mg/dl)
E3/E3 76 220 ± 25 (p<0.05, t = 1.98) E4/E3 22 276 ± 27 (p<0.05, t = 2.08)
E3/E2 2 260
Df = 96, t = 3.1, P<0.01
DISCUSSION
In the present report, the frequency of the common apo E isoforms and their influence on the total cholesterol levels in an Iranian population were determined. Recently, several reports have suggested that the apo E genotype influences the serum cholesterol level [25].
Table 3. Comparisons of apo E allele relative frequencies in several population studies.
Populations N
Allele Frequencies
References
2 3 4
Finland (Helsinki) Norway (several regions) Germany (Marburg & Giessen) Switzerland (Geneva) Japan (Tokyo) Korea (Seoul) Nigeria (Benin) USA Blacks Sudan (Khartoum) Mexicans (Texas, USA) Spain & Morocco
615 239 1031 173 197 145 357 194 103 963 660 0.041 0.090 0.077 0.072 0.038 0.020 0.027 0.034 0.083 0.039 0.041 0.733 0.795 0.773 0.821 0.843 0.870 0.667 0.706 0.626 0.859 0.855 0.227 0.115 0.150 0.107 0.112 0.110 0.297 0.260 0.291 0.102 0.104 22 22 22 22 22 26 22 22 22 22 27
Allele frequencies of the apo E polymorphism have been reported to vary among racial or ethnic groups. Allele frequencies reported in the present study were similar to those of Japanese, Mexican, and Korean [26] populations. The frequency of 4 appears to be 2-3 folds lower in Iranian subjects (Tehran; 4 = 0.11) compared to Finlander (Helsinki; 4 = 0.227), Nigerian (Benin; 4 = 0.297), African Americans (4 = 0.260), and Sudanese populations (Khartoum; 4 = 0.291) [22] and were similar to Korean (4 = 0.11) [26], Norwegian (4 = 0.115), German (Murburg; 4 = 0.119), Swiss (Geneva; 4 = 0.107), Japanese (Tokyo; 4 = 0.112), Mexican (Texas, USA; 4 = 0.102) [22], and Spanish and Moroccan population (4 = 0.104) [27]. The4 allele frequency is high in African blacks, Polynesians, or New Guineans; in contrast, it has low frequency among Asian populations. In general, the 3 allele frequency of Asian groups, including the present data, is higher than that of Caucasian (Canada, USA, New Zealand) and blacks (Nigeria, USA blacks, Sudan) [22, 26].
As the possible explanation for the differences of the apo E polymorphism among populations, it may be due to genetic drift by a founder effect or a selective mechanism. Another possibility is that these differences can be influenced by different prevalence rates of cardiovascular disease, the analytical methods of the apo E polymorphism, and the selection bias of samples. Variation of the apo E gene locus is known to affect total cholesterol levels, although the results have not always been concordant among populations. In general, the average effect of the 4 allele is to increase significantly the levels of total cholesterol in a
healthy population. In this study, the 4 allele had similar values to mean total cholesterol levels (Table 2) [26].
Utermann [28] has postulated that the apo E allele effects on cholesterol are dependent on environment, e.g. nutrition. That is, a significant effect of the4 allele is present in populations with high fat intake and high total cholesterol, but not in those with low total cholesterol. However, the effects of the4 allele on cholesterol levels did not differ significantly among the populations. Other examples were seen in Nigerian black and Koi San (Bushman) populations [29, 30]. These two populations had an exceptionally high frequency of 4 allele despite their low levels of plasma cholesterol. In conclusion, HhaI polymorphism analysis by PCR in this study is a rapid and convenient strategy that can be used directly on genomic DNA. It is also a useful tool for genetic or population study.
REFERENCES
1. Kamboh, M.I., Aston, C.E. and Hamman, R.F. (1995) The relationship of apo E polymorphism and cholesterol levels in normoglycemic and diabetic subjects in a bi-ethnic population from the San Luis Valley, Colorado. Atherosclerosis. 112 (2): 145-159.
2. Fazio, S., Linton, M.F. and Swift, L.L. (2000) The cell biology and physiologic relevance of apo E recycling. Trends Cardiovasc. Med. 10: 23-30.
3. Siest, G., Pillot, T., Regis-Bailly, A., Leininger-Muller, B., Steinmetz, J., Galteau, M.M. and Visvikis, S. (1995) Apolipoprotein E: An important gene and protein to follow in
laboratory medicine. Clin. Chem. 41(8 pt 1): 1068-1086.
4. Feussner, G., Albanese, M., Mann, W.A., Valencia, A. and Schuster, H. (1996) Apolipoprotein E2 (Arg136Cys), a variant of apolipoprotein E associated with late–onset dominance of type III hyperlipoproteinaemia. Eur. J. Clin. Invest. 26 (1): 13-23.
5. Salah, D., Bohnet, K., Gueguen, R., Siest, G. and Visvikis, S. (1997) Combined effects of lipoprotein lipase and apolipoprotein E polymorphisms on lipid and lipoprotein levels in the Stanislas cohort. J. Lipid Res. 38 (5): 904-912.
6. Schiele, F., De Bacquer, D., Vincent-Viry, M., Beisiegel, U., Ehnholm, C., Evans, A., Kafatos, A., Martins, M.C., Sans, S., Sass, C., Visvikis, S., De Backer, G. and Siest, G. (2000) Apolipoprotein E serum concentration and polymorphism in six European countries: The ApoErurope Project. Atherosclerosis 152: 475-488.
7. Dallongeville, J., Lussier-Cacan, S. and Davignon, J. (1992) Modulation of plasma triglyceride levels by apo E phenotype: A meta-analysis. J. Lipid Res. 33: 447-454.
8. Breslow, J.L., Zannis, V.I., San Giacomo, T.R., Third, J.L., Tracy, T. and Glueck, C.J. (1982) Studies of familial type III hyperlipoproteinaemia using as a genetic marker the apo E phenotype E2/2. J. Lipid Res. 23 (8): 1224-1235.
9. Boerwinkle, E. and Sing, C.F. (1987) The use of measured genotype information in the analysis of quantitative phenotypes in man. III. Simultaneous estimation of the frequencies and effects of the apolipoprotein E polymorphism and residual polygenetic effects on cholesterol, beta-lipoprotein and triglyceride levels. Ann. Hum. Genet. 51 (Pt 3): 211-226.
10. Funke, H., Rust, S. and Assmann, G. (1986) Detection of apolipoprotein E variants by an
oligonucleotide “melting” procedure. Clin. Chem. 32 (7): 1285-1289.
11. Smeets, B., Poddighe, J., Brunner, H., Ropers, H.H. and Wieringa, B. (1988) Tight linkage between myotonic dystrophy and apolipoprotein E genes revealed with allele-specific oligonucleotides. Hum. Genet. 80 (1): 49-52. 12. Emi, M., Wu, L.L., Robertson, M.A., Myers,
R.L., Hegele, R.A., Williams, R.R., White, R. and Lalouel, J.M. (1988) Genotyping and sequence analysis of apolipoprotein E isoforms. Genomics 3 (4): 373-379.
13. Tsai, M.Y., Suess, P., Schwichtenberg, K., Eckfeldt, J.H., Yuan, J., Tuchman, M. and Hunninghake, D. (1993) Determination of apolipoprotein E genotypes by single-strand
conformational polymorphism. Clin. Chem. 39 (10): 2121-2124.
14. Wenham, P.R., Newton C.R. and Price, W.H. (1991) Analysis of apolipoprotein E genotypes by the amplification refractory system. Clin. Chem. 37: 241-244.
15. Miller, S.A., Dykes, D.D. and Polesky, H.F. (1988) A simple salting out procedure for extracting DNA from human nucleated cells. Nucleic Acid Res. 16: 1215.
16. Paik, Y.K., Chang, D.J., Reardon, C.A., Davies, G.F., Mahley, R.W. and Taylor, J.M. (1985) Nucleotide sequence and structure of the human apolipoprotein E gene. Proc. Natl. Acad. Sci. USA 82 (10): 3445-3449.
17. Hixson, J.E. and Vernier, D.T. (1990) Restriction isotyping of human apolipoprotein E by gene amplification and cleavage with Hha I. J. Lipid Res. 31: 545-548.
18. Maekawa, B., Cole, T.G., Seip, R.L. and Bylund, D. (1995) Apolipoprotein E genotyping methods for the clinical laboratory. J. Clin. Lab. Anal. 9 (1): 63-69.
19. Moriyama, K., Sasaki, J., Takada, Y., Arakawa, F., Matsunaga, A., Ito, Y. and Arakawa, K. (1996) Characterization of a novel variant of apolipoprotein E, E2 Fukuoka (Arg-224Gln) in a hyperlipidemic patient with xanthomatosis. Biochem. Biophys. Acta 1301 (3): 185-190. 20. Ballering, L.A., Steffens-Nakken, H.M.,
Esselink, R.A., De Vos, R.A., Steur, E.N. and Vermes, I. (1997) Apolipoprotein E genotyping in patients with neurodegenerative diseases. Clin. Biochem. 30 (5): 405-411.
21. Corbo, R.M., Vilardo, T., Mantuano, E., Ruggeri, M., Gemma, A.T. and Scacchi, R. (1997) Apolipoproteins B and E, and angiotensin I-converting enzyme (ACE) genetic polymorphisms in Italian women with coronary artery disease (CAD) and their relationships with plasma lipid and apolipoprotein levels. Clin. Genet. 52: 77-82.
22. Gerdes, L.U., Klausen, I.C., Sihm, I. and Faergeman, O. (1992) Apolipoprotein E polymorphism in Danish population compared to findings in 45 other study populations around the world. Genet. Epidemiol. 9 (3): 155-167. 23. Hansen, P.S., Gerdes, L.U., Klausen, I.C.,
Gregersen, N. and Faergeman, O. (1994) Genotyping compared with protein phenotyping of the common apolipoprotein E polymorphism. Clin. Chem. Acta 224 (2): 131-137.
24. Hallman, D.M., Boerwinkle, E., Saha, N., Sandholzer, C., Menzel, H.J., Csazar, A. and Utermann, G. (1991) The apolipoprotein E polymorphism: A comparison of allele frequencies and effects in nine populations. Am. J. Hum. Genet. 49 (2): 338-349.
25. Honda, K. and Murase, T. (1997) Effects of apolipoprotein E phenotype on serum cholesterol level and cholesterol response to diet therapy in patients with hypercholesteraemia. Endocr. J. 44 (3): 425-429.
26. Hong, S.H., Kang, B.Y., Oh, J.H., Kim, J.H. and Lee, C.C. (1997) Genetic variations of the Apo E-CI-CII cluster gene in Koreans. Clin. Biochem. 30 (3): 215-219.
27. Valveny, N., Estenban, E., Kandil, M. and Moral, P. (1997) APO E polymorphism in Spanish and Moroccan populations. Clin. Genet. 51 (5): 345-356.
28. Utermann, G. (1987) Apolipoprotein E polymorphism in health and disease. Am. Heart J. 113 (2 pt 2): 433-440.
29. Sepehrnia, B., Kamboh, M.I., Adams-Campbell, L.L., Bunker, C.H., Nwankwo, M., Majumder, P.P. and Ferrell, R.E. (1989) Genetic studies of human apolipoproteins. X. The effect of the apolipoprotein E polymorphism on quantitative levels of lipoproteins in Nigerian blacks. Am. J. Hum. Genet. 45 (4): 586-591.
30. Sandholzer, C., Delport, R., Vermaak, H. and Utermann, G. (1995) High frequency of the apo epsilon 4 allele in Khoi San from South Africa. Hum. Genet. 95 (1): 46-48.