RESEARCH
Life-cycle analysis of greenhouse gas
emissions from renewable jet fuel production
Sierk de Jong
1*, Kay Antonissen
1, Ric Hoefnagels
1, Laura Lonza
2, Michael Wang
3, André Faaij
4and Martin Junginger
1Abstract
Background: The introduction of renewable jet fuel (RJF) is considered an important emission mitigation measure for the aviation industry. This study compares the well-to-wake (WtWa) greenhouse gas (GHG) emission performance of multiple RJF conversion pathways and explores the impact of different co-product allocation methods. The insights obtained in this study are of particular importance if RJF is included as an emission mitigation instrument in the global Carbon Offsetting and Reduction Scheme for International Aviation (CORSIA).
Results: Fischer–Tropsch pathways yield the highest GHG emission reduction compared to fossil jet fuel (86–104%) of the pathways in scope, followed by Hydrothermal Liquefaction (77–80%) and sugarcane- (71–75%) and corn stover-based Alcohol-to-Jet (60–75%). Feedstock cultivation, hydrogen and conversion inputs were shown to be major contributors to the overall WtWa GHG emission performance. The choice of allocation method mainly affects pathways yielding high shares of co-products or producing co-products which effectively displace carbon intensive products (e.g., electricity).
Conclusions: Renewable jet fuel can contribute to significant reduction of aviation-related GHG emissions, pro-vided the right feedstock and conversion technology are used. The GHG emission performance of RJF may be further improved by using sustainable hydrogen sources or applying carbon capture and storage. Based on the character and impact of different co-product allocation methods, we recommend using energy and economic allocation (for non-energy co-products) at a global level, as it leverages the universal character of energy allocation while adequately valuing non-energy co-products.
Keywords: Renewable jet fuel, Aviation, Greenhouse gas emissions, Life-cycle assessment, Alternative jet fuel, Biofuel, Bioenergy, Climate change
© The Author(s) 2017. This article is distributed under the terms of the Creative Commons Attribution 4.0 International License (http://creativecommons.org/licenses/by/4.0/), which permits unrestricted use, distribution, and reproduction in any medium, provided you give appropriate credit to the original author(s) and the source, provide a link to the Creative Commons license, and indicate if changes were made. The Creative Commons Public Domain Dedication waiver (http://creativecommons.org/ publicdomain/zero/1.0/) applies to the data made available in this article, unless otherwise stated.
Background
The aviation industry emits roughly 2% of global
anthro-pogenic greenhouse gas (GHG) emissions [1]. Despite
a projected fourfold increase in CO2 emissions in 2050
relative to 2010 [2], aviation was excluded from the
recent COP21 Paris Agreement [3]. The International Air
Transport Association (IATA) has set an industry target to achieve carbon neutral growth after 2020 and reduce emissions by 50% in 2050 (referenced to 2005). Besides efficiency improvements in technology and operations,
the adoption of renewable jet fuel (RJF), a Jet A-1 sub-stitute derived from biomass, is expected to make an
important contribution [4]. The International Civil
Avia-tion OrganisaAvia-tion (ICAO) recently agreed to develop a Global Market-based Measure (GMBM) to achieve
car-bon neutral growth after 2020 [5]. In this scheme,
air-craft operators should offset any annual increase in the GHG emissions beyond 2020 from international aviation between participating states using the Carbon Offsetting and Reduction Scheme for International Aviation (COR-SIA). The scheme is currently approved until 2035. Con-sumption of RJFs may also be included as part of a basket
of measures [5].
Open Access
*Correspondence: S.A.deJong@uu.nl
1 Copernicus Institute of Sustainable Development, Utrecht University, Heidelberglaan 2, 3584 CS Utrecht, The Netherlands
The contribution of RJF to the emission reduction ambitions in aviation depends on the market penetra-tion of RJF and its GHG emission reducpenetra-tion potential. To date, the market penetration of RJF has been negligible because of high prices and limited production capacity. Prior studies have explored the techno-economic feasi-bility and technology readiness of different RJF
conver-sion pathways [6–11]. A positive GHG emission balance
and sustainability impact (e.g., on water use, land use, biodiversity, etc.) is essential for RJF to contribute to a more sustainable aviation industry.
Various GHG emission performance assessments have been conducted for road biofuels, including comparisons
between different conversion pathways [12–15]. Previous
studies have shown the GHG emission performance is impacted significantly by methodological choices (espe-cially allocation methods for co-products) and spati-otemporal variability in input data (e.g., feedstock yields
or electricity mix) [16–21]. Although RJF can be
pro-duced from similar feedstocks as road biofuels,1
conver-sion and downstream handling may deviate due to different fuel specifications and higher quality standards. These standards generally require more stringent upgrad-ing, thus affecting yields and/or hydrogen consumption. Moreover, a thorough understanding of the impact of dif-ferent methodological frameworks on the GHG emission performance of RJF is necessary, because the use of RJF in a global carbon offsetting scheme requires a global methodological meta-standard.
Prior analyses have considered the GHG emission
per-formance of several RJF conversion pathways [21–28]. A
comparison of the results is challenging due to diverging methodologies and input data. This study expands the comparative base by examining the GHG emission per-formance of six RJF conversion technologies: Hydropro-cessed Esters and Fatty Acids (HEFA), Fischer–Tropsch (FT), Hydrothermal Liquefaction (HTL), pyrolysis, Alcohol-to-Jet (ATJ) and Direct Sugars to Hydrocarbons (DSHC; also commonly referred to as Synthetic Iso-paraffinic fuel, SIP). Additionally, this analysis shows the impact of different co-product allocation methods. As such, the objectives of this study are to (1) compare the GHG emission performance of RJF conversion pathways using different allocation procedures, (2) discuss poten-tial improvements of the GHG emission performance of RJF, and (3) provide input for the development of a
1 To leverage the experience with biofuels in the road transport sector and
avoid adverse sustainability effects, the Sustainable Aviation Fuel Users Group (SAFUG—a group of airlines representing approximately one-third of global jet fuel use), has committed to using fuels which do not compete with food supplies, significantly reduce well-to-wake GHG emissions, and
have a low risk of indirect land use change (LUC) [93, 94].
methodological meta-standard for the calculation of the GHG emission performance of RJF.
Methods LCA framework
A life-cycle analysis (LCA) framework can be used to assess the environmental impact across the entire prod-uct life-cycle. Methodology and default values are often standardized within a certain regulatory context, such as the EU Renewable Energy Directive (RED) and US Renewable Fuel Standard (RFS). A number of standard-ized approaches and respective calculation tools exist, of which prominent ones include the Greenhouse gasses, Regulated Emissions and Energy use in Transportation (GREET), BioGrace, and GHGenius (used in the US, EU and Canada, respectively). This study utilized the GREET model (GREET.net v1.3.0.12844, database version 12384),
as it already included some RJF conversion pathways [24,
29, 30]. Furthermore, it gives the opportunity to compare
and add pathways in a comprehensive yet transparent way. Default values for the reference year 2020 were used to assess the short-term GHG emission performance of RJF conversion pathways.
Functional unit
The conversion pathways were compared on the basis of
their GHG emissions in gCO2eq per MJ of RJF. The GHG
emissions considered were CO2, CH4 and N2O using
their 100-year global warming potential (1, 25 and 298, respectively), in line with the United Nations Framework
Convention on Climate Change reporting guidelines [24,
31].
System boundaries
The assessment covered well-to-wake (WtWa) GHG
emissions, expressed as CO2eq, including emissions from
feedstock cultivation and pre-processing, upstream logis-tics, conversion to RJF, downstream distribution, and end
use (Fig. 1). Upstream transport comprises the transport
from the feedstock production site or pre-processing facility to the conversion facility. Downstream distribu-tion includes the transportadistribu-tion of the RJF to a blend-ing terminal, blendblend-ing operations, transportation to the
airport tank farm and storage. Non-CO2 emissions from
jet fuel combustion were excluded from the analysis, as reported combustion data were only found for HEFA and FT RJF. Furthermore, as the chemical properties of RJF are by definition closely related to fossil jet fuel, it was assumed that there is no significant difference in GHG emissions from combustion, as was demonstrated
for HEFA and FT RJF [24, 32–35]. CO2 emissions from
the combustion of RJF are treated to be zero under the
Land use change
Emissions from direct and indirect land use change (LUC) can have a large impact on the GHG emission
per-formance of conversion pathways [12, 22]. Emissions
from direct LUC are caused by changes to the above- and below-ground carbon stocks as a result of changing for-mer land use to cultivate biomass for bioenergy purposes. Changing land use for biomass cultivation or diverting existing feedstock flows for bioenergy purposes may instigate land use changes elsewhere to restore initial production level of food, feed and materials, causing indirect LUC emissions. The larger part of LUC emis-sions typically occur at the start of a project; as such, its impact can be affected significantly by the method used
to amortize emissions over a given time period [36].2
Depending on the context, LUC-related GHG emis-sions may be positive (net emisemis-sions) or negative (net sequestration). Negative LUC-emissions may occur for highly productive feedstocks with a low fertilizer require-ment (e.g., perennial grasses) which sequester more above- and below-ground carbon than the reference veg-etation, especially when grown on degraded or marginal
lands (which mitigates indirect LUC effects as well) [37–
39]. Conversely, conversion of large carbon stores (e.g.,
(tropical) forests, peatlands or prairie) into high-input croplands (e.g., palm oil or corn) may lead to high posi-tive LUC emissions. Although important, these impacts
2 For example, a fundamental difference between the renewable energy
directive (RED) and renewable fuel standard (RFS) is the amortization period; whereas the RED specifies 20 years, the RFS uses 30 years.
are challenging to quantify, surrounded by considerable uncertainties and highly dependent on context-specific circumstances such as soil type, previous land use and
management practices (please see Wicke et al. [40] for a
comprehensive review of LUC-related GHG emissions
from biofuels) [40–43]. Moreover, quantification of these
effects should be considered in a broader context; for example, agricultural zoning, improved management or intensification measures in agriculture may mitigate the
indirect LUC GHG emissions from bioenergy [40, 44]. As
this analysis focused on the performance of the conver-sion pathway, LUC emisconver-sions were excluded from this analysis.
Conversion pathway scope
The scope included technologies which are or are expected to become commercially available in the near-term, namely Hydroprocessed Esters and Fatty Acids (HEFA), Fischer–Tropsch (FT), Hydrothermal Liquefac-tion (HTL), pyrolysis, Alcohol-to-Jet (ATJ) and Direct
Sugars to Hydrocarbons (DSHC), see Fig. 2.3 The selected
feedstocks include sugar/starch (sugarcane and corn), lignocellulosic (poplar, willow, corn stover and forestry residues), and oil feedstocks (used cooking oil, jatropha and camelina), as these feedstocks are currently used or have been considered for RJF production (this is, how-ever, not an exhaustive list).
3 HEFA, FT, DSHC and ATJ (from butanol) are certified for use in
commer-cial aviation by the American Society of Testing and Materials (ASTM). The other pathways are currently in the certification process.
Pre-processing Upstream transport Conversion to RJF Downstream distribuon End use GHG
GHG Co-products GHG Co-products GHG GHG
Ulies &
chemicals chemicals, Ulies,
microorganisms
Energy Energy
Well-to-Wake renewable jet fuel supply chain
Oil recovery and
extracon Upstream transport Conversion to RJF Downstream distribuon End use GHG
GHG GHG Co-products GHG GHG
Energy Energy
Well-to-Wake fossil jet fuel supply chain Feedstock
culvaon
CO2 Ferlizer
& ulies GHG
Energy Energy
Methods to deal with co‑products
The co-product allocation method in an LCA can have a profound impact on the GHG emission performance of
a product [18, 20–22, 25], especially when the yield of
co-products is high compared to the main product (see
also Additional file 1). GHG emissions can be allocated to
the co-products according to their energy, mass and
eco-nomic value [18, 20, 45, 46]. Alternatively, the
displace-ment method (or system expansion) awards an emission credit to co-products based on the yield of the co-prod-uct and the GHG emission intensity of the displaced product (e.g., the fossil counterpart of the co-product). While energy allocation yields strictly positive emission intensities (except bioenergy pathways with carbon cap-ture and storage), the displacement method may give negative emission intensities in case the emission credits exceed the total system emissions.
Benefits and drawbacks exist for each method; the suitability of a particular method largely depends on the production system and the co-products. The
Interna-tional Standards Organisation (ISO) [46] deems the use
of the displacement method most appropriate as it rep-resent the potential GHG emission mitigation effects of producing co-products. However, it requires additional system choices regarding the displaced product and the
associated avoided emissions [20]. Furthermore, when
the yield of the co-products is significant compared to
the main product, the choice of main product and
co-product can have a decisive impact on the results [20,
47]. Allocation methods are indifferent to the choice
of main product. Moreover, mass and energy alloca-tion are based on physical properties of the co-product and are thus universally applicable and less susceptible to methodological choices and uncertainties. This is a key motivation for regulators, including the European Union, to adopt this method in a normative context
[20]. However, mass allocation can only be applied to
co-products having a mass and is hence unsuitable for systems producing immaterial products such as elec-tricity. Energy allocation may not rightfully capture the value of non-energy co-products. For example, camelina meal, which can be used as an animal feed, is allocated more emissions when it is valued for its nutritional value (substituting soybean meal or corn) than when it
is valued for its energy content [25]. The last method,
economic allocation, captures the economic value of the co-product. However, a price ratio may be challeng-ing to establish for novel non-commoditized products and could be highly affected by price fluctuations, geo-graphical location or market distortions (e.g.,
monopo-lies or subsidies) [20, 45]. As such, economic allocation
is earmarked by the International Standards Organisa-tion (ISO) as a last-resort methodological opOrganisa-tion, when
other methods prove inapt [45, 46].
Feedstock
culvaon Conversion to RJF
Jatropha
Camelina HEFA
Gasificaon & FT
Pyrolysis
HTL
ATJ
DSHC Oil extracon
Oil extracon
Used Cooking Oil Rendering
Willow
Poplar
Corn stover
Forestry residues
Sugar cane
Fermentaon to ethanol Corn
Corn stover
Upstream
transport Downstream distribuon
Transport, storage and blending
Sugar extracon
Sugar extracon Pre-processing
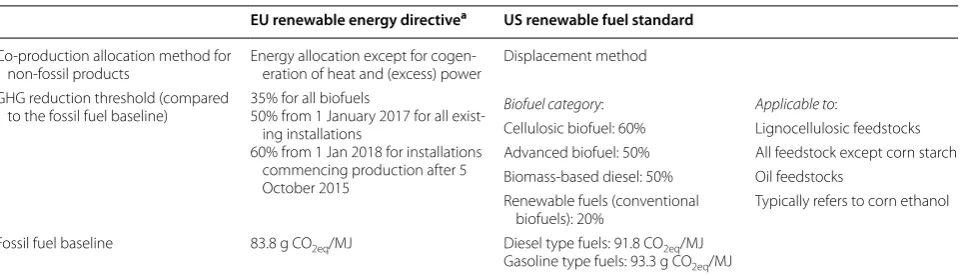
In this study both energy allocation and the displace-ment method were used for non-energy co-products as they are employed in two prominent regulatory frame-works, the EU Renewable Energy Directive and the US
Renewable Fuel Standard, respectively (Table 1) [48, 49].
Energy allocation was used for all fuel co-products (i.e. die-sel, gasoline, heavy fuel oil, propane, methane and naph-tha), as this is common practice for (sub-)processes which produce mainly fuels, because it captures the energy value of the product and is relatively indifferent to the choice
of co-product and variations in product slate [21, 50, 51].
Hence, essentially, two analyses were conducted; one using solely energy allocation and one using a hybrid method, integrating the displacement method and energy alloca-tion. An analysis using only the displacement method was not conducted, as such analysis was shown to be very sen-sitive to the choice of main product, especially if the yield fraction of the main product is low compared to other fuel
co-products produced by the same system. [21].
Fossil baseline
The results were compared to the baseline WtWa emis-sions of fossil jet fuel. Considerable ranges for jet fuel exist depending on crude oil quality and processing
tech-nique; for the US a range between 80.7 and 109.3 g CO2eq/
MJ was reported [52], while for the EU a range of
80.4-105.7 was found [53].4 The average WTWa emission
intensity for conventional jet fuel (87.5 g CO2eq/MJ)
con-sumed in the US was used as the fossil baseline such that
it matches the geographical scope of the input data [52].
This baseline is in between the fossil fuel baselines for transport fuels used in EU and US regulatory frameworks
(Table 1).
4 As combustion emissions were excluded in the source used [53], the CO2
emissions from the combustion of conventional jet fuel as reported in
Strat-ton et al. [52] (73.2 g CO2/MJ) were added.
Threshold values
The EU and US regulatory frameworks use GHG emission reduction threshold values to define which biofuels are
eligible to count towards renewable fuels targets (Table 1).
These thresholds originate from policy objectives (e.g. emissions reduction, sustainability requirements, security of supply) rather than being of technical origin. Whereas the EU renewable energy directive has increasingly higher reduction thresholds over time, the US renewable fuel standard has separate reduction thresholds for different categories of biofuels which are fixed in time. The biofuel categories in the US renewable fuel standard are based on the feedstock-technology combination.
The results of this study were compared to the GHG emission reduction threshold as specified for biofuels in the EU renewable energy directive and US renewable fuel standard to provide an indication of the eligibility of the RJF conversion pathways under both regulatory schemes. It is an order-of-magnitude screening only, pri-marily because this assessment does not include sustain-ability indicators acting as exclusion criteria and LUC emissions. Also, it uses (slightly) different fossil baselines, default values and assessment methodologies, especially relative to the EU regulatory framework.
Life cycle inventory
This section discusses the system configurations and most important assumptions used in this study. A full overview of the input data can be found in Additional
file 2.
Geographical origin of the data
Input values may vary across different world regions due to e.g., farming practice, feedstock yield or process design. In this study, RJF was assumed to be consumed in the US. Most feedstock cultivation and RJF production was situated in the US, except for sugarcane-based DSHC Table 1 An overview of biofuel regulation in the EU renewable energy directive and US renewable fuel standard
a In 2015 the EU introduced a 7% cap on biofuels from food crops grown on agricultural land and an indicative 0.5% target for advanced biofuels to reduce the risk of indirect LUC effects
EU renewable energy directivea US renewable fuel standard
Co-production allocation method for
non-fossil products Energy allocation except for cogen-eration of heat and (excess) power Displacement method GHG reduction threshold (compared
to the fossil fuel baseline) 35% for all biofuels50% from 1 January 2017 for all exist-ing installations
60% from 1 Jan 2018 for installations commencing production after 5 October 2015
Biofuel category: Applicable to:
Cellulosic biofuel: 60% Lignocellulosic feedstocks Advanced biofuel: 50% All feedstock except corn starch Biomass-based diesel: 50% Oil feedstocks
Renewable fuels (conventional
biofuels): 20% Typically refers to corn ethanol Fossil fuel baseline 83.8 g CO2eq/MJ Diesel type fuels: 91.8 CO2eq/MJ
and ATJ for which feedstock cultivation and conversion to RJF occurs in Brazil. In these cases, transportation of the RJF to and distribution in the US was added for con-sistency. Default values in GREET were used where avail-able. The life-cycle inventory was complemented with data from recent studies for those feedstocks and tech-nologies not available in GREET. Energy use for
blend-ing and storage was obtained from BioGrace [54], but
US emission factors were used to calculate the associated emissions.
Conversion pathway description
This study comprises six conversion technologies:
• Hydroprocessed esters and fatty acids (HEFA) The HEFA technology uses hydrogen to deoxygenate and saturate the fatty acid carbon chains. Carbon chains are sized to fit the diesel and jet range using selec-tive hydrocracking and/or isomerization. The values used in this study were taken from the GREET data-base, which is based on the UOP Ecofining process
[24, 29, 47, 52].
• Gasification and Fischer–Tropsch (FT) Lignocel-lulosic biomass is gasified to produce syngas. The syngas is converted to RJF, diesel, gasoline, propane and methane through FT synthesis. Electricity is generated from excess steam from gasification and FT synthesis. Process performance data were taken
from Swanson et al. [55]. As the reference study did
not consider RJF production, it was assumed that the diesel output could be split in 25% RJF-ranged hydro-carbons and 75% diesel-ranged hydrohydro-carbons. No additional emissions were taken into account as dis-tillation was already considered in the process design.
• Pyrolysis The pyrolysis process design was adopted
from Tews et al. [56]. In the process, feedstocks
are dried (using waste heat from char combustion), ground (using electricity) and consequently con-verted at elevated temperatures (~500 °C) to bio-oil,
gas and char [57]. The bio-oil is consequently
con-verted to a mixture of hydrocarbons by hydrode-oxygenation. Char is combusted to produce steam. Again, a 25–75% RJF-diesel split was applied to the diesel output.
• Hydrothermal liquefaction (HTL) The HTL
pro-cess design was also based on Tews et al. [56]. The
HTL process converts wet feedstocks (no drying required) into a biocrude using water as a medium. Compared to pyrolysis it is operated at more modest temperatures (250–550 °C), but elevated pressures
(5–25 MPa) [58]. As the HTL biocrude contains
less oxygen than the pyrolysis bio-oil, the hydro-deoxygenation step requires less hydrogen. Again,
a 25–75% RJF-diesel split was applied to the diesel output.
• Alcohol to jet (ATJ) The ATJ platform converts alco-hols (e.g. ethanol, butanol) to hydrocarbons. In this study, we use the ATJ pathway available in the GREET excel model. This pathway upgrades etha-nol to RJF, diesel and naphtha through dehydration,
oligomerization and hydroprocessing [26, 30]. Data
for ethanol production through fermentation of sug-arcane, corn (including milling processes) and corn
stover were adopted from GREET [29].
• Direct sugars to hydrocarbons (DSHC) In the DSHC process, sugars are fermented to farnesene, a branched C-15 molecule with four double bonds. The double bonds are saturated using hydrogen to produce farnesane. We used data for the DSHC process including the sugarcane milling from Klein-Marcuschamer et al. and Cox et al. which are based
on the Amyris process [8, 27]. Unlike these
stud-ies, we assume both sugar and molasses were used to produce biofuels. Although farnesane is eligible for 10% blending with fossil jet fuel, Klein-Marcus-chamer et al. process design includes additional hydrocracking and hydroisomerization, which pro-duces an enhanced RJF with a higher blend level but also increases the hydrogen consumption. Both the ‘increased blend level’ and ‘10% blend level’ cases were considered here. The former case is based on the hydrogen consumption as specified in Klein-Marcuschamer et al. The hydrogen consumption for the latter case was approximated by taking 120% of the stoichiometric hydrogen required for farnesene saturation. In this case, it was assumed that the farnesane is used as RJF only; no co-products were produced.
The process performance indicators of the RJF
conver-sion technologies are listed in Table 2 and Additional
file 2. The reader is referred to Mawhood et al. [10] for a
more elaborated description of the conversion
technolo-gies and their respective CAAFI fuel readiness level.5
Hydrogen generation
All pathways require hydrogen except FT, HTL (in situ) and pyrolysis (in situ). In the base case it was assumed that hydrogen was produced through steam methane reforming (SMR) of natural gas, which corresponds to the current production practice of hydrogen. For pyrol-ysis and HTL, ex situ (SMR of natural gas) and in situ
5 Commercial Aviation Alternative Fuels Initiative (CAAFI’s) Fuel Readiness
Level (FRL) methodology is based on NASA’s Technology Readiness Level (TRL) scheme. The FRL scale allows users to track the progress of a RJF in
Table
2
K
ey pr
oc
ess assumptions r
egar ding the R JF c on version t echnolo gies [ 8 , 29 , 30 , 55 , 56 ]
a F
eedst
ock is ethanol
b Ex
cluding na
tur
al gas used f
or h ydr ogen gener ation Pr oc ess Unit HEF A [ 29 ] FT [ 55 ] Pyr oly sis [ 56 ] HTL [ 56 ] AT J [ 30 ] DSHC [ 8 ] Sub ‑pr oc ess Ex situ In situ Ex situ In situ Incr
eased blend le
vel
10% blend le
vel
Inputs Feed
MJ f eed/MJ RJF 1.17 12.93 26.39 26.39 16.89 16.89 1.49 a 6.28 3.25
Natural gas consumption
b MJ/MJ RJF 0.18 Elec tr icit y consumption MJ/MJ RJF 0.005 1.53 0.21 0.86 0.03 H ydr ogen consumption MJ/MJ RJF 0.15 5.44 1.31 0.08 0.52 0.12 H ydr ogen f eedst ock Natural gas Natural gas Pr ocess off-gases Natural gas Pr ocess off-gases and wast e wat er Natural gas Natural gas Natural gas
Outputs Co-pr
oduc
t allocation ratio
RJF Nor maliz ed 1 1 1 1 1 1 1 1 1 Diesel MJ/MJ RJF 3.00 2.95 2.95 2.95 2.95 0.12 0.15 G asoline MJ/MJ RJF 1.69 7.88 7.88 4.57 4.57 Hea
vy fuel oil
Table 3 Allocation ratios for non-energy co-products and electricity [25, 29, 30, 56, 59–63]
a Based on the ratio between the average protein content of camelina (36.2%) and soybean meal (47%)
b GREET uses a weighted average of three different corn ethanol technologies. Dry mill ethanol production without corn oil extraction, dry mill ethanol production with corn oil extraction, and wet mill ethanol production respectively produce 18.23% , 72.91% and 8.87% of the total produced ethanol
c For electricity production, an average emission factor without transmission and distribution losses was used. For electricity consumption, these losses were included. For pathways located in Brazil, a much lower emission factor was used due to the high diffusion of hydropower in the electricity mix
d From the combustion of jatropha husks, shells and meal
e From the combustion of bagasse, after deduction of internal use of heat and power in the DSHC process Supply chain
component Applicable for pathway Main product Co‑product Co‑product allocation ratio rA Co‑product/ main product
Displaced
product Displacement ratio rD
Emission
factor Reference
MJ/MJ g/MJ g displaced
product/g co‑ product
g CO2eq/g displaced product
Non-energy co-products Camelina oil
extraction HEFA Camelina oil Camelina meal 0.64 47.79 Soybean meal 0.77
a 0.53 [25, 59, 60]
Corn dry mill ethanol production w/o corn oil extractionb
ATJ Ethanol Distillers grain
solubles 0.68 31.74 CornSoybean meal 0.780.31 0.290.53 [29]
Urea 0.02 1.22
Corn dry mill ethanol production w/ corn oil extractionb
ATJ Ethanol Distillers grain
solubles 0.65 30.36 CornSoybean meal 0.780.31 0.290.53 [29]
Urea 0.02 1.22
Ethanol Corn oil 0.04 1.06 Soy oil 1.00 0.53 [29]
Corn wet mill ethanol productionb
ATJ Ethanol Corn gluten
meal 0.15 6.87 CornUrea 1.530.02 0.291.22 [29]
Ethanol Corn gluten
feed 0.56 29.74 CornUrea 1.000.02 0.291.22 [29]
Ethanol Corn oil 0.21 5.52 Soy oil 1.00 0.53 [29]
Supply chain
component Applicable for pathway Main product Co‑product Co‑product allocation ratio rA Co‑prod‑ uct/main product
Displaced
product Displacement ratio rD
Emission factor Reference
MJ/MJ MJ displaced
product/MJ co‑product
g CO2eq/MJ displaced productc
Electricity (co-product)
FT synthesis FT RJF Electricity 0.45 US grid
electric-ity 1.00 137.88 [30]
Jatropha oil
extraction HEFA Jatropha oil Electricity
d 0.34 US grid
electric-ity 1.00 137.88 [29]
Pyrolysis Pyrolysis ex situ
case RJF Electricity 0.51 US grid electric-ity 1.00 137.88 [54]
Ethanol from
corn stover ATJ Ethanol Electricity 0.10 US grid electric-ity 1.00 137.88 [61]
Ethanol from
sugarcane ATJ Ethanol Electricity 0.22 Brazilian grid electricity 1.00 26.52 [62]
Sugarcane
milling DSHC (increased blend level) RJF Electricity
e 0.13 Brazilian grid
electricity 1.00 26.52 [63]
Sugarcane
milling DSHC (10% blend level) RJF Electricity
e 0.07 Brazilian grid
hydrogen production were considered. In the pyrolysis in situ case, hydrogen was produced through SMR of process off-gases; in the HTL in situ case hydrogen was produced through SMR of off-gases from the process and anaerobic digestion of the waste water. Ex situ hydrogen consumption was calculated from mass and energy
bal-ances presented in Tews et al. [56]. The feeds used for
hydrogen generation in the in situ case were utilized to power the process in the ex situ case, hence explaining the lower electricity consumption in the ex situ case.
Allocation and displacement ratios
All conversion pathways produce non-fuel and/or fuel
co-products. Table 2 shows the co-product allocation ratios
for fuel co-products. Table 3 provides an overview of the
product allocation ratios applied for non-energy co-products (a subgroup of non-fuel co-co-products) and elec-tricity (considered an energy and non-fuel co-product) for both the energy allocation and displacement method.
Results
Comparison between pathways
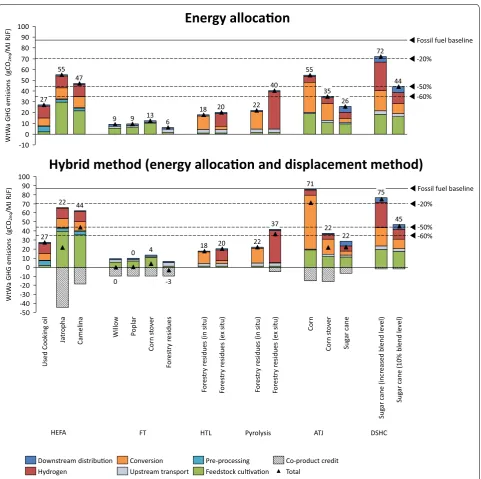
Figure 3 shows the WtWa GHG emissions per conversion
pathway for energy allocation and the hybrid method. FT yields consistently low WtWa GHG emissions across all feedstocks and both allocation methods, mainly due to the self-sufficiency of the process and excess electricity production. Corn-based ATJ and sugarcane-based DSHC (increased blend level case) show the highest WtWa GHG emissions in both methods. For corn-based ATJ this is caused by high fossil energy use during ethanol produc-tion and high emissions from fertilizer use. For DSHC, the low conversion yield and high hydrogen consumption are the main contributors to a high GHG footprint. Jat-ropha and camelina-based HEFA also show particularly high cultivation emissions. While per-hectare use of fer-tilizer and other inputs could be small for jatropha and camelina, the oil yield is usually low, leading to high emis-sions per unit of oil. In almost all processes hydrogen is an important contributor to the overall WtWa GHG emis-sions. In situ hydrogen production generally yields lower WtWa GHG emissions than ex situ hydrogen production; the emissions avoided by producing hydrogen from off-gas instead of natural off-gas offset the emissions related to increased electricity use (valid for the US electricity mix). The benefits of in situ production are stronger for the pyrolysis process as the upgrading of pyrolysis oil requires large amounts of hydrogen and the process off-gas already contains high concentrations of hydrogen. For RJF con-version pathways situated in Brazil (sugarcane-based pathways), the emissions from downstream distribution
increase slightly due to international transport while emissions from electricity use (or co-product credit) are reduced. This reduction is because Brazil’s average elec-tricity mix has a lower emission factor compared to the US, particularly due to a high share of hydropower.
Most pathways yield GHG emissions reductions exceeding 60% compared to fossil jet fuel and can there-fore comply with the most stringent emission reduction thresholds of the EU renewable energy directive and US renewable fuel standard. Whereas DSHC (increased blend level) is above or close to the lowest thresholds for biofuels irrespective of allocation method, the per-formance of jatropha-based HEFA or corn-based ATJ highly depends on the allocation method used. It is worth reminding that this assessment does not include LUC emissions, and therefore could over- or underesti-mate the GHG emission performance of these conversion pathways for a specific context.
Residues and lignocellulosic crops generally show better emission mitigation potential than food crops, because of low emissions related to fertilizer use, feed-stock cultivation or feedfeed-stock collection. RJF produced from highly productive food crops in combination with an efficient conversion process (i.e., sugarcane-based ATJ) is also able to meet the strictest GHG emission reduction thresholds currently applied.
Comparison between allocation methods
Figure 3 shows that the allocation method applied has a
significant effect on the GHG emission performance for
some pathways. As described in Additional file 1, the
dif-ference between energy allocation and the hybrid method increases for conversion pathways producing large amounts of co-products. Moreover, the hybrid method tends to yield lower WtWa GHG emissions for conver-sion pathways producing co-products which displace products whose emission intensity exceeds the emission intensity of the system (before allocation).
a high GHG emission profile of the conversion pathway. Despite a relatively high co-product allocation ratio for camelina-based HEFA, the moderate displacement ratio and low emission intensity of soy meal yields only a small decrease in WtWa GHG emissions for the hybrid method. This pathway will be examined more closely in the sensitivity analysis.
Conversely, corn ATJ shows higher emissions using the hybrid method. This is to be ascribed to its co-products
(distillers grain solubles, corn oil, corn gluten meal and corn gluten feed) displacing products with low emission intensities relative to the total system, which makes energy allocation more attractive than the displacement method.
Two out of sixteen pathways change threshold category after applying a different allocation method. Whereas jatropha-based HEFA meets a lower threshold category using the hybrid method, corn-based ATJ is demoted one category. -10 0 10 20 30 40 50 60 70 80 90 100 20 18 55 27 40 13 9 6 47 9 55 22 -60% -50% -20% Wt Wa
GHG emisions (g
CO2e q /MJ RJF) 44 72
Fossil fuel baseline
26 35 -50 -40 -30 -20 -100 10 20 30 40 50 60 70 80 90 100
Fossil fuel baseline
-60% -20%
Wt
Wa
GHG emisions (g
CO 2e q /MJ RJF) Sug ar ca ne (10% blend level) -50% 37 Sug ar ca ne (inc re as
ed blend level)
Su ga r ca ne Corn st over Fo re st ry re sidues (ex situ ) 22 Corn 22 75 18 Corn st over Fo re st ry re sidues (in situ ) 71 Fo re st ry re sidues 45 22 Fo re st ry re sidues (in situ ) 20 -3 4 Fo re st ry re sidues (ex situ ) Po plar 0 44 0 Willow
Used Cooking oi
l Camelina 22 27 Jatr opha Downstream distribuon Hydrogen Co-product credit Total Feedstock culvaon Pre-processing Upstream transport Conversion
HEFA FT HTL Pyrolysis ATJ DSHC
Hybrid method (energy allocaon and displacement method)
Energy allocaon
Sensitivity analysis
Alternative allocation methods for non‑energy co‑products To illustrate the impact of different allocation methods we apply mass and economic allocation to the camelina-based HEFA pathway in which large amounts of camelina meal are produced. Similar to the base results, energy alloca-tion was used for the remaining fuel co-products (i.e., pro-pane and naphtha). For mass-based allocation, we used an allocation ratio of 1.78 kg camelina meal/kg camelina oil. For economic allocation, the ratio between soy oil and soy meal was used as a proxy to determine the allocation ratio, as price data for camelina meal and oil were not available. A price for camelina meal and oil was derived from this ratio using a displacement ratio of 0.77 kg camelina meal/ kg soy meal and 1 kg camelina oil/kg soy oil, respectively. A mean, minimum and maximum (0.34, 0.29 and 0.45 $/ kg camelina meal per $/kg camelina oil) allocation ratio was found, based on a 10-year series of monthly price
ratios between soy oil and soy meal [64].
Figure 4 shows that the WtWa GHG emissions for the
camelina-based HEFA pathway range between 37 and
49 g CO2eq/MJ RJF for different allocation methods.
Whereas energy allocation assigns a relatively small share of emissions to the meal, mass allocation allocates a high share of emissions to the meal due to the large mass of meal produced. Economic allocation shows a modest
range of ±5% due to variability of price ratios. Although
the displacement method is shown as a point value here, different assumptions regarding displacement ratio, dis-placed product or emission intensity of the disdis-placed product may change the result substantially, as was shown in other studies for, e.g., camelina and
jatropha-based HEFA RJF [21, 22, 25].
Yield, fertilizer use and hydrogen use
In Fig. 3, feedstock cultivation, hydrogen use and
conver-sion were shown to have an important contribution to the overall WtWa GHG emissions. Therefore, a sensitiv-ity analysis was performed to determine the impact of the hydrogen, N fertilizer and conversion yields. Ranges for conversion yields were adopted from a survey of
technology performance data (see Additional file 3) [6].
Ranges in hydrogen emissions originate from variability in hydrogen consumption or emission intensity of hydro-gen production. Emissions from N fertilizer input may vary for different management practices, cultivation
loca-tions or calculation methods (see Additional file 2). Both
parameters were varied by ±20% to illustrate the
sensi-tivity of the WtWa GHG emissions to variance in these parameters. The ranges were inserted as single permu-tations and simultaneous permupermu-tations (as indicated by ‘All’). The results were calculated using energy allocation.
Figure 5 shows that the general merit order is retained in the sensitivity analysis. Whereas the majority of the
path-ways show modest ranges (<±20% for simultaneous
per-mutations), pyrolysis (ex situ) and DSHC (high blend level) show relatively large ranges, mainly due to hydrogen being an important determinant for the performance of these con-version pathways and the uncertainty regarding the conver-sion yield. Fertilizer input is shown to have a minor impact on the results. Furthermore, it is shown that the Base case considers relatively pessimistic yields for DSHC and pyroly-sis, while being optimistic for HEFA, FT and HTL.
Hydrogen production method
The base results assume hydrogen production using SMR of natural gas. Technological advancements and a higher penetration of renewable electricity can make more sus-tainable hydrogen generation processes technically and economically feasible. Two other processes were assessed to show the impact of such developments: (1) electroly-sis using renewable electricity from wind, solar and bio-genic waste and (2) gasification of biomass (switchgrass was taken as a proxy for biomass). These pathways were
adopted from GREET [29]. The results were calculated
using the energy allocation method.
Figure 6 illustrates that alternative hydrogen generation
methods can reduce the WtWa GHG emissions signifi-cantly and shift the merit order, especially for pathways for which hydrogen consumption is responsible for a high share of the total emissions such as ex situ
pyroly-sis (−71%), ex situ HTL (−48%), DSHC (−20 to 30%) and
UCO-based HEFA (−34%). For electrolysis, the majority
of the conversion pathways show WtWa GHG emissions below the 50% emission reduction threshold.
Discussion
Conversion pathway WtWa GHG emission performance The first aim of this study was to compare the GHG emis-sion performance of RJF converemis-sion pathways using dif-ferent allocation procedures. In terms of feedstock, it is shown that residues or lignocellulosic crops yield low WtWa GHG emissions, irrespective of conversion path-way or allocation method. The food and oil crops under consideration were generally characterized by higher feedstock cultivation emissions, which originated par-ticularly from the high fertilizer use (except for sugar-cane). In terms of technology, hydrogen consumption and conversion yield were found to be important deter-minants of GHG emission performance. Upstream 0 5 10 15 20 25 30 35 40 45 50 55 60 65 70 75 80 85 90 95
WtWa GHG emisions (gCO2eq/MJ RJF) Used cooking oil
Jatropha
Camelina
Forestry residues
Forestry residues
Corn
Corn stover Sugarcane Forestry residues
Forestry residues Willow
Poplar
Corn stover
Forestry residues
Sugarcane HEFA
FT
HTL (in situ) HTL (ex situ)
Pyrolysis (in situ) Pyrolysis (ex situ)
ATJ
DSHC (10% blend level)
Sugarcane DSHC (increased blend level)
Conversion yield
N ferlizer input All
Hydrogen consumpon
transport and downstream distribution only contrib-uted marginally to the overall WtWa GHG emissions. Although considerable uncertainty exists, the merit order of the pathways considered is quite robust to changes in key input parameters. Wide ranges were particularly observed for DSHC (high blend level) and pyrolysis (ex situ) due to uncertainty regarding the conversion yield.
It is stressed that the results were obtained for a spe-cific spatiotemporal context. The spatial component may influence emissions from feedstock cultivation and the
carbon intensity of utilities and fossil jet fuel. [19, 52, 53,
65, 66] Improvements inside and outside the production
system may positively affect the GHG emission
perfor-mance of RJF over time (see “Improving the GHG
emis-sion performance of RJF production” section).
Table 4 shows a comparison of study results with
exist-ing studies usexist-ing energy allocation, the displacement method, or a hybrid method. The ranges found are largely ascribed to variability in methodological approach (e.g., system boundaries or life cycle inventory elements, i.e., some include land use change emissions) or input data (e.g., co-product allocation ratios, conversion yields). Despite this variability, studies seem to agree on the superior WtWa GHG emission performance of FT RJF, irrespective of the feedstock or allocation method used. Greater methodological variability in the application of the displacement method causes wider ranges in GHG emission performance. The observed difference between results from both allocation methods concurs with
existing literature, particularly for conversion pathways with high co-product allocation ratios or co-products which effectively displace emission-intensive products
(e.g., electricity) [20, 21, 25, 67].
Improving the GHG emission performance of RJF production
The second aim of this paper was to identify improve-ments inside and outside the RJF supply chain which lead to further GHG emission reductions. The GHG emission reduction performance of RJF may improve in the future by higher conversion yields, better agricultural practice and lower carbon intensity of utilities. At the same time, the emission intensity of fossil jet fuel will likely increase in the future as the trend towards the utilization of more
heavy and sour (high sulfur) oil pursues [52, 73].
Moreo-ver, relocation of RJF production can improve the GHG emission reduction performance significantly; particu-larly due to the relatively high emission intensity of the
US electricity mix (see Table 3).
The production and use of hydrogen plays a particularly important role in current and future RJF production, as it is required in almost all pathways. Hence, sustainable hydrogen production technologies can have an important contribution towards reducing the emission intensity of RJF, especially when produced through electrolysis from renewable electricity. Furthermore, hydrogen consump-tion can sometimes be limited due to choice of feedstock, product slate, catalyst, organism or process conditions. 0 10 20 30 40 50 60 70 80 90 100 Wt Wa GHG emisions (g CO2e q /MJ RJF)
HEFA FT Pyrolysis ATJ DSHC
Used cooking oi
l Jatr opha Camelin a Fo re st ry re sidues Fo re st ry re sidues (in situ ) Corn Corn st over Sug ar ca ne Sug ar ca ne (inc re as ed blend level) Sug ar ca ne (10% blend level) -50% -60% -20% Fossil baseline Corn st over Po plar Willow Fo re st ry re sidues (ex situ ) Fo re st ry re sidues (in si tu ) Fo re st ry re sidues (e x situ ) HTL SMR natural gas (base)
Electrolysis using renewable electricity Gasificaon of biomass
No external hydrogen consumpon (base)
Deoxygenation remains inevitably important as oxygen is essentially the main impurity in biomass compared to RJF. In general, oxygen can be removed as water (using hydrodeoxygenation) and/or (biogenic) carbon dioxide (using decarboxylation, fermentation or gasification). Provided hydrogen can be produced sustainably, hydro-deoxygenation may be preferred from a climate change mitigation point of view as it increases conversion (car-bon) yields and limits the emissions of biogenic carbon
dioxide.6 On the other hand, pathways removing oxygen
through carbon dioxide (particularly FT and fermenta-tion pathways, but also hydrogen producfermenta-tion from
bio-mass gasification) yield high-purity point-source CO2
streams which can be captured against modest cost
com-pared to lower-purity CO2 streams from power plants
(fossil and bioenergy-based) [74–76]. Such bioenergy and
carbon capture and storage (BECCS) options provide the
6 Life-cycle GHG emission assessments generally assume biogenic carbon
dioxide emissions to be fully offset by carbon sequestration during feed-stock growth. Nonetheless, such emissions do contribute to radiative forc-ing until they are sequestered and as such influence the timforc-ing of GHG emission savings (as captured in the carbon payback time).
opportunity to achieve negative emission performance for RJF and can contribute significantly to deep emission
reductions on a global scale [77–79].
Implications for a global meta‑standard for RJF
The third aim of this study was to provide input to a global meta-standard for the calculation of the GHG emission performance of RJF. Whereas methodological differences can and should be smoothened in a global meta-standard for RJF to avoid competitive distortion or adverse sustainability effects, spatial differences are real and should ideally be addressed. Existing databases such as BioGrace, GREET, and GHGenius could be used as a starting point to determine regional default values (e.g., energy input and emission factors).
Co-product allocation is of particular importance for RJF production, as co-products are produced in almost all pathways (particularly fuel co-products in thermo-chemical pathways). The results of this study indicate that the choice for energy allocation or a hybrid method particularly affects pathways producing high amounts of (non-energy) co-products or co-products which effec-tively displace carbon intensive products (e.g., electricity in a US context).
Table 4 A comparison of study results with existing literature [21, 22, 24–28, 52, 56, 68–70]
a Some conversion pathways could not be compared due to lack of reference studies. It should be noted that the literature entails a much wider feedstock and technology scope than employed in this study, including a wide range of LCAs of RJF production based on algae species, edible oil crops, and herbaceous crops [71,
72]
b Elgowainy et al. [24], Stratton et al. [21] and Stratton et al. [52] assume all electricity produced during FT synthesis is used internally
c Based on diesel production, not RJF. It is included in this comparison as it is used as a data source for our computations
d Relative to Staples et al. [26], this study uses lower yields and a higher electricity emission intensity
Technologya Feedstock Energy allocation Reference Displacement method Reference
This study Prior studies This study Prior studies
g CO2eq /MJ g CO2eq/MJ g CO2eq/MJ g CO2eq/MJ
HEFA UCO 28 17–21 [68] 28 –
Jatropha 55 37–55 [21, 22, 28] 21 −134 to 63 [21, 22, 52]
Camelina 47 18–47 [25, 28] 44 −17 to 60 [25, 69]
FT Willow 9 – −7 −17 to 10 [24, 70]
Poplar 10 – −6 −17 to 10 [24, 70]
Corn Stover 13 8–11 [28] −3 9 to 14b [21, 52, 70]
Forestry residues 6 – −10 10 to 12b [24, 52]
HTL (in situ) Forestry residues 18 27c [56] 18 –
HTL (ex situ) Forestry residues 21 – 21 –
Pyrolysis (in situ) Forestry residues 22 34c [56] 22 –
Pyrolysis (ex situ) Forestry residues 41 – 37 –
ATJ Corn 54 – 71 –
Corn stover 35 – 22 –
Sugarcane 31 – 31 −27d [26]
DSHC (increased blend level) Sugarcane 76 – 79 55 to 100 [27]
Given the results and the trade-offs between different
allocation methods (see “Methods to deal with
co-prod-ucts” section), we propose to employ energy allocation as
a base in a global meta-standard, supplemented with eco-nomic allocation for specific systems. Energy allocation would likely lead to easier development and implemen-tation, due to its universal character, indifference to the choice of main product and ability to capture the value of energy products. For non-energy co-products produced in specific systems, economic allocation was deemed appropriate as it is subject to fewer methodological and circumstantial choices than the displacement method.
Such framework necessitates a threshold co-product allocation ratio after which economic allocation is to be used and an index (or regional indices) on the basis of which the co-product allocation ratio should be deter-mined, including a defined time span and sensible prox-ies for non-commoditized co-products. Moreover, it is important to be aware that this combination of allocation methods is sensitive to changes in co-product use (e.g. using naphtha as a chemical feedstock rather than using it for fuel production) or the product slate [e.g., produce more (non-energy) co-products at the expense of RJF
yield] [21]. As some of the conversion pathways
consid-ered are flexible in product output (e.g. FT and HEFA), further research on the impact of product slate variability is encouraged.
RJF as an emission mitigation instrument for aviation The mitigation costs of RJF are high compared to other mitigation options for aviation. Combining
techno-eco-nomic data from Jong et al. [6] with the results of this
study yields minimum GHG emission mitigation costs
of roughly 200 $/t CO2eq abated, irrespective of
co-prod-uct method (found for HTL at an oil price of 45 $/bbl). Although this figure is indicative and highly dependent on the oil price, these mitigation costs place RJF at the higher end of other biomass-based mitigation options
[80].
Other mitigation options for aviation (e.g., carbon offsets or efficiency improvements in technology and operations) yield lower mitigation costs; most efficiency improvement measures come at zero or negative
miti-gation costs [79], while 85% of the global carbon
off-sets is currently priced at less than 10 US $/t CO2 [82].
Although carbon prices are expected to rise, it is unlikely that carbon prices will approach the mitigation costs for
RJF before 2050 [83–85].
Nonetheless, the introduction of RJF is deemed an important part of the industry’s ambition to structurally
reduce GHG emissions [4]. Hence, even though the
Car-bon Offsetting and Reduction Scheme for International Aviation (CORSIA) will raise the price of fossil fuel, it
is most likely that further reduction of RJF production costs (through technological learning and maturation of biomass markets) and supplementary incentives are still required in order for airlines to prefer RJF adoption over buying emission credits to comply with the CORSIA scheme on the basis of cost. Given the substantial devel-opment efforts still required to get sufficient volumes of RJF on the market, the aviation sector cannot afford to rely solely on offsets and efficiency measures for the com-ing decade; it will need to continue to actively stimulate the development of RJF capacity in concurrence with the biofuel and biochemical sectors.
Wider sustainability considerations of RJF production The results of this analysis alone do not fully represent the climate change mitigation potential of RJF nor give a guarantee of the overall sustainability of RJF produc-tion. Firstly, this analysis does not include direct or indirect LUC emissions. Including LUC effects would likely lead to a stronger preference for residues. The magnitude of LUC emissions may have a positive or negative impact depending on the feedstock
cultiva-tion context (see “Land use change” section). Moreover,
the importance of LUC effects is likely to increase with growing demand for RJF and other biomass-derived
products [65].
Secondly, the GHG emission reduction as a result of using RJFs is not immediate. The timing of GHG emis-sion savings (as captured in the GHG payback period) depends on the feedstock used and prior land use, since there generally exists a temporal imbalance (‘carbon debt’) between the time of emission and sequestration of the carbon. The GHG payback period is particularly long for feedstocks with long rotation periods and/or natural decay times, such as different types of woody biomass
[86]. For the feedstocks investigated in this paper
(resi-dues, annual agricultural crops or short rotation crops), this effect is probably less relevant.
Thirdly, the system boundaries and functional unit employed in this analysis exclude the contribution to
radiative forcing of other emission species than CO2,
N2O and CH4. For example, emissions of water vapor,
NOx, soot and sulfate aerosols, as well as contrails and
contrail-induced cirrus formation caused by fuel com-bustion increase the radiative forcing by a factor 2–5
rel-ative to the impact of CO2 emissions alone [87]. Although
RJF has the potential to reduce some of these combustion
emissions (particularly CO, NOx, PM10 and SOx) [24, 35],
the positive impact of RJF on radiative forcing is likely to be lower than the percentage reduction in life-cycle
GHG emissions suggests [32]. Furthermore, other
may also significantly impact the net radiative forcing
effect of biofuels [88–90].
Lastly, an assessment of the sustainability of RJF should also include other possible impacts on water use, land use, air quality, health effects, food security, and biodi-versity, most of which are highly circumstantial and
tran-scend the domain of RJF [9, 24, 91, 92].
Conclusion
This study compares the well-to-wake (WtWa) GHG emission performance of various RJF conversion path-ways and shows the impact of different co-product allocation procedures. Conversion pathways based on residues or lignocellulosic crops yield low WtWa GHG emissions, irrespective of allocation method. The FT pathway shows the highest GHG emission savings (86–104%) of the pathways considered, followed by HTL (77–80%), pyrolysis (54–75%), UCO-based HEFA (68%), and sugarcane- (71–75%) and corn stover-based ATJ (60–75%). The largest differences between energy allocation and the hybrid method (using the displace-ment method for non-fuel co-products) were found for conversion pathways producing high amounts of co-products or co-products which effectively displace carbon intensive products, such as FT, jatropha-based HEFA or corn-based ATJ. This study was framed in a particular spatiotemporal context; a comparison of RJF production across regions and timeframes using different assessment frameworks is recommended to determine the impact of methodological and actual dif-ferences on the GHG emission intensity of RJF produc-tion. Also, this assessment does not include emissions from land use change and could, thus, over- or under-estimate the GHG emission performance in specific contexts.
The GHG emission performance of RJF can be enhanced by using more sustainable sources of electric-ity and hydrogen (e.g., biomass or renewable electricelectric-ity), improving agricultural practices and advancing RJF tech-nologies. Also, some pathways provide the opportunity to be combined with carbon capture and storage, poten-tially yielding negative emissions at relatively modest cost compared to other options for carbon capture and storage. Future research should evaluate the potential of these improvement options, preferably from a broader energy systems perspective.
The inclusion of RJF in a global carbon offsetting scheme requires a harmonized methodology to assess the GHG emission performance of different RJFs. We recom-mend using energy allocation as a base, supplemented with economic allocation for systems yielding high shares of non-energy co-products. This combination of alloca-tion methods leverages the universal character of energy
allocation and the ability of economic allocation to properly value non-energy co-products. The allocation methodology is only one of the aspects of a global meta-standard; broad cooperation is required to develop a robust framework which needs to be flexible to account for spatial diversity yet standardized to avoid competitive distortion or adverse sustainability effects.
Authors’ contributions
SJ conceived of the study, coordinated the process and drafted the manu-script. KA conducted the analysis and participated in its design. RH, MJ and AF participated in the study design and supervised the process. LL and MW supervised the analysis and participated in its design. All authors critically reviewed the manuscript and contributed to its contents. All authors read and approved the final manuscript.
Author details
1 Copernicus Institute of Sustainable Development, Utrecht University, Heidel-berglaan 2, 3584 CS Utrecht, The Netherlands. 2 European Commission-Direc-torate for Energy, Transport and Climate, Sustainable Transport Unit, EC-Joint Research Centre, Via E. Fermi 2749, 27027 Ispra, Italy. 3 Systems Assessment Group, Energy Systems Division, Argonne National Laboratory, 9700 S. Cass Avenue, Lemont, IL 60439-4844, USA. 4 Energy Academy Europe, University of Groningen, Nijenborgh 6, Groningen 9700 AE, The Netherlands.
Acknowledgements
This analysis was conducted as part of the Renewable Jet Fuel Supply Chain Development and Flight Operations (RENJET) project which is funded by the EIT Climate-KIC. The project partners (Utrecht University, Imperial Col-lege London, SkyNRG, KLM, and Schiphol Airport) aim to lay the basis for a self-sustaining network of regional renewable jet fuel supply chains based on sustainable feedstock sources. We also wish to express our gratitude to the staff of EC-Joint Research Centre in Ispra (Italy) and Argonne National Lab for supporting this study.
Competing interests
The authors declare that they have no competing interests. Sierk de Jong is employed by SkyNRG and Utrecht University. The author declares that there has been no competing interest or company interference with the contents of the study. No non-financial competing interests exist for any of the authors.
Availability of data and materials
The data used originates from peer-reviewed articles, GREET databases [29, 30] or Biograce [54], all of which are publicly available. The input data are listed in Table 2: Key process assumptions regarding the RJF conversion tech-nologies, Table 3: allocation ratios for non-energy co-products and electricity, and Additional files 2 and 3. The datasets used and/or analyzed during the current study are available from the corresponding author on reasonable request.
Funding
This study was funded by EIT Climate-KIC as part of the Fuel Supply Chain Development and Flight Operations (RENJET) project. EIT Climate-KIC or pro-ject partners did not influence the design of the study and collection, analysis, and interpretation of data and in writing the manuscript.
Received: 10 January 2017 Accepted: 18 February 2017
Additional files
Additional file 1. Energy allocation and displacement method.
Additional file 2. Input data.
References
1. Air Transport Action Group. Beginner’s Guide to Aviation Biofuels. 2011. 2. International Civil Aviation Organization. Present and future trends in
aircraft noise and emissions (Assembly 38th Session No. Working paper). 2013.
3. Buxton N. COP 21 Charades: spin, Lies and Real Hope in Paris. Globaliza-tions. 2016;7731:1–4.
4. International Air Transport Association. IATA 2015 Report on Alternative Fuels. 2014.
5. International Civil Aviation Organization. Resolution A39-3: Consolidated statement of continuing ICAO policies and practices related to environ-mental protection—Global Market-based Measure (MBM) scheme (39th general assembly). 2016.
6. de Jong S, Hoefnagels R, Faaij A, Slade R, Mawhood R, Junginger M. The feasibility of short-term production strategies for renewable jet fuels—a comprehensive techno-economic comparison. Biofuel Bioprod Bioref. 2015;9:778–800.
7. Pearlson M, Wollersheim C, Hileman J. A techno-economic review of hydroprocessed renewable esters and fatty acids for jet fuel production. Biofuels Bioprod Bioref. 2013;7:89–96.
8. Klein-Marcuschamer D, Turner C, Allen M, Gray P, Dietzgen RG, Gresshoff PM, et al. Technoeconomic analysis of renewable aviation fuel from micro-algae, Pongamia pinnata, and sugarcane. Biofuels Bioprod Biorefining. 2013;7:416–28.
9. Hileman JI, Ortiz DS, Bartis JT, Wong HM, Donohoo PE, Weiss MA, et al. Near-term feasibility of alternative jet fuels. Santa Monica: RAND Corpora-tion and Massachusetts Institute of Technology; 2009.
10. Mawhood R, Gazis E, de Jong S, Hoefnagels R, Slade R. Production pathways for renewable jet fuel: a review of commercialization status and future prospects. Biofuel Bioprod Bioref. 2016;10:462–84.
11. Atsonios K, Kougioumtzis M-A, Panopoulos KD, Kakaras E. Alternative thermochemical routes for aviation biofuels via alcohols synthesis: process modeling, techno-economic assessment and comparison. Appl Energy. 2015;138:346–66.
12. Edwards R, Larive J-F, Rickeard D, Weindorf W. Well-to-Wheels analysis of future automotive fuels and powertrains in the European context WELL-TO-TANK (WTT) Report. Version 4. 2014.
13. Hoefnagels R, Smeets E, Faaij A. Greenhouse gas footprints of different biofuel production systems. Renew Sustain Energy Rev. 2010;14:1661–94. 14. Intergovernmental Panel on Climate Change. Special report on
renew-able energy sources and climate change mitigation. 2011.
15. Wang M, Han J, Dunn JB, Cai H, Elgowainy A. Well-to-wheels energy use and greenhouse gas emissions of ethanol from corn, sugarcane and cel-lulosic biomass for US use. Environ Res Lett. 2012;7:45905.
16. Hennecke AM, Faist M, Reinhardt J, Junquera V, Neeft J, Fehrenbach H. Biofuel greenhouse gas calculations under the European Renewable Energy Directive—a comparison of the BioGrace tool vs. the tool of the Roundtable on Sustainable Biofuels. Appl Energy. 2013;102:55–62. 17. Chum H, Warner E. Tools for greenhouse gas (GHG) assessment for
biofuels: a comparison. http://ieabioenergy2015.org/fileadmin/veran-staltungen/2015/IEA_Bioenergy_Conference/S08-4_Chum.pdf2015 IEA Bioenergy Conf. Berlin, Oct. 27–29; 2015. Accessed 2016 Nov 10. 18. Cherubini F, Bird ND, Cowie A, Jungmeier G, Schlamadinger B,
Woess-Gallasch S. Energy- and greenhouse gas-based LCA of biofuel and bioenergy systems: key issues, ranges and recommendations. Resour Conserv Recycl. 2009;53:434–47.
19. Kendall A, Yuan J. Comparing life cycle assessments of different biofuel options. Curr Opin Chem Biol. 2013;17:439–43.
20. Wang M, Huo H, Arora S. Methods of dealing with co-products of biofuels in life-cycle analysis and consequent results within the US context. Energy Policy Elsevier. 2011;39:5726–36.
21. Stratton RW, Wong HM, Hileman JI. Quantifying variability in life cycle greenhouse gas inventories of alternative middle distillate transportation fuels. Environ Sci Technol. 2011;45:4637–44.
22. Bailis RE, Baka JE. Greenhouse gas emissions and land use change from
Jatropha curcas-based jet fuel in Brazil. Environ Sci Technol. 2010;44:8684–91. 23. Carter N, Stratton R, Bredehoeft M, Hileman J. Energy and environmental
viability of select alternative jet fuel pathways. 47th AIAA/ASME/SAE/ ASEE Jt Propuls Conf Exhib 2011:AIAA 2011–5968.
24. Elgowainy A, Han J, Wang M, Carter N, Stratton R, Hileman J. Life-cycle analysis of alternative aviation fuels in GREET; 2012. pp. 1–76. https:// greet.es.anl.gov/files/aviation-lca.
25. Shonnard DR, Williams L, Kalnes TN. Camelina-derived jet fuel and diesel: sustainable advanced biofuels. Environ Prog Sustain Energy. 2010;29:383–92. 26. Staples MD, Malina R, Olcay H, Pearlson MN, Hileman JI, Boies A, et al.
Lifecycle greenhouse gas footprint and minimum selling price of renew-able diesel and jet fuel from fermentation and advanced fermentation production technologies. Energy Environ Sci. 2014;7:1545–54. 27. Cox K, Renouf M, Dargan A, Turner C, Klein-Marcuschamer D.
Environ-mental life cycle assessment (LCA) of aviation biofuel from microalgae,
Pongamia pinnata, and sugarcane molasses. Biofuels, Bioprod Biorefin. 2014;8:579–93.
28. Han J, Elgowainy A, Cai H, Wang MQ. Life-cycle analysis of bio-based avia-tion fuels. Bioresour Technol. 2013;150:447–56.
29. Argonne National Laboratory. Greenhouse gases, regulated emissions, and energy use in transportation (GREET) GREET.net Computer Model. https:// greet.es.anl.gov/index.php?content=greetdotnet2015. Accessed 2 Feb 2016. 30. Argonne National Laboratory. Greenhouse gases, regulated emissions,
and energy use in transportation (GREET) GREET_1_2015 Excel model. https://greet.es.anl.gov/greet_1_series2015. Accessed 2 Feb 2016. 31. United Nations Framework Convention on Climate Change (UNFCCC).
Report of the Conference of the Parties on its nineteenth session, held in Warsaw from 11 to 23 November 2013 Addendum. 2014.
32. Stratton RW, Wolfe PJ, Hileman JI. Impact of aviation Non-CO 2 combus-tion effects on the environmental feasibility of alternative jet fuels. Environ Sci Technol. 2011;45:10736–43.
33. Corporan E, Edwards T, Shafer L, Dewitt MJ, Klingshirn C, Zabarnick S, et al. Chemical, thermal stability, seal swell, and emissions studies of alternative jet fuels. Energy Fuels. 2011;25:955–66.
34. Bhagwan R, Habisreuther P, Zarzalis N, Turrini F. An experimental com-parison of the emissions characteristics of standard jet A-1 and synthetic fuels. Flow Turbul Combust. 2014;92:865–84.
35. Beyersdorf A, Anderson B. An overview of the NASA alternative aviation fuel experiment (AAFEX). TAC-2 Proc. 2009. pp. 21–32.
36. Kendall A, Chang B, Sharpe B. Accounting for time-dependent effects in biofuel life cycle greenhouse gas emissions calculations. Environ Sci Technol. 2009;43:7142–7.
37. Dunn JB, Mueller S, Kwon H-Y, Wang MQ. Land-use change and greenhouse gas emissions from corn and cellulosic ethanol. Biotechnol Biofuels. 2013;6:51–64.
38. Davis SC, House JI, Diaz-Chavez RA, Molnar A, Valin H, DeLucia EH. How can land-use modelling tools inform bioenergy policies? Interface Focus. 2011;1:212–23.
39. Wicke B, Smeets E, Dornburg V, Vashev B, Gaiser T, Turkenburg W, et al. The global technical and economic potential of bioenergy from salt-affected soils. Energy Environ Sci. 2011;4:2669–81.
40. Wicke B, Verweij P, van Meijl H, van Vuuren DP, Faaij AP. Indirect land use change: review of existing models and strategies for mitigation. Biofuels. 2012;3:87–100.
41. Plevin RJ, Jones AD, Torn MS, Group R, Division ES, Berkeley L. The green-house gas emissions from indirect land use change are uncertain, but potentially much greater than previously estimated. Environ Sci Technol. 2010;44:8015–21.
42. Valin H, Peters D, Berg M van den, Frank S, Havlik P, Forsell N, et al. The land use change impact of biofuels consumed in the EU—quantification of area and greenhouse gas impacts (GLOBIOM report). 2015.
43. Edwards R, Mulligan D, Marelli L. Indirect land use change from increased biofuels demand. Ispra: EC Joint Research Centre; 2010.
44. Gerssen-Gondelach SJ, Wicke B, Faaij APC. GHG emissions and other envi-ronmental impacts of indirect land use change mitigation. GCB Bioenergy. 2016:1–18. doi:10.1111/gcbb.12394.
45. Ardente F, Cellura M. Economic allocation in life cycle assessment: the state of the art and discussion of examples. J Ind Ecol. 2012;16:387–98. 46. International Standards Organisation (ISO). ISO 14040:2006.


![Table 3 Allocation ratios for non-energy co-products and electricity [25, 29, 30, 56, 59–63]](https://thumb-us.123doks.com/thumbv2/123dok_us/449271.2042944/8.595.56.540.101.642/table-allocation-ratios-non-energy-products-electricity.webp)


![Table 4 A comparison of study results with existing literature [21, 22, 24–28, 52, 56, 68–70]](https://thumb-us.123doks.com/thumbv2/123dok_us/449271.2042944/14.595.57.541.101.348/table-comparison-study-results-existing-literature.webp)
