Volume 19, Number 1, pp. 69–77. http://www.scpe.org
ISSN 1895-1767 c
⃝2018 SCPE
AN OPTIMIZED DENSITY-BASED ALGORITHM FOR ANOMALY DETECTION IN HIGH DIMENSIONAL DATASETS
ADEEL SHIRAZ HASHMI∗, MOHAMMAD NAJMUD DOJA †, AND TANVIR AHMAD ‡
Abstract. In this study, the authors aim to propose an optimized density-based algorithm for anomaly detection with focus on high-dimensional datasets. The optimization is achieved by optimizing the input parameters of the algorithm using firefly meta-heuristic. The performance of different similarity measures for the algorithm is compared including both L1 and L2 norms to identify the most efficient similarity measure for high-dimensional datasets. The algorithm is optimized further in terms of speed and scalability by using Apache Spark big data platform. The experiments were conducted on publicly available datasets, and the results were evaluated on various performance metrics like execution time, accuracy, sensitivity, and specificity.
Key words: Anomaly detection, outlier detection, optimization, similarity measures, data mining
AMS subject classifications. 68P05, 68W15, 68W25
1. Introduction. In this era of big data, the traditional data mining algorithms are not capable of handling high-dimensional, high-volume datasets efficiently. To handle such datasets, new algorithms need to be proposed or the existing algorithms should be modified. Anomaly/Outlier detection [6][4][1] is a significant field of research in data mining and like other data mining algorithms, anomaly detection algorithms also need to be enhanced to handle such datasets. The algorithm should not only be accurate, but it should also be scalable and fast enough to identify the anomaly in real-time from the vast amount of data that is being generated every second. This paper discusses how an anomaly detection algorithm can be optimized to make it faster and more accurate, with focus on handling high dimensional datasets. Most of these algorithms provide the results based on some input parameters, and optimization of these parameters is must to obtain high accuracy for the algorithm. These algorithms also make use of some distance/similarity measure to identify the outliers and selection of this distance measure significantly affects the accuracy as well as speed of the algorithm. Further to increase the speed of the algorithm, it can be parallelized to reduce the processing time considerably. So, optimization of the parameters, selection of distance measure, and parallel implementation can collectively have a huge impact on accuracy and speed of the algorithm. This paper aims to propose an efficient anomaly detection algorithm for high-dimensional datasets based on all these fore-mentioned observations.
Local Correlation Integral [13] is a popular anomaly detection algorithm based on identifying the neigh-borhoods of every instance in the dataset by using a distance/ similarity measure like Euclidean distance, and the instances which are identified as isolated are deemed to be the outliers. In this paper, the authors aim to optimize a LOCI-inspired algorithm for anomaly detection; one of the objectives is to optimize the input param-eters, and the only input parameter for this algorithm is the radius of the neighborhood. To optimize this radius threshold, the authors select a swarm intelligence meta-heuristic, which is the firefly algorithm. The second phase of optimization deals with the similarity measure used by the algorithm, where the authors aim to find which similarity measure is optimal while dealing with high dimensional datasets. So, both L1 and L2 norms were compared for accuracy as well as speed. The platform chosen for conducting the experiments is Apache Spark as it guarantees scalability, fault-tolerance and also provides quick results by distributed processing and in-memory analytical abilities.
2. Related Work. In this section, we will review the literature dealing with anomaly detection followed by optimization algorithms which can be utilized to optimize the input parameters.
2.1. Anomaly detection. Anomaly Detection is a field of data mining dealing with finding abnormal data points in the given dataset. The major application areas of anomaly detection are intrusion-detection in the field of network security, fraud detection in financial domain, finding misbehaving node in the wireless
∗ Department of Computer Engineering, Faculty of Engineering and Technology, Jamia Millia Islamia, New Delhi, India
†Department of Computer Engineering, Faculty of Engineering and Technology, Jamia Millia Islamia, New Delhi, India. ‡ Department of Computer Engineering, Faculty of Engineering and Technology, Jamia Millia Islamia, New Delhi, India
sensor networks, medical and healthcare datasets, etc. With the rise of big data, finding anomalies in large datasets in real-time is quite a challenging task. So, we need to develop new faster algorithms or to optimize existing algorithms so that outliers are detected before it is too late in critical real-time environments.
The simplest and fastest anomaly detection algorithm is the AVF (Attribute Value Frequency) [8] which is based on the assumption that the data points with low frequencies are the prime candidates to be the outliers. Another statistical algorithm is the Entropy-based Outlier Detection (EBOD) [9] which assumes that the points whose removal causes the maximum decrease in the entropy of the dataset are the anomalies. There are graphical techniques for outlier detection as well, namely, scatter-plots and box-plots; however these graphical techniques fail for multi-dimensional datasets.
Machine Learning based algorithms are also available for anomaly detection. DBSCAN [7] is a clustering algorithm with ability to identify anomalies, whereas OPTICS-OF [2] is an extension of OPTICS clustering algorithm for anomaly detection. Neural Networks have been utilized in literature in the form of Replicator Neural Networks for finding outliers. LOF (Local Outlier Factor) [3] and LOCI (Local Correlation Integral) [13] are the two most popular algorithms for anomaly detection, provided by most of the machine learning libraries.
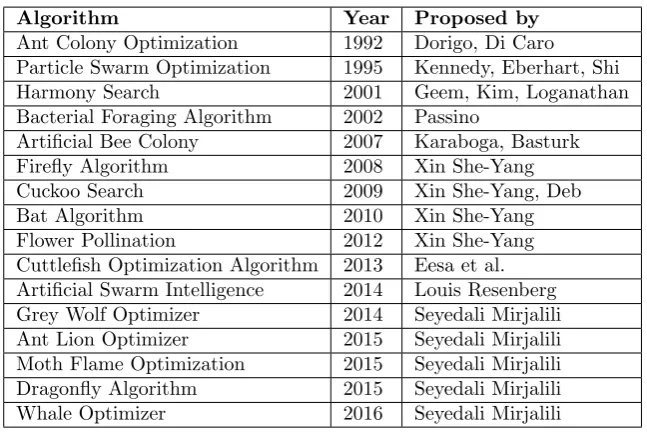
2.2. Optimization Algorithms. In artificial intelligence, a metaheuristic is a partial search algorithm which finds a sufficiently good solution when there is no proper information for guiding the search process, and going through all the possible states is not feasible. Metaphor-based metaheuristics are nature-inspired metaheuristics like simulated annealing which is based on a naturally occurring chemical process. Evolutionary algorithms [12] are a category of population-based metaheuristics which start with random solutions and move towards an optimal solution. A category of evolutionary algorithms is swarm-based algorithms which mimic the collective behavior of insects/organisms/animals shown while searching for food, finding mating partner, etc. There are many swarm-based metaheuristics mostly derived from the PSO (Particle Swarm Optimization) and ACO (Ant Colony Optimization) metaheuristics like Firefly Algorithm, Bat Algorithm, Cuckoo Search, Fish School Search, etc. Some of the popular swarm-based metaheuristics are listed in Table 2.1.
The swarm intelligence optimization is based on two processes: exploitation and exploration. The exploita-tion process deals with finding the best soluexploita-tion among the present candidate soluexploita-tions (local best), whereas exploration process deals with generating new candidate solutions to reach a global best. The exploration is achieved by a random walk in the search space. L´evy flight [14][17] is a random walk which is used by most of the researchers for exploration in the swarm-based optimization algorithms.
Table 2.1
Swarm-based Metaheuristics
Algorithm Year Proposed by
Ant Colony Optimization 1992 Dorigo, Di Caro Particle Swarm Optimization 1995 Kennedy, Eberhart, Shi
Harmony Search 2001 Geem, Kim, Loganathan
Bacterial Foraging Algorithm 2002 Passino
Artificial Bee Colony 2007 Karaboga, Basturk
Firefly Algorithm 2008 Xin She-Yang
Cuckoo Search 2009 Xin She-Yang, Deb
Bat Algorithm 2010 Xin She-Yang
Flower Pollination 2012 Xin She-Yang
Cuttlefish Optimization Algorithm 2013 Eesa et al. Artificial Swarm Intelligence 2014 Louis Resenberg Grey Wolf Optimizer 2014 Seyedali Mirjalili Ant Lion Optimizer 2015 Seyedali Mirjalili Moth Flame Optimization 2015 Seyedali Mirjalili Dragonfly Algorithm 2015 Seyedali Mirjalili
Whale Optimizer 2016 Seyedali Mirjalili
PSO mimics the flocking behavior of the birds. The PSO algorithm begins by initializing its population first, which consists of the candidate solutions, called as particles. Each particle has two components position and velocity. The position is the current value of the particle, and the velocity components helps in movement of the particle in the search space. The particles are evaluated using an appropriate fitness function, and the particle which has the highest fitness is labeled as local best. After obtaining the local best, rest of the particles are moved towards this local best particle. This process is repeated in several iterations keeping track of the local best of each iteration and global best among all the iterations, to reach a final global best. The list of algorithms derived from PSO is quite long; artificial bee colony, bat algorithm, firefly algorithm, cuckoo search are among the algorithms which are inspired from PSO.
3. Proposed Work. In this section, we will study how the Local Correlation Integral algorithm iden-tifies the outliers, the shortcomings of LOCI, and how can we optimize our LOCI-inspired algorithm by a metaheuristic. The metaheuristic chosen is a swarm intelligence algorithm based on the behavior of fireflies.
3.1. Density-based Outlier Detection. LOF [3] is a density-based outlier detection algorithm derived from DBSCAN algorithm. In LOF, a local outlier factor score is calculated for each data point. In this method, number of neighborhood points (n) to consider is set a priori. A reachability distance/density is computed (for the data point p under consideration) from the distance to the n nearest neighbors. The reachability density of each of the n nearest neighbors is also calculated. The LOF score of the data point is ratio of the average density of the n nearest neighbor of the point and the density of the point itself. For a normal data point, the density of the point will be similar to that of its neighbors and the LOF value is low, whereas for an outlier LOF score will be high.
LOCI (Local Correlation Integral) [13] addresses the difficulty of selecting the value of n in LOF by using a different criteria for the neighborhood. In LOCI, all the points within a value ofr (radius) are considered as neighbors, and the reachability density is calculatedw.r.t to all these data points. But still the problem that remains is what value of r must be chosen to get optimal results. The LOCI algorithm doesn’t provide any mechanism to select a value ofr, so either we must know the value ofr in advance, or we need to find the value of r by an optimization algorithm. The LOCI algorithm makes use of MDEF (multi-granularity deviation factor) which is the relative density of local neighborhood density of a point and average local neighborhood density of its neighbors; the outliers have a low MDEF score (near zero), whereas normal points have high MDEF score (normally around 1). However, the algorithm used in this paper doesn’t utilize the MDEF score; instead it just keeps the basic principle of density-based anomaly detection in mind that low neighborhood density indicates higher probability of the point to be an outlier.
3.2. Firefly Optimization. Firefly metaheuristic [16] is one of the simplest and yet powerful algorithm of swam intelligence, based on flashing behavior of fireflies. The brightest firefly is the most attractive/fittest and rest of fireflies move towards this brightest firefly for mating. This brightest firefly is also not static and it moves randomly in order to further increase its brightness, as its brightness is dependent on brightness of the fireflies in its neighborhood. Firefly metaheuristic begins by initializing a random population of fireflies (solutions). The brightness of each firefly is evaluated by a fitness function, and brightest firefly is identified. The less bright firefly (Xl) is moved towards a brighter firefly (Xb) according to equation (3.1).
Xl(t+ 1) = (1−β)Xl(t) +βXb(t) (3.1)
where,
β=β0e−γd2 (3.2)
In equation (3.2),β0is a random constant b/w 0-1, and it signifies the convergence rate of the system; high value can jump past the optimal solution and low value can lead to slow convergence, so its value is generally taken to be around 0.2. β signifies the convergence rate b/w a pair of points which depends on the distance d b/w the points. γ is another constant which can be used to control the convergence rate b/w two points, by multiplying it with the distance b/w the two points.
walk in which sudden large steps are taken amidst small steps. The generation of L´evy steps can be achieved by Mantegnas algorithm [10], where the step length S can be calculated by equation (3.3):
S= u
vβ1
(3.3)
u≈N(0, σu2) and v≈N(0, σ
2
v) (3.4)
σv= 1 and σu=
Γ(1 +β)sin(πβ2 )
Γ(1+β
2 )β2
(β−1)
2
1
β
(3.5)
where β is a parameter b/w interval [1,2] generally taken as 1.5,u andv are drawn from normal distribution, and Γn=(n-1)! is the gamma function.
The firefly metaheuristic can easily be applied for optimizing the value of input parameterr in our anomaly detection algorithm. For optimizing the value of r, the fitness function is k/r and we have to minimize this fitness function. However, the value ofr should not be too high so as to include all the points or too low such that every point has small value ofk. So, we need to set a lower limit as well as an upper limit on the value of k. So, according to [11] the fitness function that could be used is:
α rk +
k r +
k
n−k (3.6)
Therefore, the fireflies in our case will be the values of r. For each value of r, the fitness of each point is calculated from equation (3.6).
Steps for anomaly detection by firefly optimized algorithm
Step-1. Initialization.
Generate the distance matrixdist mat of the dataset.
Define alist withN values of radiusr, each value of r corresponding to a firefly.
Step-2. Calculate brightness of each firefly. foreachr inlist do
foreachrow indist max do
i. find number of elements less thanr (set this value ask). ii. find fitness of the row acc. to Eq. 3.6.
Find the row with minimum value of fitness function. The fitness of this row is the brightness ofr/firefly.
Step-3. Identify brightest firefly.
In previous step, we getN fitness values corresponding to brightness of each firefly. The firefly (value of r) with least fitness value is the brightest firefly, denoted byr*.
Step-4. Move fireflies. foreachr inlist do
if(r!=r*)
update r acc. to Eq. 3.1. else
update r* by L´evy flight.
Return the value of r* found to be optimal.
Step-6. Rank the points forr*.
foreachrow indist max do
i. find number of elements less thanr* ii. find fitness of the row acc. to Eq. 3.6.
Rank all the rows (lower the fitness value, higher the rank).
Step-7. Return the k highest ranked rows/points as outliers and remaining as inliers.
3.3. Parallelization in Apache Spark. The most popular framework for parallel/distributed computing is Hadoop MapReduce. MapReduce [5] is a distributed/ parallel programming model which runs on a cluster of commodity hardware, where a master node distributes the job to worker nodes for parallel processing. MapReduce model consists of two phases: map and reduce; in the map phase the job in divided into independent sub-tasks and assigned to worker nodes, and in the reduce phase the output returned by each worker is aggregated to give a final result. In MapReduce model, the data is mapped into a list of (key,value) pairs, and then reduce operation is applied over all pairs having the same key.
The Hadoop MapReduce model has a major limitation that it forces a linear dataflow structure on the programs i.e. it doesn’t support iterative algorithms. Apache Spark overcomes this limitation through a data structure they call RDD (Resilient Distributed Dataset). RDDs are immutable and their operations are lazy. Fault tolerance is achieved by keeping track of the lineage of each RDD, so that it can be reconstructed in the case of data loss. Apache Spark also has an advanced DAG execution engine that supports acyclic dataflow and in-memory computing. Apache Spark is said to be faster than Apache Hadoop due to its in-memory computation capability and use of Resilient Distributed Database (RDD) on which two types of operations can be performed viz. transformation and action. These transformations and actions contain over 80 high-level operators which make development of parallel applications much easier as compared to other MapReduce based tools like Hadoop.
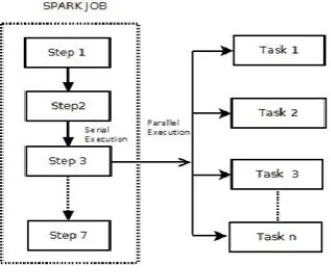
A Spark job typically contains sequential steps, and those steps which contain independent sub-tasks can be parallelized by executing the sub-tasks in parallel as shown in Figure 3.1. Spark provides APIs with high-level abstractions which provide implicit parallelism over distributed data elements. Spark 2.0 introduced DataFrame API which like RDD is an immutable collection of data, but unlike RDDs, it organizes data into named columns. DataFrame API provides various SQL-like operations which execute in parallel over Spark DataFrame.
Fig. 3.1. Spark Job
The fitness vector contains fitness value of each row in the dataset. There are N fitness vectors corresponding to N fireflies (values of r). The process of calculating the distance vector is slow when done sequentially, so parallelization of this step improves the performance of the algorithm considerably.
4. Experimental studies. In this section, the experiments conducted on various publicly available data-sets are discussed. The experiments were conducted on i5 processor with 2 cores and 4 GB RAM running Ubuntu 16.10. The algorithm was implemented in PySpark and run over Spark 2.2.0.
4.1. Datasets. The datasets used for experiments are Cardiotocography, Optdigits, Arrhythmia, Musk, Speech and SMTP-KDDCUP99. All these datasets are openly available on UCI/ODDS data repository. The Cardiotocography dataset has 1831 instances with 21 features containing 176 (9.6%) outliers. The Optdigits dataset has 5216 instances with 64 features containing 150 (3%) outliers. The Arrhythmia dataset has 452 instances with 274 features containing 66 (15%) outliers. The Musk dataset has 3062 instances with 166 features containing 97 (3.2%) outliers. Speech dataset has 3686 instances with 400 features containing 61 (1.65%) outliers. SMTP-KDDCUP99 dataset has 95156 instances with 3 features containing 30 (0.03%) outliers.
The Cardiotocography dataset originally has 2126 instances with 23 attributes. The instances are assigned class normal, suspect or pathologic. The points labeled as suspect are discarded, the normal points are considered as inliers and the pathologic points are down-sampled to 176.
The Optdigits dataset is a character recognition dataset for integers 0-9. The 32X32 bitmaps are divided into non-overlapping blocks of 4X4 each, which generates an input matrix of 8X8. The instances for digits 1-9 are treated as inliers whereas the instances of digit 0 are treated as outliers (after down-sampling) to give 150 outliers.
Arrhythmia dataset originally has 279 attributes. There are 5 categorical attributes (age, sex, height, weight, class) which are discarded, giving 274 attributes. The 452 instances are assigned to 16 different labels from 01 to 16. The classes with least instances, i.e., 3, 4, 5, 7, 8, 9, 14, 15 are combined to form the outlier class (66 instances) and the rest of the classes are combined to form the inliers class (386 instances).
Musk dataset describes a set of 102 molecules of which 39 are musks and 63 are non-musks. A single molecule can adopt many shapes due to bond rotations, therefore all the low-energy conformations of the molecules are generated to produce 6598 conformations. The naming convention used for the molecules is MOL ISO+CONF. These 6598 conformations are reduced to 3062 conformations, keeping molecules j146, j147 and 252 as non-musk (inliers), whereas molecules 213 and 211 are kept as musks (outliers).
The speech dataset consists of 3686 segments of English speech spoken with eight different accents. Most of the segments (98.35%) correspond to American accent whereas only 1.65% (61) of the segments belong to one of the seven other accents. So, the segments belonging to American accent are treated as inliers whereas segments belonging to non-American accent are treated as outliers.
The SMTP-KDDCUP99 dataset is a subset of original KDDCUP99 intrusion detection dataset having 3925651 attacks (80.1%) out of 4898431 records. A smaller set is forged by having only 3377 attacks (0.35%) of 976157 records, where attribute ’logged in’ is positive. From this forged dataset, 95156 instances of ’SMTP’ service data is used to construct the SMTP-KDDCUP99 dataset having 30 (0.03%) outliers.
4.2. Evaluation Metrics. To evaluate and compare our results, we need some evaluation metrics. TP (True positives), FP (False Positives), TN (True Negatives) and FN (False Negatives) are the number of normal points correctly detected as inliers, the number of abnormal points that are detected as inliers, the number of abnormal points that are correctly detected as outliers, and the number of normal points that are wrongly detected as outliers, respectively.
Accuracy, sensitivity, and specificity are defined as the following expressions:
Accuracy= T N+T P
T N+T P +F N+F P (4.1)
Sensitivity= T P
Specif icity= T N
T N+F P (4.3)
4.3. Results. In this section, the results of the experiments are discussed. Analyzing the datasets, the size and feature-to-instance ratio is shown in Table 4.1.
Table 4.1
Analysis of datasets
Dataset Size Values Feature-Instance Ratio
Arrhythmia 452 X 274 123,848 0.6061
Cardio 1831 X 21 38,451 0.0114
Musk 3062 X 166 508,292 0.0542
Speech 3686 X 400 1,474,400 0.1085
Optdigits 5216 X 64 333,824 0.0122
SMTP KDDCUP99 95156 X 3 285,468 0.00003
From the literature, it is inferred that Euclidean distance is the similarity measure of choice for ordinary datasets. Table 4.2 provides the execution time to generate the similarity matrices by different similarity measures for our chosen datasets. From Table 4.2, we can infer that execution time is primarily dependent on number of instances rather than total size of the dataset. Further, it is noticed that Manhattan distance is the best choice among the chosen distance measures as far as execution time is concerned; the notable exception is the cardio dataset which has the smallest dimensions among the chosen datasets and for this dataset Euclidean distance has best execution time. It is also noticed that feature-instance ratio has no major impact on choice of similarity measure, as Cardio and Optdigits have nearly same ratio, but results are clearly different. From these results we can conclude that Manhattan distance is the best candidate for similarity measure while dealing with high-dimensional datasets.
Table 4.2
Execution Time (in seconds) for distance matrix
Data-base
Distance Measures
Euclidean Cosine Similarity
Manhattan Distance
Hellinger Distance
Arrythmia 0.145 0.141 0.125 0.134
Cardio 1.70 1.66 1.61 1.63
Musk 4.75 4.82 4.50 4.67
Speech 6.58 6.67 6.42 6.51
Optdigits 20.98 14.18 13.74 13.94
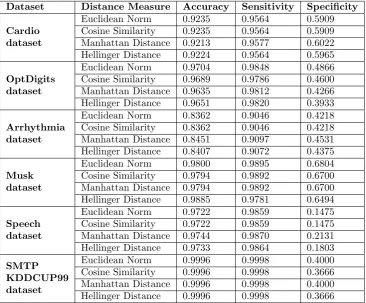
Table 4.3 summarizes the accuracy, sensitivity, and specificity of the proposed solution for each dataset. The results show that the algorithm returns highly accurate results for all the datasets. Specificity is the indicator of algorithm’s capability of identifying the outliers, whereas sensitivity and accuracy are the indicators of algorithm’s capability of identifying normal instances as well as anomalies.
Table 4.4 compares the performance of proposed firefly-optimized algorithm for anomaly detection with state-of-the-art algorithms of anomaly detection viz. K-Means, DBSCAN and LOF. The performance compar-ison is done on the basis of accuracy metric using euclidean distance as similarity measure. From the results, it is obvious that the firefly optimized algorithm is far superior in terms of accuracy. The major reason for superiority of firefly optimized algorithm is that rest of the algorithms are run with random/default parameters whereas firefly algorithm is self-optimizing (it optimizes the neighbourhood radius “r”).
Table 4.3
Performance Metrics
Dataset Distance Measure Accuracy Sensitivity Specificity
Cardio dataset
Euclidean Norm 0.9235 0.9564 0.5909
Cosine Similarity 0.9235 0.9564 0.5909 Manhattan Distance 0.9213 0.9577 0.6022 Hellinger Distance 0.9224 0.9564 0.5965
OptDigits dataset
Euclidean Norm 0.9704 0.9848 0.4866
Cosine Similarity 0.9689 0.9786 0.4600 Manhattan Distance 0.9635 0.9812 0.4266 Hellinger Distance 0.9651 0.9820 0.3933
Arrhythmia dataset
Euclidean Norm 0.8362 0.9046 0.4218
Cosine Similarity 0.8362 0.9046 0.4218 Manhattan Distance 0.8451 0.9097 0.4531 Hellinger Distance 0.8407 0.9072 0.4375
Musk dataset
Euclidean Norm 0.9800 0.9895 0.6804
Cosine Similarity 0.9794 0.9892 0.6700 Manhattan Distance 0.9794 0.9892 0.6700 Hellinger Distance 0.9885 0.9781 0.6494
Speech dataset
Euclidean Norm 0.9722 0.9859 0.1475
Cosine Similarity 0.9722 0.9859 0.1475 Manhattan Distance 0.9744 0.9870 0.2131 Hellinger Distance 0.9733 0.9864 0.1803
SMTP KDDCUP99 dataset
Euclidean Norm 0.9996 0.9998 0.4000
Cosine Similarity 0.9996 0.9998 0.3666 Manhattan Distance 0.9996 0.9998 0.4000 Hellinger Distance 0.9996 0.9998 0.3666
Table 4.4
Performance Comparison with state-of-the-art
Dataset K-Means DBSCAN LOF Firefly
Arrhythmia 0.7351 0.6892 0.8543 0.8362
Cardiotocography 0.7916 0.7495 0.8641 0.9235
Musk 0.8512 0.7718 0.9268 0.9800
Optdigits 0.8648 0.8251 0.9375 0.9704
Speech 0.8922 0.8442 0.9416 0.9722
KDDCup99 0.9448 0.9152 0.9657 0.9996
From the discussions above, it is evident that Manhattan L1-norm is most suitable similarity measure for high-dimensional dataset; and as the algorithm was implemented on Apache Spark, therefore the solution is scalable as well as fast.
The future scope of this work is to use other swarm-intelligence algorithms and find a better alternative to firefly algorithm in terms of convergence speed. Parallelization can be done on platforms like GPU which can possibly speed-up the turnaround time even further.
REFERENCES
[1] C. C. Aggarwal,Outlier analysis, in Data mining, Springer, 2015, pp. 237–263.
[3] M. M. Breunig, H.-P. Kriegel, R. T. Ng, and J. Sander,Lof: identifying density-based local outliers, in ACM sigmod record, vol. 29, ACM, 2000, pp. 93–104.
[4] V. Chandola, A. Banerjee, and V. Kumar,Anomaly detection: A survey, ACM computing surveys (CSUR), 41 (2009), p. 15.
[5] J. Dean and S. Ghemawat,Mapreduce: simplified data processing on large clusters, Communications of the ACM, 51 (2008), pp. 107–113.
[6] D. E. Denning,An intrusion-detection model, IEEE Transactions on software engineering, (1987), pp. 222–232.
[7] M. Ester, H.-P. Kriegel, J. Sander, X. Xu, et al.,A density-based algorithm for discovering clusters in large spatial databases with noise., in Kdd, vol. 96, 1996, pp. 226–231.
[8] A. Koufakou, J. Secretan, J. Reeder, K. Cardona, and M. Georgiopoulos,Fast parallel outlier detection for categorical datasets using mapreduce, in Neural Networks, 2008. IJCNN 2008.(IEEE World Congress on Computational Intelligence). IEEE International Joint Conference on, IEEE, 2008, pp. 3298–3304.
[9] B. Liu, W. Fan, and T. Xiao,A fast outlier detection method for big data, in Asian Simulation Conference, Springer, 2013, pp. 379–384.
[10] R. N. Mantegna,Fast, accurate algorithm for numerical simulation of levy stable stochastic processes, Physical Review E, 49 (1994), p. 4677.
[11] A. W. Mohemmed, M. Zhang, and W. N. Browne,Particle swarm optimisation for outlier detection, in Proceedings of the 12th annual conference on Genetic and evolutionary computation, ACM, 2010, pp. 83–84.
[12] A. Mukhopadhyay, U. Maulik, S. Bandyopadhyay, and C. A. C. Coello,A survey of multiobjective evolutionary algo-rithms for data mining: Part i, IEEE Transactions on Evolutionary Computation, 18 (2014), pp. 4–19.
[13] S. Papadimitriou, H. Kitagawa, P. B. Gibbons, and C. Faloutsos,Loci: Fast outlier detection using the local correlation integral, in Data Engineering, 2003. Proceedings. 19th International Conference on, IEEE, 2003, pp. 315–326.
[14] I. Pavlyukevich, L´evy flights, non-local search and simulated annealing, Journal of Computational Physics, 226 (2007), pp. 1830–1844.
[15] V. K. Vavilapalli, A. C. Murthy, C. Douglas, S. Agarwal, M. Konar, R. Evans, T. Graves, J. Lowe, H. Shah, S. Seth, et al.,Apache hadoop yarn: Yet another resource negotiator, in Proceedings of the 4th annual Symposium on Cloud Computing, ACM, 2013, p. 5.
[16] X.-S. Yang,Firefly algorithm, stochastic test functions and design optimisation, International Journal of Bio-Inspired Com-putation, 2 (2010), pp. 78–84.
[17] X.-S. Yang and S. Deb,Cuckoo search via l´evy flights, in Nature & Biologically Inspired Computing, 2009. NaBIC 2009. World Congress on, IEEE, 2009, pp. 210–214.
[18] M. Zaharia, R. S. Xin, P. Wendell, T. Das, M. Armbrust, A. Dave, X. Meng, J. Rosen, S. Venkataraman, M. J. Franklin, et al.,Apache spark: A unified engine for big data processing, Communications of the ACM, 59 (2016), pp. 56–65.