Available Online at www.ijpret.com 146
INTERNATIONAL JOURNAL OF PURE AND
APPLIED RESEARCH IN ENGINEERING AND
TECHNOLOGY
A PATH FOR HORIZING YOUR INNOVATIVE WORK
A METHOD FOR DETECTING THE DIFFERENCE IN TWO STATES OF BRAIN
USING STATISTICAL ANALYSIS OF EEG RAW DATA
DIGVIJAY S. BANA, KIRAN R. TRIVEDI Shantilal Shah Engineering College, Gujarat Technological University.
Accepted Date: 22/05/2015; Published Date: 01/06/2015
\
Abstract: This paper introduces a method for detecting difference between two brain activities using raw EEG data. One healthy subject participated in the experiment.EEG was measured on the forehead above the eye (FP1 Position) with reference and ground electrode are on the ear clip. The data samples contain readings of duration one minute. Test of equal variances was carried out on the delta and beta high raw EEG data.
Keywords: EEG Data, FP1 Position, Brain Activities
Corresponding Author: MR. DIGVIJAY S. BANA
Access Online On:
www.ijpret.com
How to Cite This Article:
Digvijay S. Bana, IJPRET, 2015; Volume 3 (10): 146-151
Available Online at www.ijpret.com 147 INTRODUCTION
A number of biometrics are being proposed and used in various authentications. It has been proposed to use a brain wave (electroencephalogram: EEG) as a biometrics [1]-[6] . There are various kind of devices through which EEG can be measured. In medical field EEG is measured with many electrodes placed on the scalp [1]-[4], [7]. But placing many electrodes on the scalp requires a considerable amount of time for its set up. So, practically it is not advisable to use EEG device with many electrode for the application like authentication. Here we have used a EEG device with only two electrodes as a result the set up time required is minimum. Moreover the final output of the medical EEG devices does not allow us to carry statistical analysis, while the device used in this experiment provide us with raw EEG data in the form of excel file so that one can carry out the statistical analysis. Electrical changes macroscopically detected on the scalp using an electrode are defined as a brain wave. The brain wave is categorized in five bands: delta (0.5-3Hz), theta (4-7Hz), alpha (8 13Hz), beta (14-30Hz) and gamma (>30Hz), respectively. Depending on different activities of the brain changes occurs on the categorized five bands of EEG. In this paper a statistical test is shown which detects the difference in two mind state (i) Rest State and (ii) Active State. In active state the activity of counting mentally from 100 to 0 is chosen. The statistical analysis is carried out and the observation obtained on the delta and beta high is shown in this paper.
2.Measurement of EEG
Available Online at www.ijpret.com 148 3. Analysis of EEG
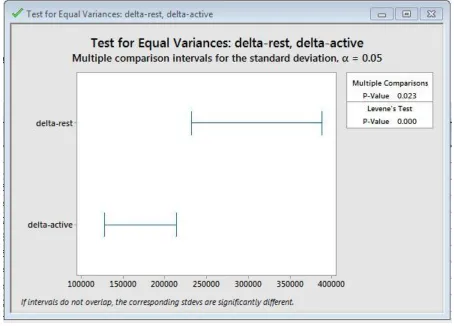
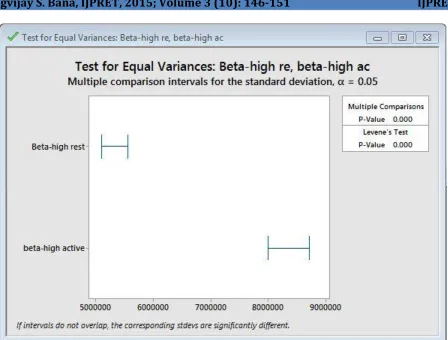
Statistical test of equal variances is carried out on the delta EEG raw data available in form of column in the excel sheet. Six excel sheet data taken in the resting state and six excel sheet data taken in the active state is available. The delta column data and beta-high column data of six excel sheet on resting state each containing 59 samples is taken and one column is formed for delta and one column is formed for beta-high on two different project file of available minitab (trial version) software. Similarly the second column is formed by taking the delta and beta-high column data of six excel sheet on active state on two different project files. On these two column of each project individually test of equal variances is carried out. Multiple comparisons test and Levene’s is used to carry out the test of equal variances in minitab(trial version) software. The mathematical formula for multiple comparisons test is:
Where
ni = the number of observations in sample i
Yil = the l th observation in sample i
mi = the trimmed mean for sample i with trim proportions of
Si = the standard deviation of sample i
The mathematical formula for levene’s test is:
Available Online at www.ijpret.com 149 4. Results of Statistical Analysis
Fig. 1. Result of test of equal variances on delta EEG raw data
Available Online at www.ijpret.com 150 Fig. 2. Result of test of equal variances on beta-high EEG raw data
5. CONCLUSION
In this paper, we have shown that one can detect the difference of the two mind states by carrying out the statistical analysis. Further analysis can also be done by including more and more activities of the brain and detecting the differences in them. Moreover the number of subjects can be increased and the statistical analysis can be carried out. Implementing a practical application by carrying out the statistical analysis of the EEG raw data is a future problem.
6. REFERENCES
1. M. Poulos, M. Rangoussi, V. Chrissikopoulos, A. Evangelou, “Person Identification Based on
Available Online at www.ijpret.com 151
2. M. Poulos, M. Rangoussi, and N. Alexandris, “Neural Networks Based Person Identification
Using EEG Features,” Proc. of ICASSPf99, pp. 1117-1120, 1999.
3. M. Poulos, M. Rangoussi, V. Chissikopoulus, and A. Evangelou, “Parametric Person
Identification from the EEG Using Computational Geometry,” Proc. of the 6th IEEE International Conference on Electronics, Circuits and Systems, pp. 1005-1008, 1999.
4. R. B. Paranjape, J. Mahovsky, L. Benedicent, and Z. Koles, “The Electroencephalogram as a
Biometric,” Proc. of 2001 Canadian Conference on Electrical and Computer Engineering, vol. 2, pp. 1363-1366, 2001.
5. K. V. R. Ravi and R. Palaniappan, “Recognition Individuals Using Their Brain Patterns,” Proc.
of the 3rd International Conference on Information Technology and Applications, 2005.
6. R. Palaniappan, “Identifying Individuality Using Mental Task Based Brain Computer
Interface,” Proc. of the 3rd International Conference on Intelligent Sensing and Information Processing, pp. 239–242, 2005.
7. G. Mohammadi, P. Shoushtari, B. M. Ardekani, M. B. Shamsollahi, “Person Identification by