International Doctorate School in Information and Communication Technologies
DISI - University of Trento
M
INING
H
UMAN
B
EHAVIORS
:
A
UTOMATED
B
EHAVIORAL
A
NALYSIS
FROM
S
MALL TO
B
IG
D
ATA
Jacopo Staiano
Advisor:
Prof. Nicu Sebe
Universit`a degli Studi di Trento
Susan Sontag
Quando penso a Pasolini, a come agiva rispetto alla societ`a, alle cose, mi stimo molto poco. Massimo Troisi
First, I want to thank Nicu for all the support and for believing in me (sometimes even more than I myself did). It was, is, and will be, a great privilege to work under your guidance, to witness the birth and growth of the M-HUG group, and to have you as a great friend. I thank Prof. Theo Gevers, and the friends and former colleagues at the Intelligent Systems Lab of the University of Amsterdam: my experience working there is what actually brought me to push a PhD. Vladimir Nedovic, Roberto Valenti, Ivo Everts, Jose Alvarez and Hamdi Dibeklioglu deserve a special mention.
I am grateful to Prof. Hamid Aghajan at Stanford, for having me as a visiting researcher in the Ambient Intelligence Lab at Stanford. To the 1737 crew, Scott Zimmerman, Handan Selcuk, Sujay and Naveem Vennam, Trip, Cemre and Yesim Ozkurt, Giuseppe “tac” and Flo Valente: no matter how far, we’re connected.
Thanks to Prof. Alex “Sandy” Pentland, for giving me the opportunity of working at the Human Dynamics Lab at MIT in 2011 and 2013, and to Nuria Oliver for having me as intern at Telefonica I+D in Barcellona.
I finally want to thank: Bruno Lepri and Fabio Pianesi for the fruitful (and ongoing) collabo-rations, Marco Guerini, Stefano Teso, Andrea Passerini, Leo Maccari, Elena Pavan, Elisa Ricci, Gabriele Catania, Alex Cappelletti, Maria Menendez, Antonella De Angeli, Matteo Bonifacio, Andrey Bogomolov along with colleagues at DISI and all my coauthors; Gloria, Jasper, Vika, Ram, Julian, and the entire M-HUG group; Manuel, Francesca, Andrea, Mario and Danilo at DISI; the friends at Mozart (RIP), Cafe’ de la Paix, Chinaski, Qub´e Caf´e, RockInCapri, Pis-toiaBlues, NoGuRu; Anna & Mario at Castelli Romani; Riccardo Esposito at My Social Web; all lifelong friends DOP, Antonio “azazel”, Antonio “hope”, Antonio “goodbirds”, Vincenzo “the shell”, Cecco, Graziano, Marcella, Gabriella, Luigi, Ottavio, Colonnesi, Fausto, Mari-alaura, Cekkini, Palillo, Catuogno, the Guardino Bros.
• J Staiano, N Oliver, B Lepri, R de Oliveira, M Caraviello, N Sebe
Money Walks: a Human-Centric Study on the Economics of Personal Mobile Informa-tion[258]
Proceedings of the 2014 ACM Conference on Ubiquitous Computing, ACM UBICOMP 2014;
• J Staiano, M Guerini
Depeche Mood: a Lexicon for Emotion Analysis from Crowd Annotated News[254] The 52nd Annual Meeting of the Association for Computational Linguistics, ACL 2014;
• R Subramanian, Y Yan, J Staiano, O Lanz, N Sebe
On the relationship between head pose, social attention and personality prediction for unstructured and dynamic group interactions[268]
15th International conference on multimodal interaction, ACM ICMI 2013;
• S Teso, J Staiano, B Lepri, A Passerini, F Pianesi
Ego-centric graphlets for personality and affective states recognition[276] International Conference on Social Computing, 874-877, IEEE SocialCom 2013;
• M Guerini, J Staiano, D Albanese
Exploring Image Virality in Google Plus[105]
International Conference on Social Computing, 874-877, IEEE SocialCom 2013;
• MK Abadi, J Staiano, A Cappelletti, M Zancanaro, N Sebe Multimodal Engagement Classification for Affective Cinema[2]
Humaine Association Conference on Affective Computing and Intelligent Interaction, IEEE ACII 2013;
• G Zen, N Rostamzadeh, J Staiano, E Ricci, N Sebe
Friends don’t lie: inferring personality traits from social network structure[255]
Proceedings of the 2012 ACM Conference on Ubiquitous Computing, 321-330, ACM UBICOMP 2012;
• B Lepri, J Staiano, G Rigato, K Kalimeri, A Finnerty, F Pianesi, N Sebe, A Pentland The sociometric badges corpus: A multilevel behavioral dataset for social behavior in complex organizations[165]
International Conference on Social Computing, 623-628, IEEE SocialCom 2012;
• B Lepri, R Subramanian, K Kalimeri, J Staiano, F Pianesi, N Sebe
Connecting Meeting Behavior with Extraversion – A Systematic Study[167] IEEE Transactions on Affective Computing, 2012;
• J Staiano, M Men´endez, A Battocchi, A De Angeli, N Sebe UX Mate: From facial expressions to UX evaluation[257]
Proceedings of the Designing Interactive Systems Conference, 741-750, ACM DIS 2012;
• J Staiano, B Lepri, R Subramanian, N Sebe, F Pianesi
Automatic modeling of personality states in small group interactions[256]
Proceedings of the 19th ACM international conference on Multimedia, 989-992, ACM
MM 2011;
• H Joho, J Staiano, N Sebe, JM Jose
Looking at the viewer: analysing facial activity to detect personal highlights of multime-dia contents[137]
Multimedia Tools and Applications, 51(2):505-523, 2011;
• B Lepri, R Subramanian, K Kalimeri, J Staiano, F Pianesi, N Sebe
Employing social gaze and speaking activity for automatic determination of the extraver-sion trait[166]
International Conference on Multimodal Interfaces and the Workshop on Machine Learn-ing for Multimodal Interaction, ACM ICMI 2010;
• R Subramanian, J Staiano, K Kalimeri, N Sebe, F Pianesi
This research thesis aims to address complex problems in Human Behavior
Understanding from a computational standpoint: to develop novel methods for enabling machines to capture not only what their sensors are perceiving but also how and why the situation they are presented with is evolving in a certain manner.
Touching several fields, from Computer Vision to Social Psychology through Natural Language Processing and Data Mining, we will move from more to less constrained scenarios, describing models for automated behavioral analysis
1 Introduction 1
1.1 The Context . . . 2
1.2 Structure of the Thesis . . . 5
2 Deriving and Exploiting Behavioral Insights at Individual Level 11 2.1 Analysing Facial Activities to Detect Personal Highlights of Videos . . . 12
2.1.1 Affective Video Summarisation . . . 14
2.1.2 Facial Expression Recognition System . . . 18
2.1.3 Analysis . . . 23
2.1.4 Results and Discussion . . . 28
2.1.5 Conclusions and Future Work . . . 33
2.2 From Facial Expressions to UX evaluation . . . 34
2.2.1 State of the Art . . . 35
2.2.2 UX Mate . . . 38
2.2.3 Pilot Study . . . 42
2.2.4 Validation Study . . . 49
2.2.5 Conclusions . . . 54
3.1.2 ’Mission Survival’ Meeting Videos . . . 61
3.1.3 Inferences from Ground-Truth . . . 62
3.1.4 Automated Social Attention Estimation . . . 66
3.1.5 Conclusions . . . 70
3.2 Automatic Modeling of Personality States in Small Group In-teractions . . . 70
3.2.1 Data and Experimental Setup . . . 73
3.2.2 Feature Extraction . . . 74
3.2.3 Feature Selection . . . 76
3.2.4 Automatic Recognition of Personality States . . . 77
3.2.5 Results and Discussion . . . 79
4 Into the Wild: Implicit Behavioral Patterns Emerging in a Technology-Mediated and Inter-Connected Society 81 4.1 Inferring Personality Traits from Social Network Structure . . . 83
4.1.1 Related Works . . . 85
4.1.2 Dataset . . . 88
4.1.3 Extraction of Network Characteristics . . . 91
4.1.4 Automatic Prediction of Personality Traits . . . 97
4.1.5 Discussion and Comparison with Previous Works . . . . 105
4.1.6 Practical Implications and Limitations . . . 107
4.1.7 Conclusions . . . 108
4.2 A Multilevel Behavioral Dataset for Social Behavior in Com-plex Organizations . . . 109
4.2.1 Collection Methodology . . . 112
4.2.2 Data Collected: Personal and Situational Data . . . 114
4.2.3 Data Collected: Digital Data . . . 116
4.3 Ego-Centric Graphlets for Personality and Affective States
Recog-nition . . . 123
4.3.1 Related Works . . . 125
4.3.2 Dataset . . . 126
4.3.3 Graphlet-based Approach . . . 127
4.3.4 Experimental Setup . . . 128
4.3.5 Experimental Results . . . 129
4.3.6 Conclusion . . . 132
4.4 A Human-Centric Study on the Economics of Personal Mobile Data . . . 133
4.4.1 Related Work . . . 135
4.4.2 Methodology . . . 138
4.4.3 Collected Data . . . 140
4.4.4 Data Statistics . . . 147
4.4.5 Data Analysis . . . 150
4.4.6 Insights from the EoS survey . . . 156
4.4.7 Discussion and Implications . . . 158
4.4.8 Conclusion . . . 162
5 Harvesting the Wild Wild (and Social) Web 165 5.1 Exploring Image Virality in Google Plus . . . 166
5.1.1 Related Works . . . 166
5.1.2 Data Description . . . 168
5.1.3 Data Analysis . . . 172
5.1.4 User Analysis . . . 186
5.1.5 Conclusions . . . 188
5.2.3 Emotion Lexicon Creation . . . 195 5.2.4 Experiments . . . 197 5.2.5 Conclusions . . . 200
6 Conclusions 201
Introduction
Humans are social by nature, machines are asocial by design. To bridge this gap, it is desirable to build systems able to correctly interpret social interactions between humans, and thus exploit forms ofAutomatic Human Behavior Under-standing. As computing becomes ubiquitous and the number of available sen-sors increases, researchers can mine and exploit the huge amount of behavioral data produced by people in their everyday lives, in order to build behavioral models and gain valuable insights from collective and individual perspectives.
This thesis elaborates methods forAutomatic Human Behavior Understand-ingin two interaction scenarios: the first, ”classic”, scenario including situations in which sensor(s) and subject(s) share the same physical space (e.g. a user in-teracting with a machine, as well as subjects participating in a meeting, having a coffee break, etc); the second, extending the former by exploiting situations in which people interact by means of ubiquitous devices: the sensors lie in the physical dimension of each individual engaging into forms of physical and/or virtual interaction with other people.
subject, that is characteristic of the specific situation the subject finds herself in: “what I do depends on what is happening around me”.
Previous research has extensively shown that such internal determinants of behavior, or feelings, are often manifested through very short and unconscious body movements: from facial expressions to back-channeling gestures (e.g. fid-geting), we all use such social signals to interpret others’ behavior and tune, in turn, ours. We thus apply computer vision and speech processing techniques to automatically detect such events on which our behavioral models are built.
Furthermore, drawing from extensive literature in Social Psychology, where personalityis recognized as being a causal determinant of people’s behavior, our research focuses on building personality based behavioral models. Such models will ultimately allow design and deployment of proactive systems in heteroge-neous contexts, including, but not limited to, Surveillance, Health-Care, User eXperience, Human Resources Selection, Tutoring, Targeted Marketing.
1.1
The Context
Aristotle’s definition of humans as social animals has persisted during the cen-turies and entered as common knowledge: such companionable animals, as Dante Alighieri calls them, are characterized by an innate tendency (what Karl Marx referred to as Gemeinwesen [186]) to form groups, interact with the en-vironment, collaborate toward reaching common goals and improve their com-munity’s conditions. Exploiting recent advances in the fields of Computer Vi-sion, Machine Learning, Natural Language and Speech Processing, Network and Data Science, along with the increase in computational power of mod-ern microprocessors, a novel and promiscuous research field has been lately emerging and gaining interest among researchers: Computational Social Sci-ence, leveraging the capacity to collect and analyze data with unprecedented
This research thesis aims to address complex problems in Human Behav-ior Understandingfrom a computational standpoint: to develop novel methods for enabling machines to capture not onlywhat their sensors are perceiving but also how and why the situation they are presented with is evolving in a cer-tain manner. We endorse a interactionist [171, 90] approach to human behavior analysis, considering behavior as a function of both the person and his/her en-vironment; in other terms, we embrace both the situationist theory of “people responding to an environment that consists of other people responding totheir environment, which consists of people responding to an environment of peo-ple’s responses” [243], and the classical person-perspective which sees individ-ual characteristics as principal determinants of behavior.
In this framework, internal determinants of behavior such as personality traits, psycho-pathological risk factors, and other individual predispositions,
are treated as dynamically evolving attributes under the influence of external determinants such as situational and structural attributes of the environment a person is behavingwithin.
hypothesis [14,166,182,183,204,205,222].
Recently, a dynamic view of personality traits has been proposed [84], sug-gesting that traits can be reconstructed through density distributions of person-ality states. In other words, personality states can be seen as specific behavioral episodes in which a subject behaves more or less extrovertly, neurotically, and so on.
Thus, in order to capture, interpret, and/or induce change to, behaviors of people or groups of, it seems necessary to identify important constituents of be-havior such as personality states and, at the same time, recognize how change in the environment and such constituents mutually influence each other.
Depending on scale and context of the environment in which a system of inter-actions is taking place, different strategies can be adopted; expert humans are, in fact, trained to exploit such internal determinants by driving people in certain di-rections and analysing their micro-behaviors: influential recent works [80,219] provide evidence of hard-to-fake perceptual cues that can be systematically treated, hence potentially exploitable by a machine.
Consider, for instance, a standard human resources selection task: the re-cruiters, after screening the applicants’ curricula and selecting a dozen of them, set a meeting in their offices. Once the candidates are gathered around a ta-ble, the recruiters drive them into predefined discussions to analyze their be-haviors while engaging with others, and to derive information on their psycho-attitudinal profiles. Finally, the candidates are singularly interviewed. Since the biggest source of information for the recruiter is the non-verbal behavior of the subject, we can postulate that a machine equipped with the necessary sensors (such as webcams and microphones), and trained for the task, might be able to exploit the very same cues in order to select the best applicant for the position.
by orders of magnitude, maximizing reach and information flow. Such re-shaping brought dramatic positive effects (e.g. innovation, faster response to events, etc.) along with side-effects such as information overload, and pervasive surveillance. Everyone of us, in this very moment, is producing valuable data through a smart-phone (by all means, apersonal tracking device). Providers of software, connectivity, and some times even hardware are creating value from personal data, following a business model based on data centralization and sep-aration on the one hand, and customer profiling and targeted advertising on the other. The result, nowadays, is that big silos of personal information have been built and monetized, in a centralized fashion, by those who control the infras-tructure used to gather, store, and mine such data.
In Chapters 4 and 5 we present a few works that show how informative such digital breadcrumbscan be, while in Chapter 6 we will elaborate on the world-changing impact technologies built for cooperation in a decentralized fashion can have.
1.2
Structure of the Thesis
This thesis is structured as follows: in Chapter 2 we report the state of the art and present our contributions in modeling human behavior within the Human Computer Interaction (HCI) scenario; in Chapter 3 we describe relevant and related works dealing with human behavior understanding in social contexts, and detail our work and the advancements obtained; in Chapter 4 we enlarge the scope of our analyses to the least controlled scenarios, using wearable sensors and smartphones as primary sensing infrastructure to gather information about collective and individual behaviors.
More specifically, this thesis develops and is organized under the metaphor of a magnifying glass: we start at the individual scale, focusing on the analysis of a single person interacting with technology [257] (Section 2.2) or enjoying multimedia content [137] (Section 2.1); then, we zooms out, widening the field of view to include more people physically interacting with each other in sce-narios with varying constraints: specifically a meeting room first [267, 256] (Sections 3.1 and 3.2) , a whole building [165, 276] (Sections 4.2 and 4.3), and communities of people transparently sensed through their own smartphone devices [255] (Sections 4.1 and 4.4); in the latter stage, further widening our scope, all connections to the physical world are abandoned from the sensing point of view and behavioral dynamics appearing in a purely virtual domain such as internet are analyzed [105] (Sections 5.1 and 5.2).
Thus, at each zoom out step, behavioral modeling is applied to increasingly large groups of people in settings with decreasing levels of control.
This thesis consists of the following publications:
• Chapter 2:
– H Joho, J Staiano, N Sebe, JM Jose
Looking at the viewer: analysing facial activity to detect personal
highlights of multimedia contents[137]
Multimedia Tools and Applications, 51(2):505-523, 2011; – J Staiano, M Men´endez, A Battocchi, A De Angeli, N Sebe
UX Mate: From facial expressions to UX evaluation [257]
Proceedings of the Designing Interactive Systems Conference, 741-750, ACM DIS 2012.
• Chapter 3:
– R Subramanian, J Staiano, K Kalimeri, N Sebe, F Pianesi
meetings[267]
Proceedings of the international conference on Multimedia, 659-662, ACM MM 2010;
– J Staiano, B Lepri, R Subramanian, N Sebe, F Pianesi
Automatic modeling of personality states in small group interactions[256] Proceedings of the 19th ACM international conference on Multime-dia, 989-992, ACM MM 2011.
• Chapter 4:
– J Staiano, B Lepri, N Aharony, F Pianesi, N Sebe, A Pentland
Friends don’t lie: inferring personality traits from social network
structure[255]
Proceedings of the 2012 ACM Conference on Ubiquitous Computing, 321-330, ACM UBICOMP 2012;
– B Lepri, J Staiano, G Rigato, K Kalimeri, A Finnerty, F Pianesi, N Sebe, A Pentland
The sociometric badges corpus: A multilevel behavioral dataset for social behavior in complex organizations[165]
International Conference on Social Computing, 623-628, IEEE So-cialCom 2012;
– S Teso, J Staiano, B Lepri, A Passerini, F Pianesi
Ego-centric graphlets for personality and affective states recognition[276] International Conference on Social Computing, 874-877, IEEE So-cialCom 2013;
– J Staiano, N Oliver, B Lepri, R de Oliveira, M Caraviello, N Sebe Money Walks: a Human-Centric Study on the Economics of Personal Mobile Information [258]
ACM UBICOMP 20141.
• Chapter 5:
– M Guerini, J Staiano, D Albanese
Exploring Image Virality in Google Plus [105]
International Conference on Social Computing, 874-877, IEEE So-cialCom 2013;
– J Staiano, M Guerini
Depeche Mood: a Lexicon for Emotion Analysis from Crowd
Anno-tated News[254]
(The 52nd Annual Meeting of the Association for Computational Lin-guistics, ACL 2014).
The following papers have been published during the course of the Ph.D. but are not included in this thesis:
• B Lepri, R Subramanian, K Kalimeri, J Staiano, F Pianesi, N Sebe
Employing social gaze and speaking activity for automatic determination of the extraversion trait [166]
International Conference on Multimodal Interfaces and the Workshop on Machine Learning for Multimodal Interaction, ACM ICMI 2010;
• B Lepri, R Subramanian, K Kalimeri, J Staiano, F Pianesi, N Sebe
Connecting Meeting Behavior with Extraversion – A Systematic Study[167] IEEE Transactions on Affective Computing, 2012;
• G Zen, N Rostamzadeh, J Staiano, E Ricci, N Sebe
Enhanced semantic descriptors for functional scene categorization [317] 21st International Conference on Pattern Recognition, ICPR 2012;
• MK Abadi, J Staiano, A Cappelletti, M Zancanaro, N Sebe Multimodal Engagement Classification for Affective Cinema [2]
Humaine Association Conference on Affective Computing and Intelligent Interaction, IEEE ACII 2013;
• R Subramanian, Y Yan, J Staiano, O Lanz, N Sebe
On the relationship between head pose, social attention and personality prediction for unstructured and dynamic group interactions [268]
Deriving and Exploiting Behavioral
Insights at Individual Level
In this chapter, we report two original deployments of web-cam based sensing systems and their validation:
• an approach to detecting personal highlights in videos based on an analysis of facial activities;
• an ecologically valid vision-based system for automatic User eXperience (UX) evaluation.
Secondly, we propose and evaluate UX Mate, a non-invasive system for the automatic assessment of user experience (UX). In addition, we contribute a novel database of annotated and synchronized videos of interactive behavior and facial expressions.
UX Mate is a modular system which tracks facial expressions of users, in-terprets them based on pre-set rules, and generates predictions about the occur-rence of a target emotional state, which can be linked to interaction events. The system simplifies UX evaluation providing an indication of event occurrence. UX Mate has several advantages compared to other state of the art systems: easy deployment in the user’s natural environment, avoidance of invasive de-vices, and extreme cost reduction. We report a pilot and a validation study on a total of 46 users, where UX Mate was used for identifying interaction difficul-ties.
The studies show encouraging results that open possibilities for automatic real-time UX evaluation in ecological environments.
2.1
Analysing Facial Activities to Detect Personal Highlights
of Videos
The explosion of multimedia contents and the need for effective access have resulted in the development of a number of video summarisation techniques. Video summaries are needed in many situations. For example, such a summary could be useful for getting a gist of the video content. Summaries can also support the end-user’s decision-making to view the entire video (e.g., films) or not. The results of such decision making can then be used for modelling the user preference. This also suggests that the techniques developed for video summari-sation can be related to a task of user profiling and/or personal recommendation of unseen videos.
dimen-sions: content type (feature based, object based, event based, and perception based), personalisation (personalised, generic), and interactivity (interactive, static). Techniques such as shot boundary detection and keyframe extraction are the basis of the feature based summaries which have been extensively in-vestigated [111]. This type of summaries is not designed to consider semantics of video contents. The summaries investigated in evaluation forums such as TRECVID [210] tend to be object based or event based summaries. Such a summary consists of unique scenes of an object such as “antique car” or an ob-ject in the context of an event “red hot air balloon ascending”. These types of summaries are designed to present a gist of contents based on the main objects and events within a video. However, the feature based and object/event based approaches tend to suffer from the semantic gap problem in interactive use of such summaries.
Recently, there has been a growing interest in perception based summaries. These look at a higher level of abstraction than the other types of summaries by exploiting viewer’s affective state, perceived excitement, and attention found within or caused by video contents [196], [136]. Perception based approaches are designed to overcome the semantic gap problem in summarisation by find-ing affective scenes in videos. Another prospect of the perception based sum-marisation is the application of creating the personalised summaries. Since the affective scenes in videos are subjective, and hence, can vary across viewers, personalised summaries that are tailored to one’s preference can be generated from the same video. However, this area has not been fully exploited, and ex-isting techniques to generate perception based summaries are expensive. For example, they require manual annotations [277] or several physiological sen-sors [196, 197] to capture people’s affective state.
emotion inferred from a classification of multiple motion vectors. The two con-cepts will be explained in more detail later.
The rest of this section is structured as follow. We first review the work on affective video analysis and summarisation. Then we briefly present the facial expression recognition system. The data collection method and evaluation mea-surement are then described, followed by the results of analysis and discussion. We conclude the paper by discussing some directions of future work.
2.1.1 Affective Video Summarisation
Annotation according to affective or emotional categories of video is a relatively young domain, gaining more and more importance [37, 110, 112, 145, 194,
295, 314]. The main objective is to make the recommendation personalized and situation sensitive. If the affective content of a video is detected, it will be very easy to build an intelligent video recommendation system, which can recommend videos to users based on users’ current emotion and interest. For example, when the user is sad, the system will automatically recommend happy movies to him/her; when the user is tired, the system may suggest a relaxing movie.
All the current affective analysis systems try to solve the following prob-lems [295]: 1) identification of valid affective features; 2) bridging the gap be-tween affective features and affective states; 3) establishing an affective model to take user’s personality into consideration; 4) representing the affective state.
of a significant event”, “surprise followed by a sustained alarm”, and “build-ing apprehension up to a climax”. They find that these four sound energy events convey well established meanings through their dynamics to portray and deliver certain affect or sentiment related to the horror film genre. Kang et al. [145] de-tect emotional events such as fear, sadness and joy from videos by computing intra-scene context (shots’ coherences, shot’s interactions, dominant features in color and motion information) and inter-scene context (scene’s relationship with other scenes). Xu et al. [314] identify video/audio segments which make audi-ence laugh in comedy and scary segments in horror films as affective contents. They use Hidden Markov Models (HMM) based audio classification method to detect audio emotional events (AEE) such as laughing, horror sounds, etc. Then, they use the AEE as a clue to locate the corresponding video segment.
of activation of the emotion, and Dominance describes the level of attention or rejection of the emotion. Based on P-A-D model, Arifin et al. [16] propose to use Dynamic Bayesian Networks (DBNs) to build up a P-A-D value estimator, which estimates the P-A-D values of the video shots of the input video. Then, the video can be segmented based on the estimated P-A-D content. Different from the Arousal and Valence modeling proposed by Hanjalic and Xu [112], this work takes the influences of former emotional events and larger emotional events into consideration.
The third type of affective analysis method is Personalized Affective Con-tent Analysis method. The representative work is reported in [295], which introduces more personalization factors into affective analysis and apply this to Music Video (MV) retrieval. First, they build a user interface and record the users’ feedback in the user profile database. Each profile records MV’s ID, user’s descriptions about MV’s Arousal and Valence (two scores describing their opinions about Arousal and Valence level). When users play MV, they can also use feedback to change their opinions on MV at any time. Based on the users’ profile, two Support Vector Regression (SVR) models (Arousal model and Valence model) are trained to fit the user’s affective descriptions. Finally, the affective features extracted from MV are fed into the trained models to get the personalized affective states. The authors also provide a novel Affective Vi-sualization interface for efficient and user-friendly MV retrieval. Through this interface, the user can easily log into the system, search MV based on their af-fective states (for example, anger, happy, sad/blue, or peaceful) and also provide his/her feedback on each MV.
Directly relevant to our present work, Money and Agius [195] provide a taxonomy of video summaries and their generation techniques based on an ex-tensive literature survey. We use their taxonomy to discuss existing work on video summarisation and relate our work to them.
summarisation. Internal summarisation techniques analyse internal informa-tion from video streams produced during the producinforma-tion stage of video contents. More specifically, they tend to use low-level image, audio, and text features of videos. Externalsummarisation techniques analyse external information which can be obtained from the process of capturing, producing, or viewing videos. External summarisation techniques are further divided into User-based infor-mation and Contextual information sources. User-based information typically includes people’s behaviour during the interaction with video contents. This also includes people’s preference information. The user-based information can be obtained in an obtrusive way using explicit feedback or in an unobtrusive way using various sensors. While unobtrusive methods are generally preferred, they tend to be noisy and limited in the level of details [195]. An example of the contextual information is the geographical footprints of videos using a GPS facility equipped with a video camera.
Both internal or external information have been exploited for affective video summarisation. The examples of internal information are Hanjalic and Xu [112] (discussed above) and Chan and Jones [41]. Chan and Jones [41] present a prototype system for affect-based indexing and retrieval of films, which is based on audio feature extraction. By analyzing all the audio data (speech, music, special effects and silence), the authors extracted the continuum of arousal and valence within the time dimension and used it to develop an affect annotation scheme.
external information. Soleymani, et al. [252] proposed a method for affec-tive ranking of movie scenes, which takes into account both user emotions as well as video content. User emotion behaviour was inferred based on evidence gathered from the measurements of five peripheral physiological signals (gal-vanic skin response, electromyogram, blood pressure, respiration pattern and skin temperature), as well as self-assessments. In addition, the movie scenes were analysed using various video and audio features, which portrayed signifi-cant events within those scenes.
The approach investigated in this paper belongs to the group of Categori-cal Affective Analysis and can be seen as an external summarisation technique using user-based information. More specifically, we exploited viewer’s facial expression while watching videos to find affective scenes for summarisation. Our information source (i.e., facial expression) was obtained in an unobtru-sive way. This has a potential to make our approach simpler, more practical, and more feasible when compared to other approaches which exploited physi-ological signals of viewers. For example, in Money and Agius [196], subjects were wrapped by a sensor belt around their chest, a watch-type device was put around a wrist, and other signals were captured from several finger tips, and finally, their arm was rested on a cushion on the table. On the other hand, our approach required only a conventional web camera with which most recent PCs and laptops are equipped.
The next subsections describe our system and the method to generate affec-tive summaries by exploiting viewer’s facial expressions.
2.1.2 Facial Expression Recognition System
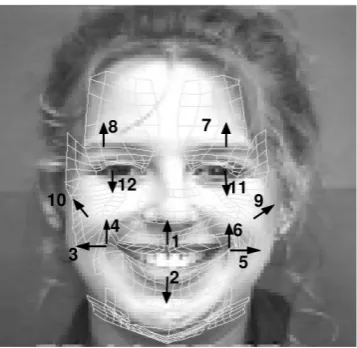
Figure 2.1: A snap shot of our realtime facial expression recognition system. On the left side is a wireframe model overlaid on a face being tracked. On the right side the correct expression, Angry, is detected.
describe the components of the system in the following sections. A snap shot of the system, with the face tracking and recognition result is shown in Figure 2.1.
Face and facial feature tracking
The face tracking technique used in our system is an improved version of the system developed by Tao and Huang [274] called the piecewise Bezier volume deformation (PBVD) tracker. Our face tracker uses a model-based approach where an explicit 3D wireframe model of the face is constructed (see Fig. 2.1). A generic face model is warped to fit the detected facial features. The face model consists of 16 surface patches embedded in Bezier volumes. The surface patches defined this way are guaranteed to be continuous and smooth.
Figure 2.2: The facial motion measurements.
2D image motions are modelled as projections of the true 3D motions onto the image plane. From the 2D motions of many points on the mesh, the 3D motion can be estimated by solving an overdetermined system of equations of the projective motions in the least squared sense.
The recovered motions are represented in terms of magnitudes of some pre-defined motion of various facial features. Each feature motion corresponds to a simple deformation on the face, defined in terms of the Bezier volume control parameters. We refer to these motions vectors as Motion-Units (MUs). Note that they are similar but not equivalent to Ekman’s AU’s [79] and are numeric in nature, representing not only the activation of a facial region, but also the direction and intensity of the motion.
Learning the “structure” of the facial features
The use of Bayesian networks as the classifier for recognising facial expressions was suggested by Chen et al. [42] and [50], who used Naive Bayes (NB) clas-sifiers and who recognised the facial expressions from the same MUs. When modelling the described facial motion features, it is very probable that the con-ditional independence assumption of the Naive Bayes classifier is incorrect. As such, learning the dependencies among the facial motion units could potentially improve classification performance, and could provide insights as to the “struc-ture” of the face, in terms of strong or weak dependencies between the different regions of the face, when subjects display facial expressions.
In our approach, instead of trying to estimate the best a-posteriori probability, we try to find the structure that minimises the probability of classification error directly. The basic idea of this approach is that, since we are interested in find-ing a structure that performs well as a classifier, it would be natural to design an algorithm that uses classification error as the guide for structure learning. Consequently, we further leveraged on two properties of semi-supervised learn-ing: (1) the unlabeled data can indicate incorrect structure through degradation of classification performance, and (2) the classification performance improves with the correct structure. Thus, a structure with higher classification accuracy over another structure indicates an improvement towards finding the optimal classifier. The details of our analysis were presented in [51] and here we only briefly review the important issues that support understanding the classification component of our system.
algorithm would likely find a local minimum because of the size of the search space. The solution followed in our system is the stochastic structure search (SSS) algorithm [51].
First it is necessary to define a measure over the space of structures which we want to maximise:
Definition The inverse error measure for structureS′ is
inve(S′) =
1
pS′(ˆc(X)̸=C)
∑
S
1
pS(ˆc(X)̸=C)
, (2.1)
where the summation is over the space of possible structures, X represents the MU’s vector, C is the class space, ˆc(X) represents the estimated class for the vector X, and pS(ˆc(X) ̸= C) is the probability of error of the best classifier
learned with structure S.
We used Metropolis-Hastings sampling to generate samples from the inverse error measure, without having to ever compute it for all possible structures. For constructing the Metropolis-Hastings sampling, we defined a neighbourhood of a structure as the set of directed acyclic graphs to which we can transit in the next step. Transition is done using a predefined set of possible changes to the structure; at each transition a change consists of a single edge addition, removal, or reversal. We defined the acceptance probability of a candidate structure,
Snew, to replace a previous structure, St as follows:
min
(
1,
(
inve(Snew)
inve(St)
)1/T
q(St|Snew)
q(Snew|St)
)
= min
(
1,
(
pSt
pSnew
)1/T
Nt
Nnew
)
(2.2) where q(S′|S) is the transition probability from S to S′ and Nt and Nnew are
a Markov chain which is aperiodic and irreducible, thus satisfying the Markov chain Monte Carlo (MCMC) conditions [180]. T is used as a temperature factor in the acceptance probability.
Roughly speaking, T close to 1 allows acceptance of more structures with higher probability of error than previous structures while T close to 0 mostly allows acceptance of structures that improve probability of error. Additionally, a fixed T amounts to changing the distribution being sampled by the MCMC, while a decreasing T is a simulated annealing run, aimed at finding the max-imum of the inverse error measures. The rate of decrease of the temperature determines the rate of convergence. Asymptotically in the number of data, a logarithmic decrease of T guarantees convergence to a global maximum with probability that tends to one.
The SSS algorithm, with a logarithmic cooling schedule T, finds a structure that is close to minimum probability of error. We estimate the classification error of a given structure using the labelled training data. Therefore, to avoid overfitting, we added a multiplicative penalty term derived from the Vapnik-Chervonenkis (VC) bound on the empirical classification error. This penalty term penalises complex classifiers thus keeping the balance between bias and variance (for more details we refer the reader to [51]).
Please note that we decided to use this particular tracker due to its proven robustness and its ability to cope with non-frontal faces (up to 30% in head pose change). There were several other alternatives, mostly based on AAM (see for example [269] or [43]) but these systems require training and have difficulties in coping with the situations that were not present in the training set.
2.1.3 Analysis
Figure 2.3: Recording facial expressions of a viewer (Left) watching a video clip (Right).
Participants and video clips
Ten people, all employees in the same software development company (holding different positions) agreed to participate in the experiment. Out of the ten, five were female and five were male. All participants were between the ages of 24 and 43, and were free from any obvious physical or sensory impairment. We used eight video clips taken from the contents in different genres. The code, duration, and brief description of the video clips, are given in Table 2.1. All videos had 25 frames per second.
Table 2.1: Description of video clips
Code Length Description
Video.1 01:43.5 Promotion Video of a pop song. Most parts are slow scenes where a singer is walking downtown while singing. There is a colour effect on the picture which tones the colours to green and yellow.
Video.2 01:20.0 Documentary of a man with physical impairment demonstrating day-to-day activities. Calm background music with no speech. Visually similar across the clip. A short subtitle at the beginning introducing the contents.
Video.3 01:36.4 Documentary of people with physical impairment. Scenes of dancing with a wheelchair (First half) and travelling to the river (Last half). Calm background music with no speech (Similar to Video.2). A short subtitle at the beginning introducing the contents.
Video.4 00:39.0 Comical TV commercial of a beer. Night scenes and inside scenes with background noise of insects. Speech from three people and narrator at the end. No music. Two scenes were interwoven.
Video.5 04:29.2 A car chase scene from an action film. Upbeat background music with many sound effects of siren, scratching tires, crash, etc. Speech from four people. Many fast moving short shots.
Video.6 04:48.2 Scenes from a comedy drama film. Two scenes were interwoven: a talkshow with one presenter, five guests on the stage, and large audi-ence; and a scene introducing the background of the main character. Mainly speech with many short shots.
Video.7 04:43.4 An action scene at night from a Sci-Fi film. Two groups of people are shooting and fighting. Many sound effects (guns, helicopter, breaking glasses, etc.) but no background music. Some shouts and screams in fast moving shots.
0 500 1000 1500 2000 2500 Frame Vi e w e r ID 1 2 3 4 5 6 7 8 9 1 0 (a) Video.1
0 500 1000 1500 Frame Vi e w e r ID 1 2 3 4 5 6 7 8 9 1 0 (b) Video.2
0 500 1000 1500 Frame Vi e w e r ID 1 2 3 4 5 6 7 8 9 1 0 (c) Video.3
0 500 1000 1500 Frame Vi e w e r ID 1 2 3 4 5 6 7 8 9 1 0 (d) Video.4
0 1000 2000 3000 4000 5000 6000 Frame Vi e w e r ID 1 2 3 4 5 6 7 8 9 1 0 (e) Video.5
0 1000 2000 3000 4000 5000 6000 Frame Vi e w e r ID 1 2 3 4 5 6 7 8 9 1 0 (f) Video.6
0 1000 2000 3000 4000 5000 6000 7000 Frame Vi e w e r ID 1 2 3 4 5 6 7 8 9 1 0 (g) Video.7
0 2000 4000 6000 8000 10000 Frame Vi e w e r ID 1 2 3 4 5 6 7 8 9 1 0 (h) Video.8
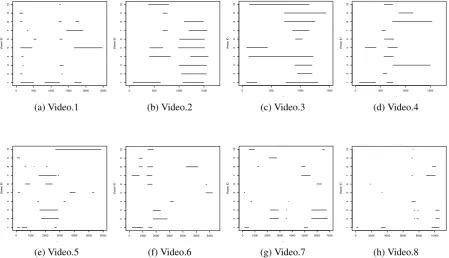
Figure 2.4: Annotation of personal highlights (Video.1 to Video.8)
Highlight annotations
We obtained the manual annotations of highlight scenes from participants to evaluate the effectiveness of facial motion units. After the end of a video clip, participants were presented with a simple video annotation tool where they could select parts of video clips. Participants were allowed to annotate as many separate scenes as they found it necessary as highlights. The results of the man-ual annotation can be found in Figure 2.4, where the X-axis represents the frame number of video clips and Y-axis represented the viewer ID. Note that the frame length denoted by the X-axis varies across the video clips.
(a) Original Data (b) Kaiser Window
Figure 2.5: Effect of Kaiser Window on MU1 feature.
between 1000 and 1500, one of the people skillfully folded a piece of paper using their feet. Most viewers selected this scene as the highlight of the video clip. However, such consensus did not appear to be common in most of the rest of videos. This observation is important since this suggests that people can find different parts of videos as the highlight, which is the major assumption made in this paper.
Facial features
We analysed a total of 20 facial features in this study. They included 12 motion units (denoted as MU1 to MU12), a combination of the 12 vectors (denoted as MU1-12), and 7 facial expression categories (Scared, Angry, Disgusted, Happy, Neutral, Sad, and Surprised). For each of the facial activity videos, a vector value of motion or probability of emotion categories were produced by the methods described in Section 2.1.2. We then applied a Kaiser Window pro-cess on the outputs of facial features in a similar fashion to [112]. The effect of smoothing on the original data can be found in Figure 2.5.
motion or high probability of emotion category to detect personal highlights of videos. Therefore, we see this as a ranking problem where the video frames are ordered by the vector value or category probability. Consequently, we used a scoring function called Average Precision [122, 290] to measure the effec-tiveness of facial features for personal highlight detection. Average Precision,
AvgP, is one of the major performance measures in the field of Information Retrieval, and it is calculated in the following manner:
AvgP =
∑N
r=1P(r)
H (2.3)
P(r) = h(r)
r (2.4)
where r is the ranking position of a frame, N is the ranking position of the lowest ranked highlight frame,h(r)is the total number of highlight frame found up to the rank r, P(r) is the precision at the rank r, and H is the total number of highlight frames annotated by individual participants.
2.1.4 Results and Discussion
This section reports the results of the analysis and discusses the implications of our findings on the design of personal highlights detection technologies for video contents.
Facial activity
features are divided into four parts: Mouth, Cheeks, Eyes, and all. We consider the mouth as the lower part of human face and the cheeks and eyes as the upper part of the face.
Table 2.2: Mean Average Precision of motion vectors. Those highlighted in bold are the best performance in individual viewers.
Facial MU Viewer
Part ID 1 2 3 4 5 6 7 8 9 10
Mouth 1 .220 .098 .166 .116 .150 .058 .097 .186 .103 .121
2 .278 .104 .172 .220 .135 .096 .083 .233 .073 .111
3 .325 .113 .171 .098 .171 .059 .138 .162 .135 .122
4 .192 .078 .208 .075 .088 .059 .139 .103 .118 .090
5 .175 .072 .127 .099 .095 .050 .097 .149 .055 .131
6 .187 .134 .225 .108 .097 .068 .103 .122 .130 .109
Cheeks 9 .195 .097 .197 .148 .121 .092 .079 .145 .087 .075
10 .325 .139 .150 .223 .264 .065 .094 .176 .059 .093
Eyes 7 .147 .090 .129 .091 .097 .143 .132 .198 .200 .118
8 .404 .104 .130 .163 .251 .072 .088 .145 .071 .089
11 .316 .101 .155 .077 .337 .094 .104 .169 .172 .078
12 .302 .148 .145 .078 .207 .066 .163 .145 .177 .096
All 1-12 .240 .127 .123 .078 .090 .051 .102 .135 .052 .095
individual preferences. Finally, the performance of MU1-12 suggests that a simple addition of all motion vectors was not sufficient for accurate estimation of personal highlights.
Table 2.3: Mean Average Precision of emotion categories. Those highlighted in bold are the best performance in individual viewers.
Emotion Viewer
ID 1 2 3 4 5 6 7 8 9 10
Afraid .228 .094 .137 .077 .145 .046 .078 .211 .062 .086
Angry .225 .149 .187 .071 .174 .051 .119 .144 .049 .089
Disgusted .336 .144 .264 .077 .147 .042 .127 .127 .195 .091
Happy .238 .101 .208 .086 .099 .050 .107 .170 .041 .069
Neutral .256 .224 .233 .104 .234 .183 .086 .152 .143 .307
Sad .296 .134 .210 .100 .122 .044 .107 .161 .077 .182
Surprised .258 .138 .126 .110 .179 .049 .069 .160 .078 .061
Comparison to facial expression features
The second analysis compared the performance of motion vectors to that of emotion categories. The results are shown in Table 2.3. In the bottom row of the table are the best performing MUs from Table 2.2 for reference.
Unlike the performance of motion vectors, most of the best performing fea-tures in the emotion categories were based on theDisgusted andNeutral
categories. However, if we compare these performance to the best MU fea-tures, we can observe that it was the Neutral feature which often outperformed the motion vector features. We speculate that the performance of Neutral cate-gory is partly due to the fact that many frames are categorised as Neutral when no particular facial activity was detected. Therefore, the Neutral category was more likely to perform better than other categories.
Overall, the comparison to the emotion categories suggests that some users can be modelled by a single point (motion unit) while others need multiple points (i.e., emotion category) to model their affective states.
On scalability
We have looked at people’s facial activity to detect the personal highlights in video clips. This can be seen as a subtask of affective video summarisation based on human-centred multimodal approach [130]. A limitation of multi-modal approach which exploits physiological aspects of human beings using various sensors is the scalability. Unlike the content analysis approach, we can only collect the data while the users engage with multimedia contents. While our approach was using only a conventional webcam which is much less obtru-sive than other approaches, the limitation still applies. In our previous work, this issue was briefly discussed as follows (Note that FX stands for facial expression in the following quote):
“we need to explore ways to leverage user based information in a practical fashion. One way might be the combination with content based approaches. For example, the highlight scenes are determined by FX based models in unobtrusive way, but the scenes were repre-sented by low level feature models. This will allow us to generate a personalised summary for unseen videos by measure the similarity between existing FX profile and new video contents.” [136]
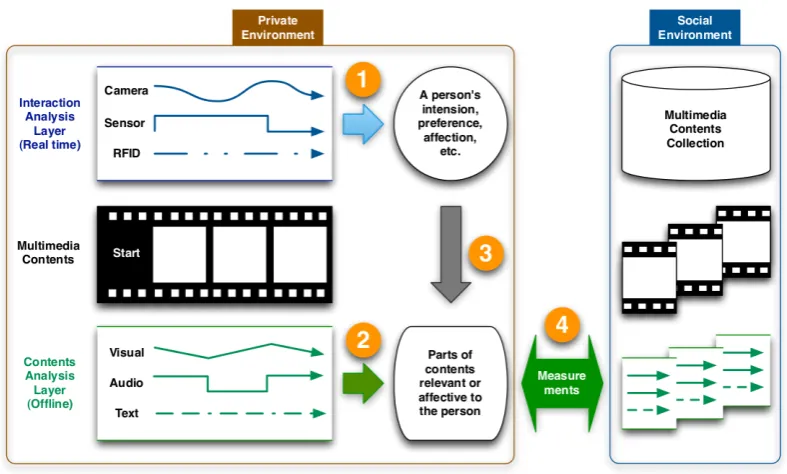
This section expands our view of this issue by looking at the multimodal in-teraction analysis of multimedia contents in a larger context, which is illustrated as a research framework in Figure 2.6.
The framework broadly divided the analysis into two layers. One is the interaction analysis layer which includes the multimodal interaction analysis presented in this paper, or others with various sensory devices as described in Section 2.1.1. The analysis of this layer tends to be carried out in realtime when the end-user engages with multimedia contents to capture a user’s affection, preference, intention, and other user profile information. Another is the content analysis layer which includes the analysis of visual, audio, and textual data ex-tracted from multimedia contents. This layer’s analysis can be done in offline to capture the characteristics of multimedia contents at various levels.
Given that the interaction analysis layer can provide a rich representation of user profile information, one way to scale the multimodal interaction approach is to map the significant parts (e.g., affective) of multimedia contents onto the representation of the content-analysis layer. Once this mapping is successfully carried out, then a measurement such as similarity measure can be done with all the other contents available in the social environment at the content-analysis layer. We do not claim that this is the only way to further our research. For example, a successful mapping of the interaction analysis layer to the content-analysis layer can be challenging. However, it is clear from the framework that there is ample room for further investigation to achieve a scalable multimodal approach to personal highlight detection and affective multimedia summarisa-tion.
2.1.5 Conclusions and Future Work
of the face. We plan to develop a more sophisticated technique to detect per-sonal highlights based on this finding in the future. We are also interested in the issue of mapping interaction analysis data to content analysis data to achieve a scalable multimodal profiling for multimedia contents.
2.2
From Facial Expressions to UX evaluation
In the last decade there has been a widespread move in HCI to consider emo-tional aspects of User eXperiences (UX) alongside the standard usability re-quirements [114]. This move has brought forward a need for new instruments to measure emotional responses to technology. Psychologists have long striven to overcome the difficulties of operationalising and measuring emotions, yet the HCI context introduces new complex challenges. Self-report instruments [26,
69,128] are in need of a serious validation effort, and invasive physiological in-struments contrast with the requirement of ecological validity of the evaluation settings. The measurement is further complicated by the low intensity emotional reactions often elicited in HCI settings [26, 69]. These reactions tend to be of a mixed nature [69] and are normally not accompanied by visually observable changes in a person state [68]. As such, they are difficult to be described us-ing the basic emotion taxonomy [77] implemented in current tools for usability evaluation [67].
Furthermore, HCI researchers and practitioners are interested in emotions as a means to understanding dynamic interactions, whereas the bulk of research in psychology and marketing has considered static stimuli [69]. Finally, most HCI practitioners are likely to miss the theoretical and methodological back-ground necessary to interpret self-reports or to operate complex and expensive physiological instruments.
inter-action with technology. The system fulfills many requirements of UX research: 1. it does not need invasive devices nor controlled illumination settings; 2. it can be installed in any device featuring a commercial in-built video
cam-era;
3. it tracks minute changes in the facial muscle activity of the user facilitating discrimination of mixed emotions, such as frustration or confusion;
4. it is cheap and does not assume heavy background knowledge.
We present two independent evaluation studies used to validate the perfor-mance of UX Mate against that of skilled user researchers. The work focuses on usability evaluation of different interactive devices through facial cues; the approach can be extended to cover mixed feelings such as frustration, a feeling linked to interaction difficulties as in our scenario, flow and fun.
The main contributions of this research are:
• the development and evaluation of UX Mate;
• a corpus provided to the community of synchronized and annotated videos of interactive behaviour and facial expressions, which can be used to ground research on the relationship between behaviour and emotion in HCI.
2.2.1 State of the Art
A large corpus of research has explored the computational implications of tech-nology that relates to, arises from, or deliberately influences emotions [223]. However, less emphasis has been devoted so far to understanding how mea-sures of emotions can support the evaluation of interactive devices, and to the validation of new measurement tools.
Questionnaire Measures Dozens of affective inventories are available in the
psy-chological literature. Questionnaires share the benefit of being ecologically valid, as they do not need to be administered in controlled settings. However, they can only provide a summary evaluation of past events and cannot capture the dynamics of the interaction. Due to the dissipative nature of emotion, this evaluation is likely to be affected by response bias.
One of the most extensively used questionnaires is PAD [191], which mea-sures emotions on three independent dimensions (Pleasure, Arousal, Domi-nance) by means of a semantic differential scale. Although PAD is reliable, there are a number of difficulties associated with it. Firstly, it requires the re-spondents to provide 18 different ratings for each stimulus. Secondly, it requires statistical skills from the evaluators. Finally, the cultural frame of the respon-dent can bias verbal ratings: even small differences in wording can increase the level of cognitive noise and alter response patterns.
To alleviate these problems, HCI research has recently focused on shorter, non-verbal measurement tools. The ones most commonly used in evaluations [30,
47, 271] rely on visual representations of emotions. Examples are the Self-Assessment Manikin [30] and PrEmo [69]. Some research has also investigated the communication of emotion through tactile experiences with physical stim-uli [128].
Yet, questionnaires may still have several issues, as many dimensions of user experience are not stable, singular judgments, but rather vary over the time course of the interaction.
through which people convey emotion.
Research in psychology demonstrated that facial expressions show reliable correlation with self-reported emotions [146] and with physiological measures of emotion [62]. The most common approach used to measure patterns of fa-cial movements in HCI relies on the detection of muscle activity through elec-tromyography (EMG) [32, 116, 181, 234, 303]. Such studies investigate the electrical activity of several muscles (corrugator, frontalis, orbicularis and zy-gomatic) in a range of interaction tasks. Results are preliminary and at times contradictory, but overall they suggest a relationship between the activity of the corrugator (eyebrow movement) and zygomatic (mouth corner movement) with interaction events.
Overall, facial EMG was showed to be an effective method for tracking emo-tional changes over time. Yet EMG is not the expected panacea to the mea-surement requirements of HCI as it tends to provide exclusively information on emotional valence and does not provide clear information on the specific emotions elicited. Furthermore, there are still issues of external validity: facial expressions and self-reports do not always correlate [181, 316].
While physiological approaches share the benefit of being able to accurately capture changes in emotional states that cannot be measured using other meth-ods [242], they all require specific expertise as well as special and expensive equipment [177]. To overcome these limitations, researchers started investi-gating how usability can be assessed by means of automatic analysis of facial expressions collected by video signal processing.
judgments, and data from FaceReader [316]. The results showed consistency between FaceReader’s output and expert-human judgment, while questionnaire data were not consistent with the other sources of emotional information. This lack of correlation can be due to the direct use of basic emotions, which are unlikely to be elicited in the HCI context. Moreover, FaceReader has a number of constraints related to illumination or background clutter, which can affect the output [100].
Although the first results obtained using video analysis are encouraging, further research is needed to face current limitations, with a particular con-cern about finding ways of exploiting psycho-physiological measurements in a cheap, non-invasive, and ecological fashion.
2.2.2 UX Mate
UX Mate (UX Motion Activation Tracking Engine), is a software tool devel-oped for automatic assessment of UX by means of facial motion tracking. UX Mate brings together the advantages of EMG and approaches based on video analysis since it does not require invasive devices and can be used in natural settings, including situations with critical or varying illumination conditions. Moreover, it exploits fine-grained facial motion tracking instead of relying on a fixed emo-tion classifier. This feature allows to take advantage of low-intensity, mixed emotions as the ones elicited in HCI.
of the face and are responsible for facial appearance changes.
The subtle motion of facial muscles corresponding to fast transitory motion of AUs is a powerful indicator of micro-expressions [80], i.e., the involuntary expressions appearing for periods of time as short as 1/25 of a second. A dis-tinctive property of such micro-expressions is that they can hardly be faked [80]. Despite this large success, FACS presents some limitations: human observers require specific training in order to exploit it [80] and it is very time consuming: coding 1 hour of video data requires 4 hours of work [35]. UX Mate overcomes this limitation by a tracking system able to run in real-time. As opposed to other approaches, the system is robust to illumination changes.
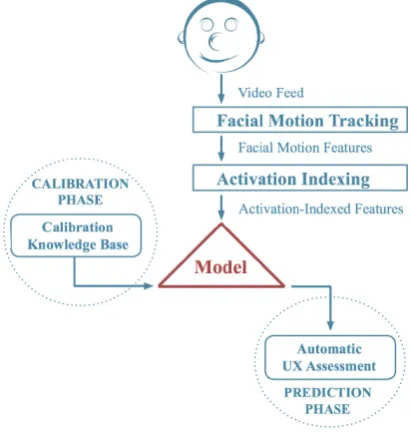
Figure 2.7: UX Mate system overview.
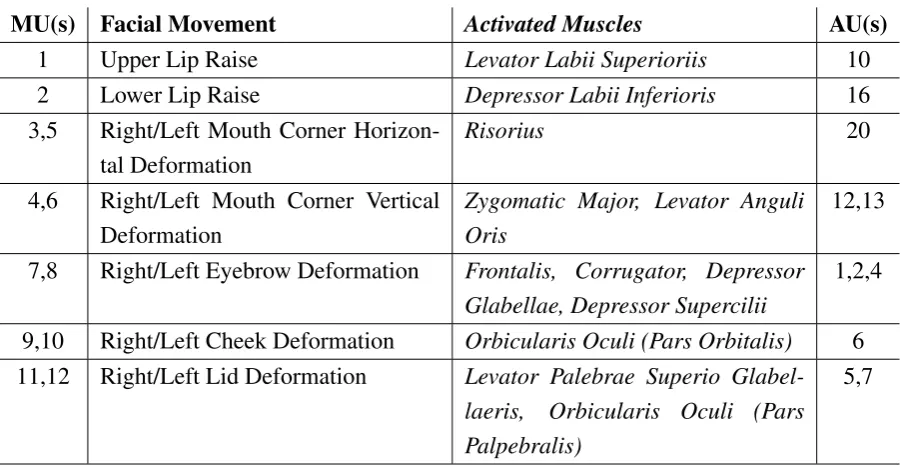
MU(s) Facial Movement Activated Muscles AU(s)
1 Upper Lip Raise Levator Labii Superioriis 10
2 Lower Lip Raise Depressor Labii Inferioris 16
3,5 Right/Left Mouth Corner Horizon-tal Deformation
Risorius 20
4,6 Right/Left Mouth Corner Vertical Deformation
Zygomatic Major, Levator Anguli Oris
12,13
7,8 Right/Left Eyebrow Deformation Frontalis, Corrugator, Depressor Glabellae, Depressor Supercilii
1,2,4
9,10 Right/Left Cheek Deformation Orbicularis Oculi (Pars Orbitalis) 6 11,12 Right/Left Lid Deformation Levator Palebrae Superio
Glabel-laeris, Orbicularis Oculi (Pars Palpebralis)
5,7
Table 2.4: Description of Motion Units
user’s reactions. Such model is then used, in the prediction phase, to automati-cally assess UX in the tasks under evaluation. Manually labeled data is used in this paper to evaluate UX Mate’s performance.
Facial Motion Tracking System
The facial motion tracking system endorses a framework inspired by FACS: 12 Motion Units (MU) are defined in correspondence to one or more Action Units. The tracking information refers to the movement of these 12 MUs, cor-responding to a subset of AUs defined in Table 2.4. This subset has proven to be sufficient for automatic facial expression recognition [49].
initial-ization stage, a near-frontal and neutral face is captured and a 3D facial mesh model is fitted on the face. Such a model consists of sixteen surface patches (which are guaranteed to be continuous and smooth) embedded in Bezier vol-umes. The control points of the surface patches are the facial points of interest represented by the MUs.
On the chosen initialization frame, the motion vectors are set to zero; on subsequent frames, a template matching method is used to estimate the two-dimensional motion of the mesh nodes of interest. The mesh is then updated by projecting the two-dimensional motion information onto the three-dimensional face model. For each processed video frame, the facial motion tracking module outputs a 12-dimensional vector. The values in the output vector correspond to the direction and magnitude of motion for the corresponding MUs. We will refer to such values with the term features from now on.
For the sake of the current studies, we computed two variables based on the combination of different MUs, namely, confusion and frustration. The algo-rithm was based on FACS based research [77] showing a correlation between AU12 (lip corner puller) and frustration, and between the combination of AU4, AU7 and AU12 and confusion. Frustration features were computed for both mouth corners by calculating the length of the vector resulting from the addi-tion of the respective horizontal (MU3/MU5) and vertical vectors (MU4/MU6). Confusion was computed by the quadratic mean of the individual MUs (eye-brows, eyelids, and mouth corners). Additionally, a measure of the overall facial activity was computed by adding all motion units values.
Activation Indexing
The purpose of the Activation Indexing module is to detect MUs’ activation at each frame, and subsequently score each task in terms of activation levels. The module computes the mean and standard deviation for each motion unit. The Activation Index for a MU is given by the count of frames (1/25 of a second) where its absolute value goes above one standard deviation over the mean. Such a computational approach is based on the procedure suggested in [116]. The cri-terion of one standard deviation is justified by standard in psychological testing, where these values are considered to be out of the normal range.
Machine Learning Module
The activation-indexed features are used as input data for a generic machine-learning module written in the Java programming language and based on the WEKA [107] data mining tool.
The modular approach adopted in designing UX Mate makes it possible to connect data output to any machine learning toolkit with a Java interface. This module returns a prediction on the level of occurrence of a given event. A high level of flexibility is achieved through the use of calibration tasks, i.e. short sessions carefully designed in order to elicit specific reactions according to the goal of the evaluation to carry out. In the example described in this paper, the participants were tested with two short tasks designed to elicit a variable level of difficulty, but the tasks can easily be updated to fit different requirements.
2.2.3 Pilot Study
(interaction time and errors). Furthermore, a measure of external validity was collected asking three human observers to judge the difficulty of the tasks based on the videos of the users’ faces.
Method
Participants Fifteen Masters students (14 M; mean age = 26.4 years) of a local University were involved, on a voluntary basis, as participants in the study. All of them reported at least three years of experience with different media players, but none had ever used the ones tested in the evaluation.
Procedure The study was conducted in several places, including rooms in the
hall of residence or university offices using the participants’ own computers. Four Media-Players were tested: iTunes, MusicBee, Songbird, and MediaMon-key. They each had a different look-and-feel, and level of usability and func-tionality. The media-players were installed on the participants’ laptops along-side a program for synchronized video and audio recording of faces and screen actions.
Before the study, the participants signed a consent form stating that their face would be videotaped but with no reference to why. Then they performed three tasks on each media player: importing a folder to the library; finding a song and playing it; adjusting the equalization of a song. Media player order was counterbalanced across participants, while task order was kept constant. After task completion, participants filled in the UX questionnaire referring to the media player they had just used. At the end of the study, they chose one media player and committed to use it instead of their usual program for the following month.
Measures The study collected three classes of measures: performance data,
self-reports on user experience, and facial cues extracted by UX Mate. Per-formance data (errors and time) were obtained from the expert analysis of the interaction videos.
Users’ interaction path for each task was compared to an ideal task analysis describing optimal performance (i.e., the procedure allowing reaching the goal with the least number of actions). Several analyses were performed for each task and media players to account for different possibilities to achieve the same goal (e.g., direct manipulation vs. menu selection). All user actions not matching optimal performance were counted as errors.
The questionnaire was composed of three parts addressing UX evaluation, information about participants previous usage of Media-Players, and demo-graphic data. Media players were evaluated for individual dimensions of UX and summary judgement. A definition of each dimensions and item wording is reported in Table 2. Dependent variables were computed averaging items of individual scales (allα > .80).
Based on literature analysis, we selected 4 MUs (MU4/6 describing the movement of the zygomatic major and MU7/8 describing the movement of the corrugator) which could better describe the facial expressions of people fac-ing difficulties. Furthermore, we analysed the compounded indexes describfac-ing frustration and confusion.
Results
Performance data A sample of 168 tasks was collected and used for
were based on the Least-Significance Difference method. Partial eta-squared (p2) was used as an estimate of effect size.
The ANOVA on error returned a significant effect of media-player (F(3,156)
= 6.73, p < .001, ηp2 = .12) and task (F(2,156) = 7.83, p < .01, ηp2 = .09). The
ANOVA on time returned a significant effect of media-player (F(3,156) = 5.85,
p < .001, η2p = .10) and task (F(2,156) = 7.70, p < .001, ηp2 = .09). In both analyses, post-hoc tests indicated that MusicBee was significantly worse than all other systems (with no significant differences between them), and that task 2 was significantly easier than the other tasks.
Questionnaire data The scores of the 6 UX dimensions tested in the study were entered as dependent variables in 6 repeated-measures analysis of variances, with media-player (4) as within-subjects factor. The analyses returned a signif-icant main effect of media-player for all variables. The F values ranged from 7.55 (p= .001, p2 = .35) for the functionality score to 12.75 (p <.001,ηp2 = .48) for classical aesthetic.
iTunes and Media-monkey were preferred in all UX dimensions, with no sig-nificant differences between them. Songbird and MusicBee scored negatively, with significant differences favoring SongBird on usability, functionality, plea-sure and summa