R E S E A R C H
Open Access
A quantitative reference transcriptome for
Nematostella vectensis
early embryonic
development: a pipeline for
de novo
assembly in
emerging model systems
Sarah Tulin
1†, Derek Aguiar
2†, Sorin Istrail
2and Joel Smith
1*Abstract
Background:Thede novoassembly of transcriptomes from short shotgun sequences raises challenges due to random and non-random sequencing biases and inherent transcript complexity. We sought to define a pipeline for
de novotranscriptome assembly to aid researchers working with emerging model systems where well annotated
genome assemblies are not available as a reference. To detail this experimental and computational method, we used early embryos of the sea anemone,Nematostella vectensis, an emerging model system for studies of animal body plan evolution. We performed RNA-seq on embryos up to 24 h of development using Illumina HiSeq technology and evaluated independentde novoassembly methods. The resulting reads were assembled using either the Trinity assembler on all quality controlled reads or both the Velvet and Oases assemblers on reads passing a stringent digital normalization filter. A control set of mRNA standards from the National Institute of Standards and Technology (NIST) was included in our experimental pipeline to invest our transcriptome with quantitative information on absolute transcript levels and to provide additional quality control.
Results:We generated >200 million paired-end reads from directional cDNA libraries representing well over 20 Gb of sequence. The Trinity assembler pipeline, including preliminary quality control steps, resulted in more than 86% of reads aligning with the reference transcriptome thus generated. Nevertheless, digital normalization combined with assembly by Velvet and Oases required far less computing power and decreased processing time while still mapping 82% of reads. We have made the raw sequencing reads and assembled transcriptome publically available. Conclusions:Nematostella vectensiswas chosen for its strategic position in the tree of life for studies into the origins of the animal body plan, however, the challenge of reference-free transcriptome assembly is relevant to all systems for which well annotated gene models and independently verified genome assembly may not be available. To navigate this new territory, we have constructed a pipeline for library preparation and computational analysis for
de novotranscriptome assembly. The gene models defined by this reference transcriptome define the set of genes
transcribed in earlyNematostelladevelopment and will provide a valuable dataset for further gene regulatory network investigations.
Keywords:Transcriptome, Gene regulatory network,Nematostellaembryonic development, Body plan evolution, Next-generation sequencing, Illumina HiSeq, Trinity, Oases, RNA-seq
* Correspondence:[email protected]
†Equal contributors 1
Eugene Bell Center for Regenerative Biology and Tissue Engineering, Marine Biological Laboratory, 7 MBL Street, Woods Hole, MA 02543, USA
Full list of author information is available at the end of the article
Background
Nematostella vectensis, the starlet sea anemone, offers many advantages as a model system for the evolution of animal developmental programs. As an anthozoan cni-darian, it is strategically positioned as an outgroup to Bilateria [1-3] and is well situated to reveal the early steps in the evolution of the bilaterian body plan. Two of these evolutionary steps are likely to include the for-mation of a secondary body axis and a mesodermal germ layer which are both essential, defining characteristics of a bilaterian animal. Embryonic dorsal-ventral patterning and mesodermal development have been studied in many bilaterian models yet the origins of these significant body plan innovations are not well understood. Initial studies of gene expression inNematostella and non-anthozoan cnidarians have revealed that genes important to bilaterian mesoderm specification are expressed in the endoderm of the sea anemone, and suggests that the bilaterian mesoderm may have originated from the endoderm of diploblastic ancestors [4-6]. Genes encoding factors in-volved in dorsal-ventral axis specification in Bilaterians are likewise asymmetrically expressed in Nematostella, indicating the possibility that a secondary axis was present in the Cnidarian-Bilaterian ancestor [7,8]. Defining the mechanisms controllingNematostelladevelopment will help address these questions about the early evolution-ary steps that led to bilaterian body plans with three germ layers and bilateral symmetry.
Gene regulatory networks (GRN) provide predictive models of gene regulation, as in the several examples that now exist for normal animal development (for example, Drosophila [9], sea urchin [10,11], ascidians [12], chick [13], and zebrafish [14]). To gain a comprehensive view of the control system, it is necessary to identify all genes whose products make up the regulatory network. This applies to our current research efforts but is also generally applicable to studies of virtually any regulatory system. Advanced sequencing platforms now allow us to do this through RNA-seq techniques. Yet, deep RNA-seq brings challenges in analysis reflecting the scale and complexity of transcriptomes, the primary problem being adequate assembly of RNA-seq reads in order to define a reference set of gene models [15-17]. Transcriptome assembly can be achieved using a reference-based strategy, a de novo strategy or a combination of the two. The main drawback to using a genome reference for assembly is that it relies on the quality of the reference genome being used [18]. This is a particular problem for emerging model systems with recently completed genomes because misassemblies, poor annotation and large gaps in coverage plague the genome assemblies of all but a few of the major model systems [19]. There is also a challenge in assigning reads that align equally well to multiple places in the genome. The aligner must decide to either exclude these reads
which can result in gaps or to choose which alignments to retain which could lead to wrong assignments or predic-tions of a transcript in a region that has no transcription.
A comprehensive GRN for early embryonic develop-ment in Nematostellawill enable researchers to investi-gate the extent to which the bilaterian regulatory toolkit is present in this representative cnidarian, down to the level of precise signaling systems and transcription factor cis-regulatory interactions. By harnessing the power of high-throughput sequencing and perturbation techniques, we aim to build the sea anemone GRN in an unbiased and efficient manner that will serve as a GRN construction pipeline for other model systems to follow.
The currentNematostellagenome assemblies [20,21] fall into the category of young genome models that are still incomplete and contain gaps thus making the reference-based method alone insufficient for our needs. Taking these and all of the above complications into account and considering our goal to define an experimental and computational pipeline for emerging model systems, we elected to use the de novo assembly approach. This approach will be especially useful for evo-devo researchers aiming to harness the power of next-generation sequencing to bring their research into the genomics era; a trend already underway, for example Parhyale[22],Oncopeltus [23], sponge [24], and sea urchin [15].
The scale of reads, random and non-random sequen-cing errors, and inherent transcript complexity due to alternate transcription start sites or splice junctions all pose challenges forde novo transcriptome assembly. In-deed, the scale of the problem is only set to increase with the expanding capacity for transcriptome sequencing from advances in next-generation sequencing (NGS) plat-forms. In the last few years several assembly algorithms have been released to meet these challenges: Trans-ABySS [25], SOAPdenovo [26], Velvet/Oases [27,28], and Trinity [29]. The millions of short reads produced from NGS platforms result in millions of overlapping sequences. Short-readde novoassemblers exploit these overlaps to reconstruct the original transcripts by using the de Bruijn graph data structure, which encodes overlapping k-mers as adjacent vertices. Assembly algorithms then compute paths through the de Bruijn graph that corres-pond to valid assemblies of the sequence reads.
each cluster. All reads are segregated to one of these separate graphs. Butterfly then processes these separate graphs in parallel by tracing a path through each one and reports full length transcripts separately for alter-nate splice forms and paralogs. The Oases assembler uploads a preliminary assembly created by Velvet, which was originally designed for genome assembly. Oases corrects this assembly using a range ofk-mers to create separate assemblies, which are then combined into one. The longer k-mers perform better on high expression transcripts and the shorter k-mers have an advantage on low expression transcripts [28]. While the multiple k-mer approach has been found to result in an increase of longer transcripts, it can also lead to an accumula-tion of incorrect assemblies or artificially fused tran-scripts [30].
In this study we designed a next-generation sequen-cing and analysis pipeline to produce a minimally biased and quantitative reference transcriptome. The resulting transcriptome represents the first 24 h of Nematostella development and will be the basis for further gene regu-latory network studies. The experimental and computa-tional pipeline will be used by us and others to produce transcriptomes for other model systems, particularly those evo-devo models that do not yet have an annotated genome but would benefit from an in depth molecular analysis.
Methods Library prep
Nematostella vectensis adults following normal culture at 18°C were spawned with a 9-h cycle of light at 25°C in an incubator. Male and female spawning adults were in separate bowls and egg sacs were removed to a fresh bowl and fertilized with sperm from male bowls for 10 minutes. The egg sacs were then dejellied with a 4% cysteine solution (pH 7.4) in 50% filtered sea water (FSW) for 8 minutes and rinsed five times with 50% FSW. All embryo processing was performed in an 18°C room and the embryos were cultured from the time of fertilization for 0, 6, 12, 18 or 24 h (five timepoints). An additional 24-h sample was prepared in the same way from a sep-arate spawning event. Cultured embryos were trans-ferred to an eppendorf tube, allowed to settle, gently spun to a pellet and the supernatant removed, approxi-mately 600 embryos per sample. The embryo pellet was immediately immersed in 100μl of lysis buffer from the Invitrogen mRNA DIRECT kit (Invitrogen, Life Technolo-gies, Grand Island, NY, USA) and homogenized with a Kontes Pellet Pestle (distributed by Thermo Fisher Scien-tific, Pittsburgh, PA, USA) attached to a 12 V/700 rpm drill. Another 100μl of lysis buffer was used to rinse the Kontes Pellet Pestle tip and collected in the same tube. Samples were then stored at −80°C until all timepoints had been collected.
To thawed lysates, a third aliquot of 100 μl of lysis buffer was added and then the normal protocol for the Invitrogen mRNA DIRECT kit was followed using 50μl Dynabeads per sample and low adhesion microcentrifuge tubes, following the manufacturer’s recommendations. The mRNA yields were between 108 ng and 344 ng total per sample. The mRNA was used as starting material for the ScriptSeq V.1 kit from Epicentre (Epicentre Biotech-nologies, Madison, WI, USA). A total of 9.0μl of mRNA corresponding to between 74 ng to 233 ng per sample was combined with 1.0 μl of a 1:10 dilution of External RNA Controls Consortium (ERCC) spike-in control RNA for the first reaction (available from Invitrogen/Life Technologies). The protocol was followed exactly, using 12 cycles total of PCR in the amplification step with Phusion High Fidelity polymerase (available from Therm Scientific) and barcoded Illumina-compatible primers 1 to 6 from Epicentre.
The libraries were size selected with a 2% Pippin prep gel (from Sage Science, Beverly, MA, USA) for 450 bp and checked on a Agilent 2100 Bioanalyzer with a high sensi-tivity DNA chip (from Agilent Technologies, Santa Clara, CA, USA) and then by qPCR. The samples were com-bined and run on a single lane of the Illumina High Seq 1000 with version III chemistry with 200 cycles of paired end sequencing plus indexing reads. All raw read files are available on the Woods Hole Data Archive at http://hdl. handle.net/1912/5613, DOI [DOI:10.1575/1912/5613].
Computational methods
Quality control
distribution was computed for the set of all reads. GC content biases in the first 13 bases of Illumina RNA-seq data are known to exist due to random hexamer priming [31]. This bias may cause an imbalance in read coverage and persist through the assembly process, which can affect the quality of assembly and quantification levels. Because we had extremely high sequence coverage, we removed the bias by simply trimming the start of the reads. Using the FASTX-Toolkit, we removed the initial 13 bases from the reads at each timepoint. Finally, btrim was also used to adaptively trim low quality bases from the end of the read. Adaptive trimming is performed by sliding a window of 5 bp from the end of the read to the start, removing bases and shifting the sliding window by 1 base if the aver-age quality score is less than 30 until the averaver-age quality score is at least 30.
Digital normalization, Velvet and Oases
Digital normalization is a method to reduce the total number of reads to be assembled, thereby also reducing the computing power and time required for assembly. It preferentially removes high abundance reads but retains read complexity in order to remove errors but preserve low abundance transcripts prior to assembly. All links to digital normalization software are available electron-ically through http://ged.msu.edu/papers/2012-diginorm/. Raw paired-end read files were first interleaved into pairs using a python script, available at http://github.com/ ged-lab/khmer/tree/2012-paper-diginorm/sandbox. Then, three rounds of digital normalization were applied to re-move overabundant and erroneous reads. These depend on the khmer software package, available at http:// github.com/ged-lab/khmer/. The khmer software also relies on the screed package for loading sequences, available at http://github.com/ged-lab/screed/ (khmer and screed are ©2010 Michigan State University, and are free software available for distribution, modification, redistribution under the BSD license). The digital normal-ized files were assembled with Velvet (version 1.2.03) and Oases (version 0.2.06). The details of the execution com-mands are available in Additional file 1. The most current recommendations for use of digital normalization for de novotranscriptome assembly recommend using only one round of normalization instead of three. Fewer low abun-dance transcripts may be lost by foregoing further rounds of digital normalization at the expense of increased com-puting time and power to assemble the greater number of remaining reads.
Trinity assembly and quantification
The 20 August 2011 release of the Trinity pipeline was run on the reads remaining after quality control (http:// trinityrnaseq.sourceforge.net/). We ran Trinity with the options to use eight CPU cores and the RF library type
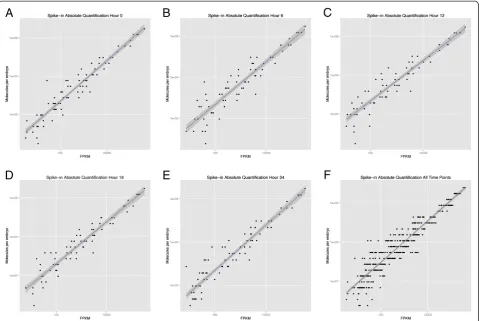
to reflect the directionality of the sequence reads (full execution commands are given in Additional file 2). The assembled transcriptome is available on the Woods Hole Data Archive at: http://hdl.handle.net/1912/5613, [DOI:10.1575/1912/5613]. Bowtie was then used to align the post quality control sequence reads to the transcrip-tome assembly and the ERCC spike-in control sequences. We then computed (1) the set of concordant paired-end mapped sequence pairs and (2) the set of all mapped sequences for both the transcriptome and the ERCC controls. Fragments per kilobase of exon per million fragments mapped (FPKM) values were computed for the transcriptome assembly transcripts and the ERCC controls using RSEM (version 1.2.0). To quantify the expression of transcripts in terms of molecules we com-puted the dose–response curve by plotting FPKM values versus the known concentration of each ERCC spike-in for each timepoint. A set of ordinary least squares (Additional file 3) and robust linear regressions (Figure 1) [32] were computed, and we observed that the set of concordant mapped reads yielded higher R2 (Table 1) than the set of all mapped reads, and thus, we used the concordant mapped reads for downstream analyses. Using the fitted line, we inferred the number of molecules present for each Trinity assembled tran-script, in each timepoint.
Blast2GO
To compute overexpressed GO terms in our transcrip-tome, we used BLASTx 2.2.26+, BLOSUM62 similarity matrix, Blast2GO database version August 2011, and pipe-line B2G4Pipe version 2.3.5. The definition of each GO term is determined by the GO Consortium: http://www. geneontology.org/, and can be found using the EMBL-European Bioinformatics Institute QuickGO: http://www. ebi.ac.uk/QuickGO/, or the Gene Ontology Normal Usage Tracking System, GONUTS: http://gowiki.tamu.edu/wiki/ index.php/Main_Page. Definitions for all GO terms pre-sented in this paper can be found in Additional file 4.
Results
Library preparation and quality control of reads
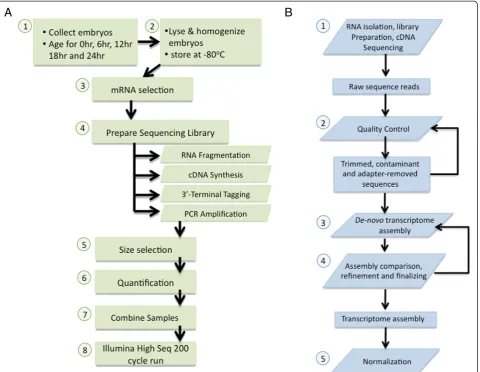
In theory, RNA-seq can catalog all expressed transcripts as complete mRNA sequences. To determine the set of transcripts expressed from fertilization to gastrulation, we chose to sample five timepoints during the first 24 h ofNematostelladevelopment: 0, 6, 12, 18, and 24 h after fertilization (Figure 2A). First, 600 embryos per timepoint were immediately homogenized and lysed with lysis buffer from the Invitrogen mRNA DIRECT kit and stored at
personal communication). Next, mRNA was positively selected with the Invitrogen mRNA DIRECT kit, which is a magnetic bead-based method. We tried an alternate mRNA enrichment method with total RNA extraction combined with negative selection for ribosomal RNAs, but the yields were too low from total RNA extraction with a Qiagen total RNA kit even for use with the low input version of the RiboZero kit from Epicentre. This is probably due to low RNA levels or difficult to extract RNA (not an uncommon problem in embryo systems)
inNematostellaembryos, so for this step in the pipeline the alternate negative selection method may work better for species such asXenopus, which have large amounts of RNA in their eggs. Our research group has more re-cently used this alternate method successfully for devel-oping embryos of the slipper snail,Crepidula fornicata.
The polyA-RNA enriched sample was then processed with the Script Seq kit, version 1, from Epicentre. The main advantages of this kit are the resulting directional reads, short preparation time (4 h), and low input require-ments (as low as 50 ng mRNA). The adapter-ligated li-braries were then size selected for uniformity at 450 bp using a Pippin Prep gel electrophoresis apparatus from Sage Science and combined in one lane on an Illumina HiSeq 1000 to produce 2 × 100 bp paired-end reads.
The sequencing run produced 238.5 million total raw reads (1.19E + 08 pairs; Table 2), yielding far more than 20 GB of data. Quality control was then implemented in two phases (Figure 2B). The first phase removes adapter sequence contamination and ribosomal and mitochon-drial RNA sequence. The second phase filters low com-plexity artifacts that may have resulted from technical
Figure 1Standard curves for RNA spike-in control standards.RNA spike-in control standard curves for (A) 0 h (B) 6 h (C) 12 h (D) 18 h (E) 24 h and (F) all timepoints. The x-axis shows the fragments per kilobase of exon per million fragments mapped (FPKM) values (reads) and the y-axis shows the known concentrations of each molecule, in molecules per embryo. The blue line and grey shadow represent the best-fit line using robust linear regressions and standard error, respectively.
Table 1 Spike-in standard curve R values for the ordinary least squares regression
Time R2
Hour 0 0.973
Hour 6 0.959
Hour 12 0.969
Hour 18 0.957
Hour 24 0.964
failures during sequencing, removes low quality bases from the ends of reads, and trims the GC-content bias sequence bases from the start of the each read (see Methods section for more details). Both quality control phases may remove reads entirely or a subset of bases. If the length of a read is less than thek-mer length of the de novo assembler it cannot be used for assembly and is removed from the read set. These filters may therefore result in read fragments that have one of the paired reads removed while the other passes quality control.
The raw sequence dataset contains 24 billion bases in 119 million paired directional sequence reads. After quality control phase 1 (QC phase 1), 71.7% of the bases and 70.3% of the paired sequence reads remained (Table 2). Phase 1 removed one of the pairs from 1.3 million frag-ments effectively introducing unpaired sequences into the read set. After QC phase 2, 59.1% of the original sequence bases remained and 67.5% of the original paired sequence reads remained. A total of 5.4 million unpaired sequences remained after QC phase 2.
De novoassembly with Trinity assembler
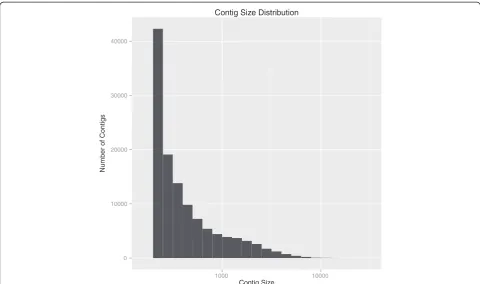
Assembling a transcriptome from short reads is computa-tionally challenging and several methods exist for assem-bly using an annotated genome as a reference, assembling the readsde novowithout a genome reference, or a com-bination of the two. Due to the aforementioned difficulties with using the currentNematostellagenome for assembly, we chose to compare two alternate pipelines which both usede novoassembly exclusively. The first uses the Trinity platform, which has been shown to recover more full-length transcripts across a range of levels at a sensitivity level comparable to assemblers that use a genome refer-ence [33,34]. Additionally, Trinity can recognize alternate splice forms as belonging to the same gene and keep them together with the same prefix. Sequence reads that passed quality control were assembled into 119,911 contigs by Trinity (Table 3); 14.85% of assembled contigs were more than 1,000 bp long (Figure 3). The total alignment rate for the Trinity assembly was 85.90% (Table 4).
Determining adequate coverage of transcriptomes is more challenging than determining coverage of genomes because every transcript species (including splice variants or those using alternate transcription start sites) is present at a different level across a large range. Several studies have used an independent assembly of randomly selected subsets of their reads to compare the rate of new tran-script discovery, determine the lower abundance limit of detection and compare the average length of isotigs. While analyzing the sea urchin embryonic transcrip-tome, Tuet al. compared a 20 M read subset with a 2 M read subset and a 0.2 M read subset, and found that
20 M reads were sufficient to reliably detect levels of transcripts at 400 molecules/embryo, which they esti-mate as the lower limit for proteins of developmental significance (such as transcription factors, which may be functionally relevant at levels as low as 10 copies of transcript per cell) [15]. In their analysis of the milk-weed transcriptome, Ewen-Campen et al. created eight subsets of reads, assembled them separately and used BLASTx to compare gene discovery rates [23]. They found that the rate of new transcript discovery plateaued at 1.5 M reads, although the N50 isotig length continued to increase when using 2 M to 17 M read subsets. After 2 rounds of quality control filtering of our reads, we were left with 80,537,812 paired and 5,362,854 unpaired reads, a depth which has been shown to produce good sensitivity in these other systems for identifying all protein-coding transcripts expressed in the early embryo.
To restate, these previous studies indicate that with the volume of reads coming off the latest Illumina plat-forms (250 million to 400 million reads/lane), and only multiplexing 6 samples in a lane, we should be beyond the necessary coverage to represent all relevant regula-tory transcripts. The best indication of the quality of our assembly is that we have been able to use it as a refer-ence to map reads from more recent experiments in our lab at a median 93% rate (with 90% of samples mapping 90% of their reads to the Trinity-assembled reference).
Digital normalization followed by Oases assembly
To evaluate more closely the quality of ourde novo tran-scriptome assembly, we compared Trinity with an alternate
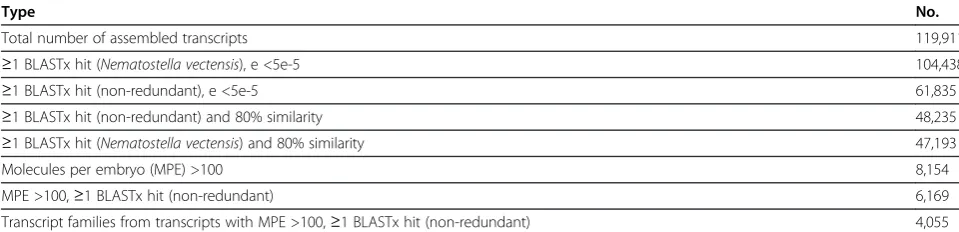
Table 3 No. of distinct transcripts passing filters
Type No.
Total number of assembled transcripts 119,911
≥1 BLASTx hit (Nematostella vectensis), e <5e-5 104,438
≥1 BLASTx hit (non-redundant), e <5e-5 61,835
≥1 BLASTx hit (non-redundant) and 80% similarity 48,235
≥1 BLASTx hit (Nematostella vectensis) and 80% similarity 47,193
Molecules per embryo (MPE) >100 8,154
MPE >100,≥1 BLASTx hit (non-redundant) 6,169
Transcript families from transcripts with MPE >100,≥1 BLASTx hit (non-redundant) 4,055 Table 2 Quality control read attrition
Timepoint Raw paired end reads QC step 1 % QC step 2 %
0 h 1.74E + 07 1.29E + 07 74.29 1.24E + 07 71.38
6 h 1.98E + 07 1.46E + 07 73.76 1.40E + 07 70.95
12 h 1.44E + 07 9.17E + 06 63.48 8.76E + 06 60.68
18 h 2.88E + 07 1.96E + 07 68.25 1.89E + 07 65.65
24 h-A 3.61E + 07 2.57E + 07 71.05 2.46E + 07 68.22
24 h-B 2.75E + 06 1.87E + 06 67.99 1.77E + 06 64.31
strategy that combines a digital normalization step [17] with the assemblers Velvet [27] and Oases [28]. Digital normalization is a computational normalization method that preferentially removes high abundance reads but retains read complexity in order to remove errors and preserve low abundance transcripts prior to assembly. The quality controlled reads were assembled using Velvet and Oases and then mapped back to the resulting assem-bly (commands in Additional file 1). The main advantage of this method is it greatly decreases the computing power and time required to process millions of reads.
We also tested the Amazon Elastic Cloud Computing Service (Amazon EC2), http://aws.amazon.com/ec2/, to perform the digital normalization and Velvet-Oases assembly. This method proves to be a great alternative to using a home institution’s core computers if the in-stitution does not have sufficient computing power for running an assembler or if the computers are expensive to rent, slow or unreliable. Whereas the computation of Trinity required over 50 h and 100 GB of RAM in addition to the quality control steps, the pipeline using digital normalization, Velvet and Oases can all be run in
0 10000 20000 30000 40000
1000 10000
Number of Contigs
Contig Size Distribution
Contig Size
Figure 3Distribution of contig length for assembled reads.Contig length distribution from Trinity-assembled reads. Assembled reads that passed quality control formed 119,911 contigs where 14.85% were more than 1,000 bp long.
Table 4 Trinity assembly compared to digital normalization/Velvet/Oases
Trinity assembly Digital normalization, Oases-Velvet
Total fragments 87,209,130 (100.00%) 87,209,130 (100.00%)
Aligned concordantly 0 times 23,101,349 (26.49%) 35,552,373 (40.77%)
Aligned concordantly 1 time 28,325,506 (32.48%) 30,552,963 (35.03%)
Of reads aligning concordantly or discordantly 0 times:
Aligned discordantly 1 time 1,826,073 (7.90%) 7,539,150 (21.21%)
Total mates 42,550,552 56,026,446
Aligned 0 times 24,594,154 (57.80%) 31,100,316 (55.51%)
Aligned exactly 1 time 4,660,328 (10.95%) 11,909,789 (21.26%)
Aligned >1 times 13,296,070 (31.25%) 13,016,341 (23.23%)
a single day using an XL computer rented from Amazon. We found that this alternative assembly approach gave competitive results when mapping our Nematostella vectensis RNA-seq reads. The overall mapping success rate was 82.17% for digital normalization-Oases as com-pared to 85.90% for Trinity (Table 4).
Quantification of Trinity-assembled transcriptome using known RNA‘spike-ins’
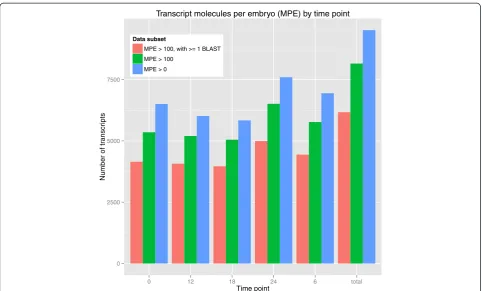
A key component of ourde novo transcriptome pipeline is a method to obtain absolute quantitative information for each transcript using external standards or‘spike-ins’, that is, control RNAs of known concentration. Before absolute quantification of inferred transcripts can be performed, the dynamic range and transcript detection limits must be evaluated using spike-ins. For this we employed the ERCC RNA spike-in set as recommended by the National Institute of Standards and Technology (NIST) [35-37]. First, we computed the properly mapped read alignments from quality controlled sequence read pairs to the ERCC spike-in reference sequences for each embryological timepoint. Quantification of spike-in tran-scripts was then performed using RSEM [38]. Read alignments that were not concordant with directionality constraints were not considered for quantification. We then compared the known concentration of each ERCC spike-in transcript to the RSEM calculated FPKM values. The dose–response curve for each timepoint containing the known concentrations and FPKM values for the spike-ins were plotted. We computed an ordinary least squares (Additional file 3) and robust linear regression to determine the best fit (Figure 1) [32]. The robust lin-ear regression provided a larger detection range and was used to compute absolute quantification for the assem-bled transcripts. In total, we computed 9,516 transcripts expressed above 0 molecules per embryo and 8,154 transcripts expressed above 100 molecules per embryo (Figure 4). When restricting the set of transcripts to those with at least 1 BLAST hit against nr, we observed 6,169 transcripts expressed above 100 molecules per embryo (Table 3).
Blast2GO analysis reveals genes involved in gene regulation
We used Blast2GO to quantify how many transcripts from the Trinity transcriptome fell into well defined gene ontol-ogy (GO) categories over all time periods sampled [39]. A sample of the top overexpressed GO terms computed using Fisher’s exact test from the topGO package version 2.10.0 for R [40] are visualized in Figure 5A. GO terms belong to a top level designation of biological process (BP), cellular component (CC), or molecular function (MF) where the titles of the GO terms are in reference to the top level designation; for example,‘nucleus’refers
to the location of the gene product in the nucleus while ‘gene expression’ refers to a gene product involved in the process of converting gene sequence into RNA or proteins. Definitions for all of the GO terms in Figure 5 can be found in Additional file 3. In order to understand how many transcripts are potentially a part of the em-bryonic gene regulatory control system, we focused on terms enriched for transcription factors and signaling pathway components (Figure 5B). Nearly 1,000 tran-scripts combined fell into the 2 transcription factor cat-egories while nearly 1,500 transcripts combined to make up signaling molecules, their receptors, modulators and transducers. Taken together, these 2,500 transcripts pro-vide an estimate of the number of regulatory factors (transcription factors, ligands, receptors, modulators and transducers) present in the Nematostella developmental gene regulatory network.
Transcript family analysis
Figure 5Gene ontology (GO) analysis: GO term category distribution.(A) Transcripts were processed with Blast2GO and the number of annotated transcripts in each of the selected GO categories is shown for biological process (BP), cellular component (CC), and molecular function (MF). (B) A closer look at genes likely important for gene regulation in the categories of cell-cell signaling, molecular transducer, nucleic acid binding activity (transcription factors), protein binding activity (transcription factors), signaling receptors, receptor regulators, and sequence-specific DNA binding transcription factors.
0 2500 5000 7500
0 12 18 24 6 total
Time point
Number of tr
anscr
ipts
Data subset
MPE > 100, with >= 1 BLAST
MPE > 100
MPE > 0
Transcript molecules per embryo (MPE) by time point
restricting the transcript family analysis to transcripts expressed over 100 molecules per embryo (MPE) and at least 1 BLAST hit (MPE >100,≥1 BLAST hit) across the 5 timepoints, we observed a total of 4,055 transcript families from the 6,169 transcripts passing the filter (Table 3). These computations likely represents an under-estimate of the true number of genes expressed due to an inability to assemble very lowly expressed transcripts and, in a few cases, grouping paralogous genes together.
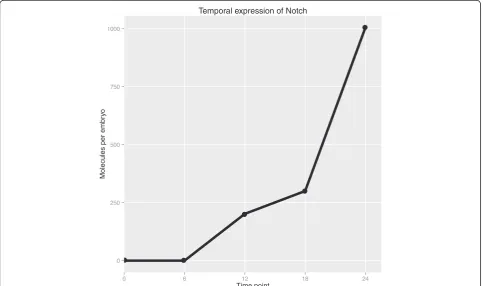
As an example of using the quantitative transcriptome for transcript family analysis, we located the transcripts corresponding to Notch as identified by BLAST. There were three transcripts in this transcript family, one of which is too short and too lowly expressed to be relevant, while the other two are nearly identical and apparently full length. As shown in Figure 6, total Notch molecules per embryo increased from virtually zero copies at 0 h and 6 h, reflecting little or no maternal and early zygotic expression, to significant levels by 12 h, and thence to 1,000 copies at 24 h. A previous study has shown that Notch protein can be seen by in situ as early as 20 h, however, that same study only detected Delta-Notch signaling pathway function at later developmental stages [41]. We also see low levels of a putative Delta-like
ligand, though we cannot conclude whether it is expressed at functional levels, nor can we make the sim-plistic conclusion that because both ligand and receptor are present the signaling pathway is functional. Rather our data suggest further investigation is merited, as also stated in Röttingeret al. [42], the most systematic study of early Nematostellaendomesoderm specification to date.
An estimation of the percentage of the genome tran-scribed during these time periods was computed by tak-ing the length of the longest transcript in each transcript family and dividing that by the length of the genome taken from the estimate in the Nematostella genome paper (450 Mbp) [21]. An important caveat is that this is likely an underestimate because some transcripts are not full length. The percent of the genome transcribed above 100 molecules per embryo according to this cal-culation is 0.368%. The average transcript length for all assembled transcripts is 622.53 bp. When only taking transcripts expressed after spike-in control correction above 0 molecules per embryo, the average transcript length is 456.18 bp. By timepoint, the average of assem-bled and expressed transcripts is: (0 h) 479.95 bp, (6 h) 487.82 bp, (12 h) 490.54 bp, (18 h) 494.03 bp, and (24 h) 441.29 bp.
0 250 500 750 1000
0 6 12 18 24
Time point
Molecules per embr
y
o
Temporal expression of Notch
Figure 6Temporal quantitative expression of Notch.Notch transcript family expression over time. Transcripts that were found to be similar to Notch via Basic Local Alignment Search Tool (BLAST) were grouped into a transcript family (three transcripts total, one very short and lowly expressed and the two others nearly identical). The family’s summed expression in molecules per embryo is shown for all five
Discussion
The goals of the project discussed in this paper were (1) to identify all the protein-coding genes expressed during the first 24 h of Nematostella vectensis develop-ment and in so doing (2) to detail a modern, cost-effective, efficient and quantitative series of experimental and computational methods that together make up a transcriptome pipeline for non-model organisms. A key component of our pipeline is the inclusion of NIST RNA spike-in standards for quantification. This allows us to get around the problem of normalizing data to estimate gene expression levels [43], and provides an absolute measure of transcript abundance per embryo.
Many evolutionary developmental biology ‘evo-devo’ research projects have revealed candidate genes in non-model organisms leading to intriguing hypotheses regard-ing the conservation, or conversely, invention of pathways controlling development [5,44,45]. However, to answer the questions these hypotheses have generated, it is not only the gene homology, presence, absence or spatial localization that needs to be known. To say that a devel-opmental program or subcircuit has been conserved or evolved in a specific way, the cis-regulatory network connections between all the regulatory genes involved must be at a minimum known and validated. Candidate genes identified from BLAST analysis will typically only make up a small fraction of the regulatory genes in any pathway. With the advent of next-generation sequen-cing platforms, identifying all the protein coding genes expressed at any given time during embryonic development is now within the reach of any model system where em-bryos can be acquired. The lack of a sequenced, annotated genome is no longer a major setback to GRN analysis.
The use of polyadenylated spike-in RNAs provides quan-titative information on the absolute abundance of tran-scripts per embryo. It is important to note the difference between this method of standardization and normalization approaches. The ERCC spike-ins allow us to build a stand-ard curve, in our case a 92-point standstand-ard curve. As the quantities of the spike-ins are known, this allows us to infer from the standard curve absolute quantities. Note that since spike-ins are added at the beginning of the library preparation procedures, any variation in preparation effi-ciencies (that is, technical noise) is in theory accounted for by the spike-ins. Thus, even without absolute quantitation, the use of spike-ins allows direct comparison between samples without the distorting effects of normalization to minimize the effects of technical variation. Further, quantitation by spike-ins also allows us to know the limits of our ability to detect and quantify lowly expressed transcripts. Since low expressed transcripts account for many of the problems in bioinfomatics analysis, our 100 molecules per embryo cut-off allows us to focus our analysis on those transcripts expressed at biologically
relevant levels which are also within the linear range of our standard curve. Increasing the sequencing depth and being less conservative with mapping stringency could improve our ability to quantify these lowly expressed transcripts.
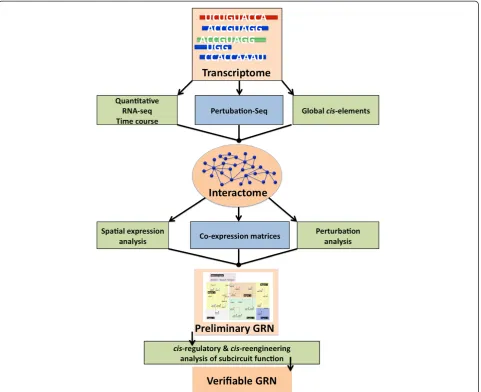
This transcriptome pipeline is part of a larger GRN construction pipeline that we are in the process of defin-ing empirically. A visualization of the proposed workflow for constructing a GRN starting from a sequenced and assembled transcriptome is shown in Figure 7. The tran-scriptome is the starting point and foundation of the GRN because it represents all the transcripts present in the scope of the network. The next datasets to be produced are: a high-density, quantitative RNA-seq timecourse which will be mapped to the full transcriptome, for the purpose of high resolution covariance analysis; a‘Perturbation-seq’ dataset where RNA-seq is used on embryos treated with drugs against components of major signaling pathways; and a genome-wide sequencing-based search for cis-regulatory elements using either FAIRE-seq [46] or DNase I hypersensitivity. A custom computational comparison of these datasets will produce an interactome with clus-ters representing transcripts that change together from timepoint to timepoint or after a perturbation. More sensitive investigation of spatial expression, coexpression and perturbation expression (after morpholino treatment) will take the interactome to the level of a preliminary GRN. Finally,cis-regulatory analysis using bacterial arti-ficial chromosome (BAC) recombination to evaluate subcircuit function will produce a verified GRN with predictive power.
Conclusions
defining the Nematostella gene regulatory network for early pattern formation by building a comprehensive model of gene expression through 24 h of development. This quantitative reference transcriptome will help us identify, in a minimally biased manner, the most relevant genes to the pattern formation control system. The regula-tory network for pattern formation inNematostellawill in turn provide a powerful basis for comparison with early development networks from canonical bilaterians.
In summary, we have presented our quantitative reference transcriptome forNematostella vectensisearly embryogenesis, which is available on the Woods Hole Data
Archive at http://hdl.handle.net/1912/5613 [DOI:10.1575/ 1912/5613]. Additionally, our de novotranscriptome pipe-line, based on the Trinity assembler, has been designed to meet the needs of the evo-devo community.
Additional files
Additional file 1:diginorm_velvet_oases_commands.txt.
Additional file 2:qc_trinity_commands.txt.
Additional file 3:Ordinary least square regression plots.
Additional file 4:Gene ontology (GO) term definitions.
Abbreviations
ERCC:External RNA Controls Consortium; FPKM: fragments per kilobase of exon per million fragments mapped; FSW: filtered sea water; GRN: gene regulatory network; N50 GO: gene ontology; NGS: next generation sequencing; NIST: National Institute of Standards and Technology; nr: non-redundant BLAST database; (q)PCR: (quantitative) polymerase chain reaction.
Competing interests
The authors declare they have no competing interests.
Authors’contributions
ST and JS designed the experiment; DA and SI, in consultation with ST and JS, designed the computational pipeline for thede novotranscriptome assembly. ST performed the experiments. DA performed the Trinity assembly and computational analysis. ST performed the digital normalization and Oases assembly. All authors contributed to the writing of the manuscript. All authors read and approved the final manuscript.
Acknowledgements
We give special thanks to Liliana Florea for her valuable contributions to the design of the Trinityde novoassembly pipeline used in this paper. We thank Kasia Hammar for animal care and technical assistance; Likit Preeyan and C Titus Brown for help with digital normalization and for credit on the Amazon EC2 system; Antje Fischer, Rebecca Helm, Freya Goetz, and Casey Dunn for discussions on experimental protocols; and C Titus Brown also for comments on the manuscript.
Author details
1Eugene Bell Center for Regenerative Biology and Tissue Engineering, Marine
Biological Laboratory, 7 MBL Street, Woods Hole, MA 02543, USA.
2Department of Computer Science and Center for Computational Molecular
Biology, Brown University, 115 Waterman Street, Box 1910, Providence, RI 02912, USA.
Received: 4 January 2013 Accepted: 14 March 2013 Published: 3 June 2013
References
1. Dunn CW, Hejnol A, Matus DQ, Pang K, Browne WE, Smith SA, Seaver E, Rouse GW, Obst M, Edgecombe GD, Sørensen MV, Haddock SHD, Schmidt-Rhaesa A, Okusu A, Kristensen RM, Wheeler WC, Martindale MQ, Giribet G:Broad phylogenomic sampling improves resolution of the animal tree of life.Nature2008,452:745–749.
2. Hejnol A, Obst M, Stamatakis A, Ott M, Rouse GW, Edgecombe GD, Martinez P, Baguna J, Bailly X, Jondelius U, Wiens M, Muller WEG, Seaver E, Wheeler WC, Martindale MQ, Giribet G, Dunn CW:Assessing the root of bilaterian animals with scalable phylogenomic methods.Proc R Soc B2009,276:4261–4270. 3. Mallatt J, Craig CW, Yoder MJ:Nearly complete rRNA genes assembled from across the metazoan animals: effects of more taxa, a structure-based alignment, and paired-sites evolutionary models on phylogeny reconstruction.Mol Phylogenet Evol2010,55:1–17.
4. Martindale MQ, Pang K, Finnerty JR:Investigating the origins of triploblasty:“mesodermal”gene expression in a diploblastic animal, the sea anemoneNematostella vectensis(phylum, Cnidaria; class, Anthozoa). Development2004,131:2463–2474.
5. Wikramanayake AH, Hong M, Lee PN, Pang K, Byrum CA, Bince JM, Xu R, Martindale MQ:An ancient role for nuclear beta-catenin in the evolution of axial polarity and germ layer segregation.Nature2003,426:446–450. 6. Fritzenwanker JH, Saina M, Technau U:Analysis of forkhead and snail
expression reveals epithelial-mesenchymal transitions during embryonic and larval development ofNematostella vectensis.Dev Biol2004, 275:389–402.
7. Matus DQ, Thomsen GH, Martindale MQ:Dorso/ventral genes are asymmetrically expressed and involved in germ-layer demarcation during cnidarian gastrulation.Curr Biol2006,16:499–505.
8. Rentzsch F, Anton R, Saina M, Hammerschmidt M, Holstein TW, Technau U: Asymmetric expression of the BMP antagonists chordin and gremlin in the sea anemoneNematostella vectensis: implications for the evolution of axial patterning.Dev Biol2006,296:375–387.
9. Stathopoulos A, Levine M:Genomic regulatory networks and animal development.Dev Cell2005,9:449–462.
10. Davidson EH, Levine MS:Properties of developmental gene regulatory networks.Proc Natl Acad Sci USA2008,105:20063–20066.
11. Davidson EH:The Regulatory Genome.London, UK: Academic Press; 2006. 12. Imai KS, Levine M, Satoh N, Satou Y:Regulatory blueprint for a chordate
embryo.Science2006,312:1183–1187.
13. Betancur P, Bronner-Fraser M, Sauka-Spengler T:Assembling neural crest regulatory circuits into a gene regulatory network.Annu Rev Cell Dev Biol
2010,26:581–603.
14. Swiers G, Patient R, Loose M:Genetic regulatory networks programming hematopoietic stem cells and erythroid lineage specification.Dev Biol
2006,294:525–540.
15. Tu Q, Cameron RA, Worley KC, Gibbs RA, Davidson EH:Gene structure in the sea urchin Strongylocentrotus purpuratus based on transcriptome analysis.Genome Res2012,22:2079–2087.
16. Martin J, Wang Z:Next-generation transcriptome assembly.Nat Rev Genet
2011,12:671–682.
17. Brown CT, Howe A, Zhang Q, Pyrkosz A, Brom T:A reference-free algorithm for computational normalization of shotgun sequencing data. [http://arxiv.org/abs/1203.4802].
18. Miller JR, Koren S, Sutton G:Assembly algorithms for next-generation sequencing data.Genomics2010,95:315–327.
19. Salzberg SL, Yorke JA:Beware of mis-assembled genomes.Bioinformatics
2005,21:4320–4321.
20. Ryan JF, Burton PM, Mazza ME, Kwong GK, Mullikin JC, Finnerty JR:The cnidarian-bilaterian ancestor possessed at least 56 homeoboxes: evidence from the starlet sea anemone,Nematostella vectensis.Genome Biol2006, 7:R64.
21. Putnam NH, Srivastava M, Hellsten U, Dirks B, Chapman J, Salamov A, Terry A, Shapiro H, Lindquist E, Kapitonov VV, Jurka J, Genikhovich G, Grigoriev IV, Lucas SM, Steele RE, Finnerty JR, Technau U, Martindale MQ, Rokhsar DS: Sea anemone genome reveals ancestral eumetazoan gene repertoire and genomic organization.Science2007,317:86–94.
22. Zeng V, Villanueva KE, Ewen-Campen BS, Alwes F, Browne WE, Extavour CG:
De novoassembly and characterization of a maternal and developmental transcriptome for the emerging model crustacean
Parhyale hawaiensis.BMC Genomics2011,12:581.
23. Ewen-Campen B, Shaner N, Panfilio KA, Suzuki Y, Roth S, Extavour CG:The maternal and early embryonic transcriptome of the milkweed bug
Oncopeltus fasciatus.BMC Genomics2011,12:61.
24. Conaco C, Neveu P, Zhou H, Arcila ML, Degnan SM, Degnan BM, Kosik KS: Transcriptome profiling of the demospongeAmphimedon queenslandica
reveals genome-wide events that accompany major life cycle transitions. BMC Genomics2012,13:209.
25. Robertson G, Schein J, Chiu R, Corbett R, Field M, Jackman SD, Mungall K, Lee S, Okada HM, Qian JQ, Griffith M, Raymond A, Thiessen N, Cezard T, Butterfield YS, Newsome R, Chan SK, She R, Varhol R, Kamoh B, Prabhu A-L, Tam A, Zhao Y, Moore RA, Hirst M, Marra MA, Jones SJM, Hoodless PA, Birol I:
De novoassembly and analysis of RNA-seq data.Nat Methods2010, 7:909–912.
26. Li R, Zhu H, Ruan J, Qian W, Fang X, Shi Z, Li Y, Li S, Shan G, Kristiansen K, Li S, Yang H, Wang J, Wang J:De novoassembly of human genomes with massively parallel short read sequencing.Genome Res2010,20:265–272. 27. Zerbino DR, Birney E:Velvet: algorithms forde novoshort read assembly
using de Bruijn graphs.Genome Res2008,18:821–829.
28. Schulz MH, Zerbino DR, Vingron M, Birney E:Oases: robustde novoRNA-seq assembly across the dynamic range of expression levels.Bioinformatics
2012,28:1086–1092.
29. Grabherr MG, Haas BJ, Yassour M, Levin JZ, Thompson DA, Amit I, Adiconis X, Fan L, Raychowdhury R, Zeng Q, Chen Z, Mauceli E, Hacohen N, Gnirke A, Rhind N, di Palma F, Birren BW, Nusbaum C, Lindblad-Toh K, Friedman N, Regev A:Full-length transcriptome assembly from RNA-seq data without a reference genome.Nat Biotechnol2011,29:644–652.
30. Zhao Q-Y, Wang Y, Kong Y-M, Luo D, Li X, Hao P:Optimizingde novo
transcriptome assembly from short-read RNA-seq data: a comparative study.BMC Bioinformatics2011,12(Suppl 14):S2.
31. Hansen KD, Brenner SE, Dudoit S:Biases in Illumina transcriptome sequencing caused by random hexamer priming.Nucleic Acids Res2010,38:e131–e131. 32. Venables WN, Ripley BD:Modern Applied Statistics with S.Berlin, Germany:
Springer Verlag; 2002.
34. Vijay N, Poelstra JW, Künstner A, Wolf JBW:Challenges and strategies in transcriptome assembly and differential gene expression quantification. A comprehensivein silicoassessment of RNA-seq experiments.Mol Ecol
2013,22:620–634.
35. Baker SC, Bauer SR, Beyer RP, Brenton JD, Bromley B, Burrill J, Causton H, Conley MP, Elespuru R, Fero M, Foy C, Fuscoe J, Gao X, Gerhold DL, Gilles P, Goodsaid F, Guo X, Hackett J, Hockett RD, Ikonomi P, Irizarry RA, Kawasaki ES, Kaysser-Kranich T, Kerr K, Kiser G, Koch WH, Lee KY, Liu C, Liu ZL, Lucas A,et al: The External RNA Controls Consortium: a progress report.Nat Methods
2005,2:731–734.
36. Devonshire AS, Elaswarapu R, Foy CA:Evaluation of external RNA controls for the standardisation of gene expression biomarker measurements. BMC Genomics2010,11:662.
37. External RNA Controls Consortium:Proposed methods for testing and selecting the ERCC external RNA controls.BMC Genomics2005,6:150. 38. Li B, Dewey CN:RSEM: accurate transcript quantification from RNA-seq
data with or without a reference genome.BMC Bioinformatics2011, 12:323.
39. Conesa A, Götz S, García-Gómez JM, Terol J, Talón M, Robles M:Blast2GO: a universal tool for annotation, visualization and analysis in functional genomics research.Bioinformatics2005,21:3674–3676.
40. Alexa A, Rahnenfuher J:topGO: enrichment analysis for gene ontology. [http://www.bioconductor.org/packages/2.11/bioc/html/topGO.html]. 41. Marlow H, Roettinger E, Boekhout M, Martindale MQ:Functional roles of
Notch signaling in the cnidarianNematostella vectensis.Dev Biol2012, 362:295–308.
42. Röttinger E, Dahlin P, Martindale MQ:A framework for the establishment of a Cnidarian gene regulatory network for“endomesoderm”specification: the inputs ofβ-catenin/TCF signaling.PLoS Genet2012,8:e1003164.
43. Tarazona S, García-Alcalde F, Dopazo J, Ferrer A, Conesa A:Differential expression in RNA-seq: a matter of depth.Genome Res2011,21:2213–2223. 44. Yamada A, Pang K, Martindale MQ, Tochinai S:Surprisingly complex T-box gene complement in diploblastic metazoans.Evol Dev2007,9:220–230. 45. Adamska M, Larroux C, Adamski M, Green K, Lovas E, Koop D, Richards GS,
Zwafink C, Degnan BM:Structure and expression of conserved Wnt pathway components in the demospongeAmphimedon queenslandica. Evol Dev2010,12:494–518.
46. Giresi PG:Chromatin profiles of human cells in health and disease using FAIRE.
Ann Arbor, MI: ProQuest; 2012.
doi:10.1186/2041-9139-4-16
Cite this article as:Tulinet al.:A quantitative reference transcriptome
forNematostella vectensisearly embryonic development: a pipeline for
de novoassembly in emerging model systems.EvoDevo20134:16.
Submit your next manuscript to BioMed Central and take full advantage of:
• Convenient online submission
• Thorough peer review
• No space constraints or color figure charges
• Immediate publication on acceptance
• Inclusion in PubMed, CAS, Scopus and Google Scholar
• Research which is freely available for redistribution