R E S E A R C H A R T I C L E
Open Access
Teachers teaching misconceptions: a study of
factors contributing to high school biology
students
’
acquisition of biological evolution-related
misconceptions
Tony B Yates
1*and Edmund A Marek
2Abstract
Background:Research has revealed that high school students matriculate to college holding misconceptions related to biological evolution. These misconceptions interfere with students’abilities to grasp accurate scientific explanations and serve as fundamental barriers to understanding evolution. Because the scientific community regards evolution as a vital part of science education, it is imperative that students’misconceptions are identified and their sources revealed. The purpose of this study was to identify the types and prevalence of biological evolution-related misconceptions held by high school biology teachers and their students, and to identify those factors that contribute to student acquisition of such misconceptions, with particular emphasis given to the role of the teacher.
Methods:Thirty-five teachers who taught at least one section of Biology I during the 2010 to 2011 academic year in one of 32 Oklahoma public high schools and their respective 536 students served as this study’s unit of analysis. The Biological Evolution Literacy Survey, which possesses 23 biological evolution misconception statements grouped into five categories, served as the research tool for identifying teachers’misconceptions prior to student instruction and students’
misconceptions both prior to and following instruction in biological evolution concepts, calculating conception index scores, and collecting demographic data. Multiple statistical analyses were performed to identify statistically significant (p < .05) relationships between variables related to student’s acquisition of biological evolution-related misconceptions.
Results:Analyses revealed that students typically exit the Biology I classroom more confident in their biological evolution knowledge but holding greater numbers of misconceptions than they initially possessed upon entering the course. Significant relationships between student acquisition of misconceptions and teachers’bachelor’s degree field, terminal degree, and hours dedicated to evolution instruction were also revealed. In addition, the probabilities that specific biological evolution-related misconceptions were being transmitted from teachers to their students were also identified. Conclusions:This study reveals some problematic issues concerning the teaching of biological evolution in Oklahoma’s public high school introductory biology course. No doubt, multiple factors contribute in varying degrees to the
acquisition and retention of student misconceptions of biological evolution. However, based on this study’s results, there is little doubt that teachers may serve as sources of biological evolution-related misconceptions or, at the very least, propagators of existing misconceptions. It is imperative that we as educators identify sources of student biological evolution-related misconceptions, identify or develop strategies to reduce or eliminate such misconceptions, and implement these strategies at the appropriate junctures in students’ cognitive development.
Keywords:Biology education; Biology teachers; Evolution education; Misconception; Oklahoma; Public high school; Students
* Correspondence:[email protected] 1
Oklahoma Baptist University, James E. Hurley College of Science and Mathematics, 500 West University, OBU Box 61722, Shawnee, OK 74804, USA Full list of author information is available at the end of the article
Background
A misconception is defined as‘a perception of phenom-ena occurring in the real world which is not consist-ent with the sciconsist-entific explanation of the phenomena’ (Modell et al. 2005, p. 20). Numerous studies reveal that high school students enter college biology courses holding misconceptions related to biological evolution (Bishop and Anderson 1990; Brumby 1984; Wescott and Cunningham 2005; Wilson 2001). These misconceptions range from minor misunderstandings to complete theory rejection (Alters and Alters 2001; Dagher and BouJaoude 2005; Evans 2001; Mazur 2004; McComas 2006; Sadler 2005) and are typically complex and strongly held, serving as fun-damental barriers to students’ understanding of accurate scientific explanations concerning evolution that are pre-sented in class (Bishop and Anderson 1990; Brumby 1984; Ferrari and Chi 1998; Jiménez-Aleixandre and Fernández-Pérez 1987; Meir et al. 2007; Wescott and Cunningham 2005; Wilson 2001).
Misconceptions are held by novices and experts alike (Palmquist and Finley 1997). It is therefore logical to as-sume that teachers, too, hold a range of misconceptions (Kikas 2004). A number of studies revealed that many teachers, including those with experience, operate while holding misconceptions about various biological con-cepts (for example, Affanato 1986; Bishop and Anderson 1990; Brumby 1984; Chinsamy and Plagányi 2007; Clough and Wood-Robinson 1985; Demastes et al. 1995; Greene 1990; Nehm and Schonfeld 2007; Osif 1997; Settlage 1994; Yates and Marek 2013; Yip 1998). In fact, research indi-cates that teachers adhere to many of the same biological evolution misconceptions as their students (Bishop and Anderson 1990; Brumby 1984; Demastes et al. 1995; Nehm and Schonfeld 2007; Settlage 1994). As Nehm and Schonfeld (2007) concluded, ‘one cannot assume that biology teachers with extensive backgrounds in biology have an accurate working knowledge of evolution, natural selection, or the nature of science’(p. 716).
The scientific community regards evolution as a vital part of science education (National Academy of Sciences 1998) yet evolutionary theory is one of the most com-monly misunderstood areas of biology (Gregory 2009). In order to ensure that students complete their science courses with accurate understanding and working know-ledge of biological evolution, it is imperative to identify sources of confusion concerning evolution (Modellet al. 2005; National Research Council 1996; Novak 2002; Wescott and Cunningham 2005). Understanding both students’and teachers’conceptions of the theory of evolu-tion requires an investigaevolu-tion into the variety of factors that might influence the development of such conceptions (Hokayem and BouJaoude 2008). Much recent research concerning misconceptions in general, and misconceptions of biological evolutionary theory in particular, attempts to
reveal causative agents. This research has determined that sources from which these conceptual difficulties arise are varied and complex (Modell et al. 2005). A question of particular interest in this study is: are high school biology teachers sources of students’ biological evolution misconceptions?
Taught-and-learned misconceptions are misconcep-tions that have been taught by parents, teachers, and others or unconsciously learned from fiction (Alters and Nelson 2002). In instructor-centered teaching, the in-structor determines, primarily from tradition and discip-linary content, exactly what is to be taught and how it should be taught (Alters and Nelson 2002). For teachers possessing biological evolution-related misconceptions, this suggests these teachers may convey those miscon-ceptions to their students through inaccurate teach-ing (Alters and Nelson 2002; Barrass 1984; Driver et al. 1994; Fisher 2004; Haidar 1997; Jarvis et al. 2003; Lawrenz 1986; Mohapatra and Bhattacharyya 1989; Sanders 1993; Wandersseeet al.1994; Yip 1998), critically impeding student conceptual development of accurate sci-entific explanations (Crawford et al. 2005; Fisher 2004; Jarvis et al. 2003; Kikas 2004). Evidence therefore indi-cates there is great potential for teachers’ biological evolution-related misconceptions to be taught to their students (Fisher 2004; Wood-Robinson 1994).
on locales (city, suburb, town, and rural: Institute of Education Sciences National Center for Educational Statistics 2010b). Although no claim is made that the results of this study, confined to public high schools within the state of Oklahoma, represent those of the entire coun-try or other geographical regions, the findings are relevant and do contribute to the biological evolution misconcep-tion literature.
Method
Context
State science standards are the basis for what teachers teach and students learn and thereby establish the foun-dation for states’ desired science education outcomes (Moore 2009). The state of Oklahoma sets academic standards and assessments aligned to those standards. The Oklahoma State Department of Education’s
Pri-ority Academic Student Skills (PASS; Oklahoma State
Department of Education 2009a) was developed in 1993 based on the National Science Education Standards (National Research Council 1996) and the Benchmarks for Scientific Literacy by the American Association for the Advancement of Science (1993). PASS science stan-dards present a framework for what students should know, understand, and be able to do in the natural sci-ences (National Research Council 1996). High school Biology I possesses several PASS content standards that emphasize biological evolution-related concepts, about which teachers should be thoroughly knowledgeable and should accurately teach to their students in Biology I.
The Oklahoma End-of-Instruction Biology I Alignment
Blueprint (Oklahoma State Department of Education
2008–2009) calls for approximately 28% to 39% of the test to cover biological evolution-related concepts. PASS biological evolution-related standards were a primary ref-erence in the development of both teacher and student survey instruments employed in this study. Both detailed PASS science standards and the Oklahoma End-of-Instruction Biology I Alignment Blueprint can be accessed via URLs identified in the References section.
Participants and course
Initially a recruitment letter was sent addressed to the Science Department Chairs of each of the 474 public high schools in the state of Oklahoma, requesting them to pass the letter on to one teacher within the high school who met the study’s criteria. However, multiple teacher recruitment letters were distributed in some schools by the initial contact. A total of 76 teachers from 73 public high schools volunteered for the study, produ-cing a 15.4% school response rate, with 35 of those teachers having met the study’s requirements. Thus, par-ticipants in this study included 35 public high school biology teachers (17 men and 18 women) and their
respective high school students (N= 536) enrolled in one Biology I course section taught by the teacher. In the event that a teacher participant taught more than one Biology I course section, the teacher selected the study’s participating class. Teacher participants were employed on a full-time basis during the 2010 to 2011 academic year by a collective 32 (6.8%) of the 474 public high schools (Oklahoma State Department of Education 2009b) located within the state of Oklahoma, which served as the study region. For the purposes of this study, a high school was defined as a secondary school offering any combin-ation of grades 9 through 12. All teacher participants pos-sessed a current Oklahoma state teaching license obtained by meeting state licensure criteria (Oklahoma State Board of Education 2011). These criteria included a minimum of a bachelor’s degree and passing scores on state certifica-tion tests. All teacher participants were certified to teach biological sciences within the state of employment and taught at least one Biology I section at the high school level during the 2010 to 2011 academic year. Each poten-tial teacher participant who met the study’s criteria and volunteered to participate was presented with anInformed Consent to Participate in a Research Studyform approved by the researchers’ university Office of Human Research Participant Protection.
Student participants included 536 public high school students (249 boys and 287 girls) enrolled during the 2010 to 2011 academic year in one of the study’s public high schools. Beginning in the fall of 2010, all student participants were first-time enrollees in a Biology I course taught by one of the 35 teacher participants. Biology I, a core curriculum course that is required for high school graduation (Oklahoma State Department of Education 2009c), is typically taken by freshmen and sophomore stu-dents. Biology I investigates content, concepts, and princi-ples of major themes in the biological sciences, including biological evolution (Oklahoma State Department of Education 2009a) and serves as the prerequisite course for subsequent biology courses students may take (Oklahoma State Department of Education 2009c). Students’ par-ticipation involved regular classroom instruction activities administered by the teacher participants. Because the re-searcher did not interact with the students they were not required by the researchers’ institute’s Internal Review Board to complete an Informed Consent to Participate in a Research Study form.
Instrumentation
who volunteered for the study completing the teacher version of the BEL Survey in May 2010. These teacher participants were instructed to administer the student pre-instruction version of the BEL Survey to students in one Biology I course section within the initial week of the fall 2010 semester. By administering the survey as early as possible in the course, teacher and curriculum influences on students’ knowledge and opinions related to the BEL Survey statements were limited. In addition, by surveying students in only one Biology I section, peer influence was reduced. Subsequently, teachers were instructed to administer an identical post-instruction student BEL Survey following instruction in biological evo-lution concepts or at the completion of the course.
With permission, the BEL Survey was modeled after Cunningham and Wescott’s 2009 survey which was adapted from Almquist and Cronin (1988) with addi-tions from Wilson (2001), and Bishop and Anderson (1986, 1990). The purpose of Cunningham and Wescott’s 2009 study was to identify the common misconceptions held by undergraduate students and attempt to explain the reasoning behind those misconceptions. In addition, Cunningham and Wescott were interested in assessing how students’opinions and understanding of evolutionary theory may have changed in the interim since the 1988 Almquist and Cronin study, which attempted to identify college and university students’basic knowledge concern-ing the processes of evolution as well as their opinions on science and religion issues.
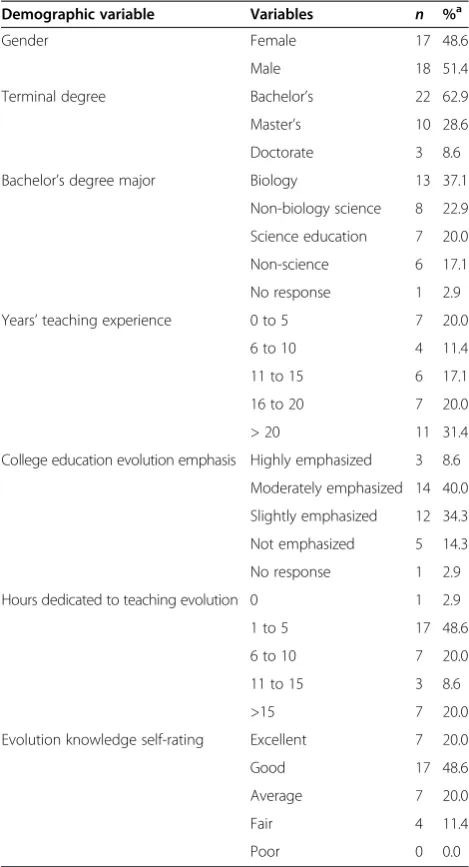
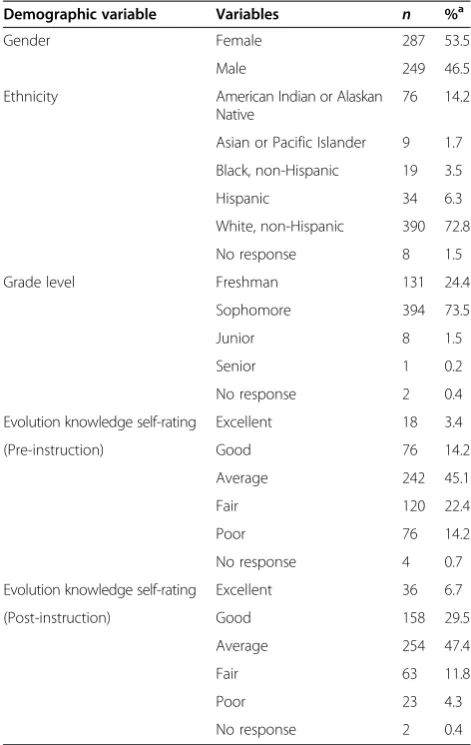
The BEL Survey is composed of two sections, the demographics section and the survey section. Whereas the survey sections were identical for teacher and stu-dent participants, the demographics sections varied. Demographic data requested from teacher participants included gender, terminal degree, bachelor’s degree major, years of teaching experience, college education emphasis on evolution, hours dedicated to teaching evo-lution, and self-rating of evolution knowledge (Table 1). Demographic data requested for students included gen-der, ethnicity, grade level, self-rating of knowledge of evolution (Table 2), and whether the student had previ-ously enrolled in a Biology I course. Any student whose survey indicated previous enrollment in a Biology I course was omitted from the study. In addition, three questions were posed that allowed matching of pre- and post-instruction BEL Survey responses to the same stu-dent while still maintaining anonymity. These questions called for the identification of gender, birthdate, and number of both male and female siblings.
The survey section of the BEL Survey asked both teacher and student participants to respond to whether they strongly agree, somewhat agree, somewhat disagree, strongly disagree, or have no opinion (‘undecided/or never heard of it’) on 23 statements related to biological
evolution-related misconceptions. Cronbach’s alpha of 0.848 was identified for the 23-statement BEL Survey, which indicates that the internal reliability of the survey was acceptable. Additionally, if any one statement was deleted, the reliability coefficient did not decrease by more than 0.014, thus maintaining the survey’s internal reliability.
During data analysis, two methods of scoring re-sponses were used. First, the rere-sponses ‘strongly agree’ and ‘somewhat agree’ were combined, indicating partici-pant agreement with the statement. Likewise, the re-sponses ‘strongly disagree’and ‘somewhat disagree’were combined, indicating participant disagreement with the Table 1 Teacher profile
Demographic variable Variables n %a
Gender Female 17 48.6
Male 18 51.4
Terminal degree Bachelor’s 22 62.9
Master’s 10 28.6
Doctorate 3 8.6
Bachelor’s degree major Biology 13 37.1
Non-biology science 8 22.9
Science education 7 20.0
Non-science 6 17.1
No response 1 2.9
Years’teaching experience 0 to 5 7 20.0
6 to 10 4 11.4
11 to 15 6 17.1
16 to 20 7 20.0
> 20 11 31.4
College education evolution emphasis Highly emphasized 3 8.6
Moderately emphasized 14 40.0
Slightly emphasized 12 34.3
Not emphasized 5 14.3
No response 1 2.9
Hours dedicated to teaching evolution 0 1 2.9
1 to 5 17 48.6
6 to 10 7 20.0
11 to 15 3 8.6
>15 7 20.0
Evolution knowledge self-rating Excellent 7 20.0
Good 17 48.6
Average 7 20.0
Fair 4 11.4
Poor 0 0.0
a
statement. Second, a biological evolution misconception scoring index for the statements was created by Likert scaling of responses with answers to statements indica-tive of a low acceptance of an evolution concept (high ac-ceptance of the associated misconception) receiving low scores and responses to statements indicative of a high acceptance of an evolution concept (nonacceptance of misconception) receiving high scores. For statements in which agreement indicated a nonacceptance of the asso-ciated misconception (statements 2, 4, 8, 10, 11, 14, 15, 18, 20, 23), index scoring was as follows: (a) strongly agree, score of 5; (b) somewhat agree, 4; (c) undecided/ never heard of it, 3; (d) somewhat disagree, 2; (e) strongly disagree, 1; and (f ) no response, 0. For statements in which agreement indicated a high acceptance of the associated misconception (statements 1, 3, 5, 6, 7, 9, 12, 13, 16, 17, 19, 21, 22), index scoring was as follows: (a) strongly agree, score of 1; (b) somewhat agree, 2; (c) undecided/never heard of it, 3; (d) somewhat disagree,
4; (e) strongly disagree, 5; and (f ) no response, 0. The possible range of BEL Survey index scores was 0 to 115 with a score of 115 representing the highest level of understanding of those evolution concepts revealed by the BEL Survey coupled with a lack of associated mis-conceptions whereas lower indices represented lower levels of understanding combined with higher levels of misconceptions. In addition, a simple count of the number of misconceptions revealed by responses to the 23 BEL Survey statements was conducted for both teacher and student participants.
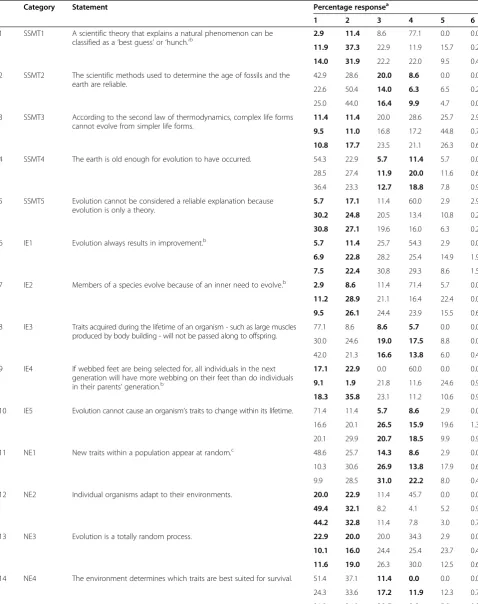
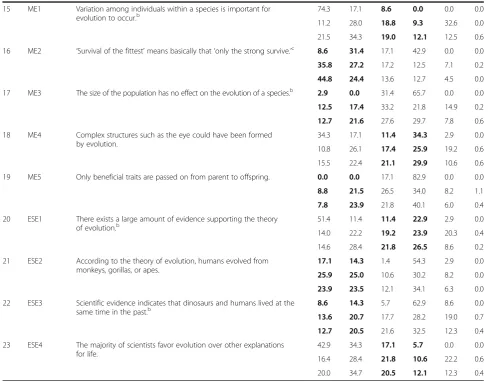
Cunningham and Wescott’s (2009) survey instrument on which the BEL Survey is modeled contained 24 state-ments classified into four categories: evolutionary theory, scientific facts, process of evolution, and language of sci-ence. For the present study, Cunningham and Wescott’s four-category classification was modified into five cat-egories of biological evolution-related misconceptions that are commonly employed in the literature (for ex-ample, Alters and Alters 2001; Bishop and Anderson 1990; Greene 1990; Gregory 2009; Jensen and Finley 1996; Wandersseeet al. 1994; Wescott and Cunningham 2005; Wilson 2001). These misconception categories in-clude science, scientific methodology and terminology (SSMT); intentionality of evolution (IE); nature of evolu-tion (NE); mechanisms of evoluevolu-tion (ME); and evidence supporting evolution (ESE). The SSMT and ESE mis-conception categories are self-described; the IE category addresses misconceptions that subscribe a type of con-scious will and directive to the mechanisms of evolution; the NE category presents misconceptions concerning factors that influence biological evolution such as the environment, chance, and the roles of the individual ver-sus the population; and the ME category illuminates misconceptions of those mechanisms that produce evo-lutionary change, such as mutations and natural selec-tion. Five biological evolution-related misconception statements were identified or developed for each of the SSMT, IE, and ME categories, and four such statements were identified or developed for each of the NE and ESE categories. The resulting 23 statements were subse-quently included in the BEL Survey (Table 3), whereas category identification was omitted. Two BEL Survey statements (11 and 16) were acquired directly and eight statements (1, 6, 7, 9, 15, 17, 20, 22) were adapted from Cunningham and Wescott’s survey; the remaining 13 statements (2, 3, 4, 5, 8, 10, 12, 13, 14, 18, 19, 21, 23) were developed through an extensive search of biological evolution misconception literature.
Data analysis
Multiple statistical analyses were performed to identify statistically significant (p< .05) relationships between variables related to students’ acquisition of biological Table 2 Student profile
Demographic variable Variables n %a
Gender Female 287 53.5
Male 249 46.5
Ethnicity American Indian or Alaskan Native
76 14.2
Asian or Pacific Islander 9 1.7
Black, non-Hispanic 19 3.5
Hispanic 34 6.3
White, non-Hispanic 390 72.8
No response 8 1.5
Grade level Freshman 131 24.4
Sophomore 394 73.5
Junior 8 1.5
Senior 1 0.2
No response 2 0.4
Evolution knowledge self-rating Excellent 18 3.4
(Pre-instruction) Good 76 14.2
Average 242 45.1
Fair 120 22.4
Poor 76 14.2
No response 4 0.7
Evolution knowledge self-rating Excellent 36 6.7
(Post-instruction) Good 158 29.5
Average 254 47.4
Fair 63 11.8
Poor 23 4.3
No response 2 0.4
a
Table 3 BEL survey statement teachers’and students’percent responses
Category Statement Percentage responsea
1 2 3 4 5 6
1 SSMT1 A scientific theory that explains a natural phenomenon can be classified as a‘best guess’or‘hunch.’b
2.9 11.4 8.6 77.1 0.0 0.0
11.9 37.3 22.9 11.9 15.7 0.2
14.0 31.9 22.2 22.0 9.5 0.4
2 SSMT2 The scientific methods used to determine the age of fossils and the earth are reliable.
42.9 28.6 20.0 8.6 0.0 0.0
22.6 50.4 14.0 6.3 6.5 0.2
25.0 44.0 16.4 9.9 4.7 0.0
3 SSMT3 According to the second law of thermodynamics, complex life forms cannot evolve from simpler life forms.
11.4 11.4 20.0 28.6 25.7 2.9
9.5 11.0 16.8 17.2 44.8 0.7
10.8 17.7 23.5 21.1 26.3 0.6
4 SSMT4 The earth is old enough for evolution to have occurred. 54.3 22.9 5.7 11.4 5.7 0.0
28.5 27.4 11.9 20.0 11.6 0.6
36.4 23.3 12.7 18.8 7.8 0.9
5 SSMT5 Evolution cannot be considered a reliable explanation because evolution is only a theory.
5.7 17.1 11.4 60.0 2.9 2.9
30.2 24.8 20.5 13.4 10.8 0.2
30.8 27.1 19.6 16.0 6.3 0.2
6 IE1 Evolution always results in improvement.b 5.7 11.4 25.7 54.3 2.9 0.0
6.9 22.8 28.2 25.4 14.9 1.9
7.5 22.4 30.8 29.3 8.6 1.5
7 IE2 Members of a species evolve because of an inner need to evolve.b 2.9 8.6 11.4 71.4 5.7 0.0
11.2 28.9 21.1 16.4 22.4 0.0
9.5 26.1 24.4 23.9 15.5 0.6
8 IE3 Traits acquired during the lifetime of an organism - such as large muscles produced by body building - will not be passed along to offspring.
77.1 8.6 8.6 5.7 0.0 0.0
30.0 24.6 19.0 17.5 8.8 0.0
42.0 21.3 16.6 13.8 6.0 0.4
9 IE4 If webbed feet are being selected for, all individuals in the next generation will have more webbing on their feet than do individuals in their parents’generation.b
17.1 22.9 0.0 60.0 0.0 0.0
9.1 1.9 21.8 11.6 24.6 0.9
18.3 35.8 23.1 11.2 10.6 0.9
10 IE5 Evolution cannot cause an organism’s traits to change within its lifetime. 71.4 11.4 5.7 8.6 2.9 0.0
16.6 20.1 26.5 15.9 19.6 1.3
20.1 29.9 20.7 18.5 9.9 0.9
11 NE1 New traits within a population appear at random.c 48.6 25.7 14.3 8.6 2.9 0.0
10.3 30.6 26.9 13.8 17.9 0.6
9.9 28.5 31.0 22.2 8.0 0.4
12 NE2 Individual organisms adapt to their environments. 20.0 22.9 11.4 45.7 0.0 0.0
49.4 32.1 8.2 4.1 5.2 0.9
44.2 32.8 11.4 7.8 3.0 0.7
13 NE3 Evolution is a totally random process. 22.9 20.0 20.0 34.3 2.9 0.0
10.1 16.0 24.4 25.4 23.7 0.4
11.6 19.0 26.3 30.0 12.5 0.6
14 NE4 The environment determines which traits are best suited for survival. 51.4 37.1 11.4 0.0 0.0 0.0
24.3 33.6 17.2 11.9 12.3 0.7
evolution-related misconceptions. Dependent-samples t-tests were conducted to compare students’ mean data to specific variables. These variables included pre- and post-instruction BEL Survey mean index scores, number of misconceptions, student self-knowledge rating, and student BEL Survey Likert scale responses.
Independent-samplest-tests were conducted to evalu-ate the null hypotheses stating there were no significant differences (p< .05) between the mean difference in the number of students’ pre- and post-instruction mis-conceptions based on students’ or teachers’ gender. Independent-samplest-tests were utilized to identify sig-nificant differences (p< .05) between the mean change in the number of students’ pre-and post-instruction bio-logical evolution misconceptions when student data from teachers in a High Index Score Group (HISG) and
those in a Low Index Score Group (LISG) were compared. Finally, independent-samples t-tests were employed in identifying significant differences (p< .05) in the mean change in students’pre- to post-instruction misconception numbers related to whether the students’ teachers pos-sessed or did not possess the specified misconceptions.
One-way analysis of variance (ANOVA) were performed to identify significant differences (p< .05) between the mean difference in number of students’ pre- and post-instruction misconceptions and student, teacher, and school variables. Student variables included grade, ethni-city, and both pre- and post-instruction biological evolu-tion knowledge self-ratings. Teacher variables included terminal degree, bachelor’s degree major, years of teaching experience, college emphasis placed on evolution, evolu-tion knowledge rating, and number of hours dedicated to
Table 3 BEL survey statement teachers’and students’percent responses(Continued)
15 ME1 Variation among individuals within a species is important for evolution to occur.b
74.3 17.1 8.6 0.0 0.0 0.0
11.2 28.0 18.8 9.3 32.6 0.0
21.5 34.3 19.0 12.1 12.5 0.6
16 ME2 ‘Survival of the fittest’means basically that‘only the strong survive.’c 8.6 31.4 17.1 42.9 0.0 0.0
35.8 27.2 17.2 12.5 7.1 0.2
44.8 24.4 13.6 12.7 4.5 0.0
17 ME3 The size of the population has no effect on the evolution of a species.b 2.9 0.0 31.4 65.7 0.0 0.0
12.5 17.4 33.2 21.8 14.9 0.2
12.7 21.6 27.6 29.7 7.8 0.6
18 ME4 Complex structures such as the eye could have been formed by evolution.
34.3 17.1 11.4 34.3 2.9 0.0
10.8 26.1 17.4 25.9 19.2 0.6
15.5 22.4 21.1 29.9 10.6 0.6
19 ME5 Only beneficial traits are passed on from parent to offspring. 0.0 0.0 17.1 82.9 0.0 0.0
8.8 21.5 26.5 34.0 8.2 1.1
7.8 23.9 21.8 40.1 6.0 0.4
20 ESE1 There exists a large amount of evidence supporting the theory of evolution.b
51.4 11.4 11.4 22.9 2.9 0.0
14.0 22.2 19.2 23.9 20.3 0.4
14.6 28.4 21.8 26.5 8.6 0.2
21 ESE2 According to the theory of evolution, humans evolved from monkeys, gorillas, or apes.
17.1 14.3 1.4 54.3 2.9 0.0
25.9 25.0 10.6 30.2 8.2 0.0
23.9 23.5 12.1 34.1 6.3 0.0
22 ESE3 Scientific evidence indicates that dinosaurs and humans lived at the same time in the past.b
8.6 14.3 5.7 62.9 8.6 0.0
13.6 20.7 17.7 28.2 19.0 0.7
12.7 20.5 21.6 32.5 12.3 0.4
23 ESE4 The majority of scientists favor evolution over other explanations for life.
42.9 34.3 17.1 5.7 0.0 0.0
16.4 28.4 21.8 10.6 22.2 0.6
20.0 34.7 20.5 12.1 12.3 0.4
Percent response is identified as follows: first row, teacher participants (N= 35); second row, pre-instruction student participants (N= 536); third row, post-instruction student participants (N = 536). Bold areas indicate percentage of participants accepting the statement-related misconception.a
teaching evolution in the Biology I course. Public high school variables of urban-centric classification and ADM were analyzed to determine if public high school location and/or student population size played significant roles in the difference between the mean number of students’ pre-and post- instruction biological evolution misconceptions. Dunnett’s T3 test was utilized as a follow-up test to evalu-ate pairwise differences among means for statistically sig-nificant ANOVA results.
To assess the degree to which the numbers of teachers’ misconceptions were linearly related to students’ post-instruction BEL Survey index scores, Pearson product-moment correlation coefficient (r) was utilized. Finally, a chi-square goodness-of-fit statistical analysis was employed to identify any significant differences (p< .05) among vari-ables related to the participants’public high schools when compared to the total number of public high schools within the study region. Those variables included urban-centric location and ADM.
Results
Participant demographics
Table 1 presents the teacher participant profile. Gender was evenly distributed with 17 men and 18 women. While all teacher participants possessed bachelor’s de-grees, 37.1% (n = 13) held graduate degrees as well. Biology bachelor’s degrees were held by 37.1% of the participants (n= 13) whereas science education degrees, non-biology science degrees, and non-science degrees were fairly evenly distributed among the remaining par-ticipants, ranging from 17.1% to 22.9%. Prior to this study, 20.0% (n = 7) of the teacher participants had five or fewer years of teaching experience; 31.4% (n= 11) ten or fewer years teaching experience; and 31.4% (n = 11) had accumulated over 20 years of experience in the classroom. When asked to identify the emphasis given to evolution in their college education, 48.6% (n= 17) of participants indicated that evolution was either highly or moderately emphasized and an identical 48.6% (n = 17) noted the emphasis given to evolution was either slight or non-existent. In rating their knowledge of evolution, 68.6% (n = 24) contended their knowledge of evolution was either excellent or good whereas 31.4% (n = 11) maintained an average or fair knowledge of evolution. None of the teacher participants considered their know-ledge of evolution to be poor.
Table 2 presents the student participant profile. Fe-male students comprised 53.5% (n = 287) of the par-ticipants and male students the remaining 46.5% (n= 249). The majority of student participants were sophomores (73.5%, n = 394) with freshmen accounting for 24.4% (n = 131). White non-Hispanic student participants were the majority ethnic group (72.8%, n= 390) whereas students of Asian or Pacific Islander descent were in the
minority, representing only 1.7% (n = 9) of student participants.
Public high school variables
Analyses were conducted to identify any significant differ-ences (p < .05) among variables related to the 32 public high schools representing the study’s teacher and student participants when compared to the 474 public high schools located within the study region. A comparison between the two sets of schools focused on two variables: distribution of student ADM and urban-centric classification. A chi-square goodness-of-fit statistical analysis revealed no sig-nificant difference between the two high school groups for ADM distribution (χ2(4,Ν= 32) = 8.32,p> .05) but did reveal a significant difference in urban-centric classification (χ2(3,Ν= 32) = 14.14,p< .05; Table 4). These results indi-cate that the public high schools from which teacher and student participants originated were representative of the collective public high schools within the study area in ADM distribution but not in urban-centric classification. A 16.75 confidence interval at a 95% confidence level was de-termined for the sample of high schools containing study participants (n= 32) compared to the total number of pub-lic high schools (N= 474) located within the study area.
Comparison of students’pre- and post-instruction BEL survey results
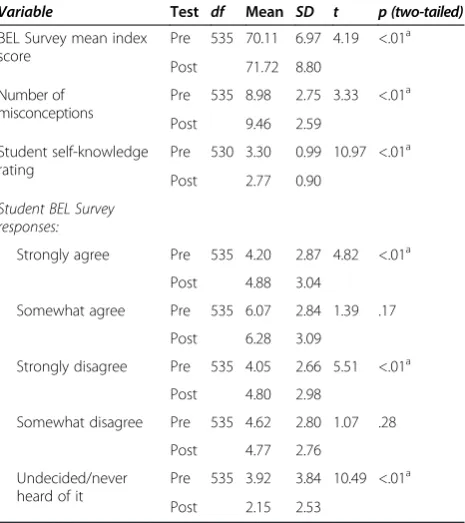
Dependent-samples t-tests were conducted to compare students’ mean data with specific variables. The results
Table 4 Public high school profile Demographic
variable
Variable range Percentage of high schoolsa
Participant Study area
(n= 32) (N= 474)
Average daily membershipb
4451.85 to 485.57 25.0 20.0
482.10 to 242.95 25.0 20.0
242.30 to 134.10 21.9 20.0
132.10 to 78.11 9.4 20.0
77.73 to 14.85 18.8 20.0
Urban-centric classificationc,d
City 3.1 7.2
Suburban 6.3 5.7
Town 31.2 17.7
Rural 59.4 69.4
a
Participant high schools contain study participants whereas study area high schools are the total number of high schools within the study area. Percentages may not equal 100% due to rounding. b
Average daily membership is the aggregate membership of a school during a reporting period (normally a school year) divided by the number of days school is in session during this period (Institute of Education Sciences National Center for Educational Statistics 2010a).c
Urban-centric classification (Institute of Education Sciences National Center for Educational Statistics 2010b).
d
of these analyses are found in Table 5. Analysis revealed students’post-instruction BEL Survey mean index scores (M= 71.72,SD= 8.80) were significantly higher (p< .01) than were their pre-instruction BEL Survey mean index scores (M= 70.11,SD= 6.97). In addition, a significant dif-ference (p< 0.01) between the mean number of students’ pre-instruction BEL Survey ‘undecided/never heard of it’ responses and the mean number of post-instruction BEL Survey‘undecided/never heard of it’responses was coupled with significant differences (p< .01) in the mean number of pre- and post-instruction‘strongly agree’responses and
‘strongly disagree’ responses. There were no significant differences produced between the mean number of ‘ some-what agree’or ‘somewhat disagree’responses, pre- versus post-instruction.
The number of misconceptions held by students on the pre-instruction survey totaled 4,812, producing a mean misconception rate per student of 8.98 (SD= 2.75), whereas the number of misconceptions held by students following instruction increased to a total of 5,072 with an accompanying student mean increase of 0.48 to 9.46 (SD= 2.59). Analyses revealed the mean number of student pre-instruction misconceptions was signifi-cantly lower (p< .01) than the mean number of student post-instruction misconceptions. Of the 536 student
participants, 216 decreased in the number of miscon-ceptions from pre- to post-instruction, 259 increased in the number of misconceptions, and for the remaining 61 students the number of misconceptions remained unchanged.
Student variables
An independent-samples t-test was conducted to evalu-ate the null hypothesis stating there was no significant difference between the mean difference in the number of pre- and post-instruction misconceptions for male versus female students (Table 6). Although the t-test result was not significant, female students in the study did possess a higher mean difference between pre- and post-instruction number of misconceptions (M= +0.60, SD= 3.39) as compared to male (M= +0.35,SD= 3.36).
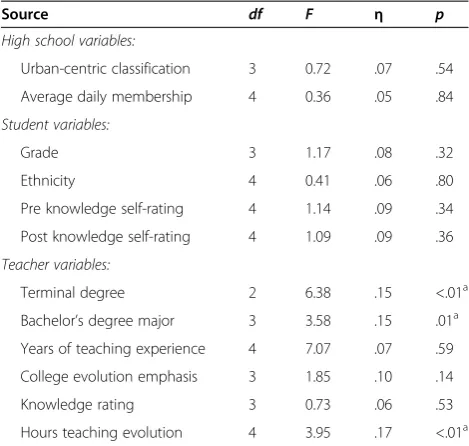
One-way ANOVA were performed to evaluate the re-lationship between the mean difference in number of students’ pre- and post-instruction misconceptions and various student variables. The ANOVA results can be found in Table 7. ANOVA conducted to evaluate the re-lationship between the mean difference in number of pre- and post-instruction misconceptions when com-pared to student ethnicities, grade level, and pre- and post-instruction ratings of biological evolution know-ledge proved to be non-significant. In addition, two vari-ables associated with students’ public high schools were evaluated with ANOVA to determine the variables’ rela-tionships to the mean difference in number of students’ pre- and post-instruction misconceptions. For both the independent variables of ADM and urban-centric location, the ANOVA results were non-significant (Table 7).
A dependent-samples t-test was subsequently con-ducted to evaluate whether there existed a significant difference between students’ mean pre-instruction self-rating of biological evolution knowledge and their mean post-instruction self-rating (Table 5). For analysis, the self-rating classes were numerically scaled as follows: poor, 5; fair, 4; average, 3; good, 2; and excellent, 1. Table 5 Summary of analyses of dependent-samplest-test
results for students’mean data related to specific variables
Variable Test df Mean SD t p (two-tailed)
BEL Survey mean index score
Pre 535 70.11 6.97 4.19 <.01a
Post 71.72 8.80
Number of misconceptions
Pre 535 8.98 2.75 3.33 <.01a
Post 9.46 2.59
Student self-knowledge rating
Pre 530 3.30 0.99 10.97 <.01a
Post 2.77 0.90
Student BEL Survey responses:
Strongly agree Pre 535 4.20 2.87 4.82 <.01a
Post 4.88 3.04
Somewhat agree Pre 535 6.07 2.84 1.39 .17
Post 6.28 3.09
Strongly disagree Pre 535 4.05 2.66 5.51 <.01a
Post 4.80 2.98
Somewhat disagree Pre 535 4.62 2.80 1.07 .28
Post 4.77 2.76
Undecided/never heard of it
Pre 535 3.92 3.84 10.49 <.01a
Post 2.15 2.53
a
Difference between pre- and post-test means was statistically significant at p≤.01.BEL, Biological Evolution Literacy; df, degrees of freedom; post, student post-instruction;pre,student pre-instruction; SD, standard deviation.
Table 6 Summary of independent-samplest-test analyses for students’mean difference in pre- to post-instruction mean number of misconceptions related to gender
Mean difference in student pre- to post-instruction misconception number (SD)
Variable Female Male t df p
Students +0.60 +0.35 0.84 533 .40
(3.39) (3.36)
Teachers +0.22 +0.73 −1.75 534 .08
(3.33) (3.41)
Results indicate that students’ mean post-instruction self-rating score of biological evolution knowledge (M= 2.77,SD= 0.90) was significantly lower (p< .01) than their mean pre-instruction self-rating score (M = 3.30, SD = 0.99), indicating that students presumed them-selves to be more knowledgeable concerning biological evolutionary concepts following instruction as opposed to prior to instruction.
Teacher variables
An independent-samples t-test was conducted to evaluate changes in the mean difference in the number of students’ pre- and post-instruction misconceptions based on the gender of the students’teachers (Table 6). Although students of male teachers (n= 278) did have a 232.8% increase in the mean number of pre- and post-instruction misconceptions (M = 0.73, SD = 3.41) over that of students of female teachers (n = 258, M = 0.22, SD = 3.33), analysis indicated that teachers’gender did not produce a statistically significant difference in the mean difference in number of student’s pre- and post-instruction misconceptions (p= .08).
ANOVA was employed to evaluate the relationship be-tween the mean difference in the number of students’ pre- and post-instruction misconceptions and teacher variables. The results of these analyses are located in Table 7. Teachers’ terminal degree included three levels: bachelor’s, master’s, and doctorate. The ANOVA relating
the mean difference in the number of students’pre- and post-instruction misconceptions and teachers’ terminal degrees was significant (p < .01). Because the overall F test was significant, follow-up tests were conducted to evaluate pairwise differences among the means. Because there may have been a lack of power associated with the test due to the small sample size of students of teachers possessing doctorate degrees (n = 43), the re-sults of the Dunnett’s T3 test, a multiple comparison procedure that does not require the population vari-ance to be equal, was implemented. A significant differ-ence (p < .01) in the means between those students whose teachers possessed a bachelor’s degree (M = 0.27, SD= 3.36) and those students whose teachers possessed doctorate degrees (M= 2.21,SD= 3.39) was revealed, as was a significant difference (p= .01) between the means of students whose teachers possessed master’s degrees (M= 0.45,SD= 3.28) and those students whose teachers possessed doctorates. An ANOVA was also conducted to evaluate the relationship between the mean difference in the numbers of students’ pre- and post-instruction mis-conceptions and teachers’ bachelor’s degree major. The independent variable, the teachers’ bachelor’s degree major, included four classes: non-science degree, science education degree, non-biology science degree, and biology degree. Because the overallFtest was significant (p= .01), follow-up tests were conducted to evaluate pairwise differ-ences among the means. Because the variances among the four groups ranged from 9.21 to 13.79, it was not assumed that the variances were homogeneous and a
post hoc comparison was conducted with the use of
Dunnett’s T3 test. A significant difference (p< .05) was discovered in the mean difference in the numbers of students’ pre- and post-instruction misconceptions be-tween students’ whose teachers held non-science bach-elor degrees (M = 1.50, SD = 3.71) and those students whose teachers held science education bachelor degrees (M = .08, SD = 3.04). A significant difference (p< .05) was also revealed in the means between students whose teachers held non-science bachelor degrees and those students whose teachers held non-biology science de-grees (M= .57,SD= 3.34).
ANOVA were conducted to evaluate the relationship between the mean difference in the number of students’ pre- and post-instruction misconceptions and their teachers’ years of teaching experience, ratings of em-phasis placed on biological evolution in their college course, and knowledge rating of evolution. None of the ANOVA results for these three variables proved to be significant (Table 7). Finally, ANOVA was conducted to evaluate the relationship between the mean difference in the number of students’ pre- and post-instruction mis-conceptions and the number of hours their teachers ded-icated to teaching evolution in the Biology I course. The Table 7 Summary of analyses of variance results for
students’mean difference in pre- to post-instruction number of misconceptions related to school, student, and teacher variables
Source df F η p
High school variables:
Urban-centric classification 3 0.72 .07 .54
Average daily membership 4 0.36 .05 .84
Student variables:
Grade 3 1.17 .08 .32
Ethnicity 4 0.41 .06 .80
Pre knowledge self-rating 4 1.14 .09 .34
Post knowledge self-rating 4 1.09 .09 .36
Teacher variables:
Terminal degree 2 6.38 .15 <.01a
Bachelor’s degree major 3 3.58 .15 .01a
Years of teaching experience 4 7.07 .07 .59
College evolution emphasis 3 1.85 .10 .14
Knowledge rating 3 0.73 .06 .53
Hours teaching evolution 4 3.95 .17 <.01a
Analysis was conducted between specified groups of each source.a
independent variable, hours spent teaching evolution, in-cluded five categories: 0, 1 to 5, 6 to 10, 11 to 15, and greater than 15 hours. The ANOVA proved to be signifi-cant,(p< .01; see Table 7). Because the overallFtest was significant, follow-up tests were conducted to evaluate pairwise differences among the means. Because the vari-ances among the five groups ranged from 8.87 to 14.03, it was not assumed that the variances were homogeneous and because there may have been a lack of power asso-ciated with the test due to the small sample size of stu-dents of teachers dedicating 0 hours (n= 17) and those dedicating 11 to 15 hours (n = 45), the Dunnett’s T3 test was utilized. A significant difference (p < .05) in the means between those students whose teachers dedi-cated 0 hours to the teaching of biological evolution (M= -1.0,SD= 2.98) and those students whose teachers dedicated 11 to 15 hours to the topic (M= 2.0,SD= 3.49) was revealed as was a significant difference between the means of students whose teachers dedicated 6 to 10 hours (M = .01, SD= 3.28) and those who dedicated 11 to 15 hours to the teaching of evolution.
BEL survey statement analysis
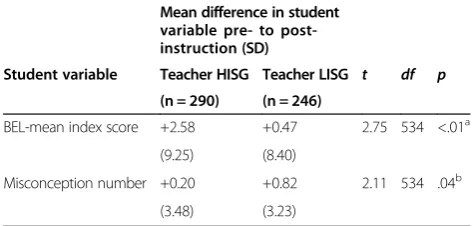
The 35 teachers’ BEL Survey index scores were ranked from highest to lowest and divided into two groups. The group containing the 18 highest ranking teacher BEL Survey index scores (M = 103.11,SD= 5.72) was desig-nated the HISG whereas the group containing the 17 lowest ranking BEL Survey index scores (M = 79.64, SD= 9.74) was designated the LISG. Independentt-test analysis revealed significant differences between both the mean change in students’pre- and post-instruction BEL Survey index scores (p< .01) and the mean change in the number of students’ pre- and post-instruction biological evolution misconceptions (p < .05) when student data from the HISG and LISG teacher groups were com-pared (Table 8). Those students of teachers in the HISG
(n = 290) had a mean increase of 2.58 index points (SD= 9.25) from pre- to post-instruction whereas those students of teachers in the LISG (n= 246) had a mean in-crease of only 0.47 index points (SD = 8.40). Similarly, students of HISG teachers had a mean increase of 0.20 misconceptions (SD= 3.48) from pre- to post-instruction whereas students of the LISG teachers had a mean in-crease of 0.82 misconceptions (SD= 3.23).
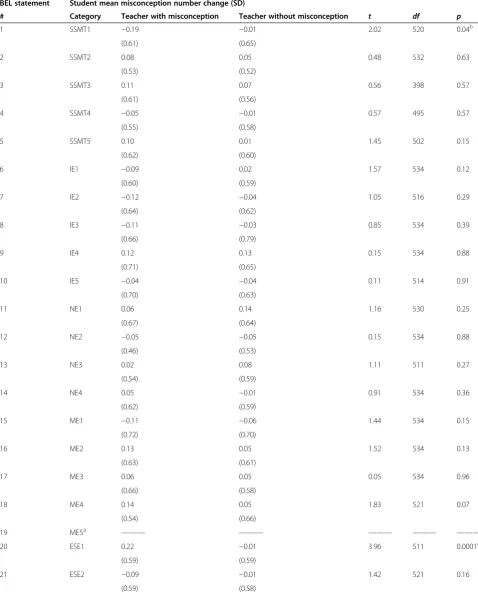
To determine the relationship between teachers’ bio-logical evolution misconceptions and their students’ ac-quisition of the same misconceptions, from pre- to post-instruction, each teacher’s responses to the BEL Survey’s 23 statements were analyzed to determine which specific misconceptions they did and did not possess. Students’ collective mean change in the number of each specific statement misconception, from pre-instruction to post-instruction, was calculated for students whose teachers held the specific statement misconception and for stu-dents whose teachers lacked the statement misconcep-tion, that is, possessed the accurate concept. Only students whose teachers possessed either the statement’s misconception or accurate concept were entered into analysis. Students of teachers who selected ‘undecided/ never heard of it’as a response or who did not have an opinion concerning the statement were not entered into the analysis. Results of the independent t-test analysis are revealed shown in Table 9.
For both statements 1 (‘A scientific theory that ex-plains a natural phenomenon can be defined as a “best guess’”or“hunch”’) and 20 (‘There exists a large amount of evidence supporting the theory of evolution’), signifi-cant differences (p < .05) were discovered between the mean change in the number of misconceptions held by students whose teachers possessed the statement mis-conception compared to students whose teachers pos-sessed the accurate statement concept. Students whose teachers possessed the misconception associated with statement 1 had a statistically significant (p< .05) -0.19 decrease in the mean number of misconceptions from pre- to post-instruction as compared to a -0.01 decrease in the mean number of misconceptions for students whose teachers possessed the accurate biological evolu-tion concept for the statement. However, students whose teachers possessed the statement 20 misconception had a 0.22 increase in the mean number of misconceptions from pre- to post-instruction as compared to a -0.01 mean decrease for students whose teachers possessed the accurate biological evolution concept, producing a significant difference between the two ofp< .01.
Analysis revealed there to be ten BEL Survey state-ments (2, 3, 5, 14, 16, 17, 18, 20, 22, and 23) in which the mean change in the number of misconceptions held by students whose teachers accepted the statement mis-conception was greater than that for students of teachers Table 8 Summary of independent-samplest-test analyses
for mean difference in pre- to post-instruction student variables related to teachers’BEL-mean index score ranking
Mean difference in student variable pre- to post-instruction (SD)
Student variable Teacher HISG Teacher LISG t df p
(n = 290) (n = 246)
BEL-mean index score +2.58 +0.47 2.75 534 <.01a
(9.25) (8.40)
Misconception number +0.20 +0.82 2.11 534 .04b
(3.48) (3.23) a
Difference between groups is statistically significant atp< .01.b
Table 9 Mean change in students’pre- to post-instruction misconception numbers related to teachers’with and without statement misconception
BEL statement Student mean misconception number change (SD)
# Category Teacher with misconception Teacher without misconception t df p
1 SSMT1 −0.19 −0.01 2.02 520 0.04b
(0.61) (0.65)
2 SSMT2 0.08 0.05 0.48 532 0.63
(0.53) (0.52)
3 SSMT3 0.11 0.07 0.56 398 0.57
(0.61) (0.56)
4 SSMT4 −0.05 −0.01 0.57 495 0.57
(0.55) (0.58)
5 SSMT5 0.10 0.01 1.45 502 0.15
(0.62) (0.60)
6 IE1 −0.09 0.02 1.57 534 0.12
(0.60) (0.59)
7 IE2 −0.12 −0.04 1.05 516 0.29
(0.64) (0.62)
8 IE3 −0.11 −0.03 0.85 534 0.39
(0.66) (0.79)
9 IE4 0.12 0.13 0.15 534 0.88
(0.71) (0.65)
10 IE5 −0.04 −0.04 0.11 514 0.91
(0.70) (0.63)
11 NE1 0.06 0.14 1.16 530 0.25
(0.67) (0.64)
12 NE2 −0.05 −0.05 0.15 534 0.88
(0.46) (0.53)
13 NE3 0.02 0.08 1.11 511 0.27
(0.54) (0.59)
14 NE4 0.05 −0.01 0.91 534 0.36
(0.62) (0.59)
15 ME1 −0.11 −0.06 1.44 534 0.15
(0.72) (0.70)
16 ME2 0.13 0.05 1.52 534 0.13
(0.63) (0.61)
17 ME3 0.06 0.05 0.05 534 0.96
(0.66) (0.58)
18 ME4 0.14 0.05 1.83 521 0.07
(0.54) (0.66)
19 ME5a ——— ——— ——— ——— ———
20 ESE1 0.22 −0.01 3.96 511 0.0001c
(0.59) (0.59)
21 ESE2 −0.09 −0.01 1.42 521 0.16
who rejected the statement misconception, producing a mean p = .36 (Table 9). There were likewise ten state-ments (1, 4, 6, 7, 8, 9, 11, 13, 15, and 21) in which the mean change in the number of misconceptions held by students whose teachers possessed the statement misconception was less than that for students whose teachers lacked the statement misconception, producing a meanp= .31 (Table 9). No mean changes in the num-ber of misconceptions between the two groups of stu-dents were produced by statements 10 and 12. One statement, number 19, was not analyzed because the statement misconception was not possessed by any of the teachers.
To assess the degree to which the numbers of teachers’ misconceptions were linearly related to stu-dents’ post-instruction BEL Survey index scores, the Pearson product-moment correlation coefficient (r) was employed. Analysis revealed the correlation between teachers’ number of misconceptions and students’ post-instruction BEL Survey index scores was significant (r(534) = -.17, p< .01). In general, the results suggest a small inverse correlation between the two variables, indi-cating that as the number of teachers’misconceptions in-crease, students’post-instruction BEL Survey mean index scores decrease and, as the number of teachers’ miscon-ceptions decrease, students’post-instruction BEL Survey mean index scores increase. However, r2 indicates that only 2.9% of students’BEL Survey index scores were pre-dicted by the number of teachers’misconceptions.
Discussion
Comparison of students’pre- and post-instruction BEL survey results
Students had a statistically significant increase (p< .05) in BEL Survey index scores from the pre-instruction sur-vey (M= 70.11, SD= 6.97) to the post-instruction survey (M= 71.72, SD= 8.80). This would seem to indicate that students possessed fewer biological evolution mis-conceptions following instruction as opposed to prior to instruction - a result to be expected if students’ mis-conceptions were supplanted by accurate concepts during the teaching process. On closer examination, however, this was not the case. The total number of students’
misconceptions increased by 260 following instruction, from 4,812 pre-instruction misconceptions to 5,072 post-instruction misconceptions. The discrepancy between the positive change in student BEL Survey mean index scores and the increase in mean number of misconceptions from pre- to post-instruction can primarily be accounted for by a statistically significant (p< .01) reduction in the mean number of ‘undecided/never heard of it’ re-sponses from pre- to post-instruction (3.92 to 2.15), coupled with statistically significant (p< .01) increases in the mean number of pre- and post-instruction ‘strongly agree’responses (4.20 to 4.88) and‘strongly disagree’ re-sponses (4.05 to 4.80; see Table 5). Although a slight ma-jority of those students who selected the pre-instruction
‘undecided/never heard of it’ response subsequently se-lected the accurate post-instruction statement concepts, thus elevating the BEL Survey mean index score, a slightly smaller number selected the statements’ miscon-ceptions, which resulted in an increase in the total num-ber of misconceptions from pre- to post-instruction.
Although students were obviously more confident in their responses following instruction, this new-found confidence was inversely correlated to their competency in the subject matter. This finding replicates similar results identified by multiple researchers (for example, Bishop and Anderson 1990; Cunningham and Wescott 2009; Wilson 2001). This increase in confidence was predominately a female phenomenon, as the average de-crease in ‘undecided/never heard of it’ responses from pre- to post-instruction BEL Survey was 0.74 per female student (n= 287) but only 0.38 per male student (n= 249). This outcome may be because female students were more indecisive in their initial pre-instruction survey statement responses, producing a mean 4.25 (n = 287, SD = 4.01)
‘undecided/never heard of it’ response rate for the 23 BEL Survey statements as opposed to male students’ mean 3.54 (n= 249,SD= 3.61) response rate, a significant difference of t(534) = 2.14, p< .05. Such a phenomenon was likewise documented in both Almquist and Cronin’s (1988) and Cunningham and Wescott’s (2009) studies.
Additional evidence indicating an increase in student confidence was found in the comparison of students’ biological evolution knowledge self-rating scoring means
Table 9 Mean change in students’pre- to post-instruction misconception numbers related to teachers’with and without statement misconception(Continued)
22 ESE3 0.02 −0.01 0.62 486 0.54
(0.59) (0.58)
23 ESE4 0.05 −0.02 1.12 534 0.26
(0.59) (0.59)
a
pre- and post-instruction. Students rated themselves to be more knowledgeable about biological evolution post-instruction as opposed to pre-instruction. Again, however, the confidence gained did not correlate to in-creased competency in subject matter.
Researchers have observed that students are able to recognize the scientifically acceptable answer when a statement is phrased correctly, such as BEL Survey statement 2, for example,‘The scientific methods used to determine the age of fossils and the earth are reli-able’. However, when a statement is put forth that in-cludes a common misconception, such as BEL Survey statement 1,‘A scientific theory that explains a natural phenomenon can be classified as a“best guess”or“hunch”’, students tend to agree with the misconception (Almquist and Cronin 1988; Cunningham and Wescott 2009). The present study did find a similar trend in students’ responses with correctly phrased statements (n = 10) accounting for a mean post-instruction student mis-conception rate of 198.30 (SD= 52.10) out of a possible 536 student responses, whereas statements that included a common misconception (n = 13) produced a mean student misconception rate of 237.62 (SD = 84.93). To Cunningham and Wescott (2009), such a trend sug-gested that,‘while our students may have heard the scien-tifically accurate definition of terms such as theory, fitness, and natural selection, they do not truly understand them’ (p. 514). These researchers strongly concur.
Student variables
Previous studies have shown that student misconcep-tions about science can differ significantly based on mul-tiple variables including geographical region, religious background, generation, gender, and age (Almquist and Cronin 1988; Loshet al.2003; Morrison and Lederman 2003; Palmer 1999). This study found no significant dif-ference between the mean difdif-ference in the number of students’ pre- or post-instruction biological evolution misconceptions when related to students’gender, ethnicity, grade level, biological evolution knowledge self-rating, or to the students’ public high schools’ urban-centric loca-tions or ADM. With these variables minimized as contrib-uting factors to student acquisition of biological evolution misconceptions, the focus then turns to the role of the teacher.
Teacher variables
Even though the difference proved to be outside the realm of significant (p= .08), it is interesting to note that students of male teachers had a 232.8% increase in the mean difference in the number of misconceptions from pre- to post-instruction over that of students of female teachers. This result could simply have occurred because female teachers in this study (n = 17) appeared to be
more knowledgeable of biological evolution, with a mean BEL Survey index score of 94.40 (SD= 13.69) compared to 89.2 (SD= 14.6) in men (n= 18), and mean miscon-ception rate of 4.29 (SD = 3.87) compared with 5.83 (SD = 3.78) in men. This explanation appears to be valid based on the results obtained when teachers’ BEL Survey index scores were ranked regardless of gender, divided into either a HISG (n= 18,M= 103.11,SD= 5.72) or a LISG (n= 17,M= 79.64,SD= 9.74), and then com-pared to the mean difference in students’ pre- and post-instruction BEL Survey index scores and number of misconceptions. Students whose teachers’ BEL Survey index scores fell in the HISG generated a BEL Survey mean index score increase of 2.58 (n= 290, SD = 9.25) from pre- to post-instruction and a 0.20 mean increase in number of misconceptions (SD = 3.48) whereas those students whose teachers’BEL Survey index scores were in the LISG produced a BEL Survey mean index score in-crease of only 0.47 (n= 246, SD= 8.40) coupled with a 0.82 mean increase (SD = 3.23) misconceptions. Thus, while teachers’gender may play a role in students’ acqui-sition of biological evolution-related misconceptions, a more important factor appears to be the biological evolu-tion knowledge possessed by the teachers themselves. Certainly additional research is warranted in this area.
bachelor’s degrees had mean misconception increases from pre- to post-instruction of 0.08 (n= 125,SD= 3.04), 0.11 (n= 122,SD= 3.46), and 0.57 (n= 195,SD= 3.34) respect-ively, whereas students of teachers possessing non-science bachelor’s degrees had a mean pre- to post-instruction in-crease of 1.50 (n= 180,SD= 3.71) misconceptions. Signifi-cant differences (p < .05) revealed between the mean difference in numbers of pre- and post-instruction miscon-ceptions between students of teachers possessing either science education or non-biology science bachelor’s de-grees and students of teachers possessing non-science bachelor’s degrees indicate that students’numbers of bio-logical evolution-related misconceptions are more likely to increase from pre- to post-instruction if they are taught by teachers lacking science-related bachelor’s degrees. Ap-proximately 54.5% (n= 12) of those teachers with terminal bachelor’s degrees (n= 22) held either a science education or non-biology science degree compared to only 30.0% (n = 3) of those teachers possessing terminal master’s degrees (n = 10), and 0.0% of those teachers holding doctorate degrees (n = 3), while their students pro-duced mean pre- to post-instruction misconception num-ber increases of 0.27 (SD = 3.36), 0.45 (SD= 3.28), and 2.21 (SD= 3.39) respectively.
No significant differences were discovered in the mean difference between students’ numbers of pre- and post-instruction misconceptions when related to their teachers’ years of teaching experience, teachers’ rating of em-phasis placed on biological evolution in their college courses, or teachers’ self-rating of biological evolution knowledge. However, statistically significant differences (p < .01) in the mean difference between students’ numbers of pre- and post-instruction misconceptions were related to the number of hours teachers dedicated to teaching biological evolution concepts in the Biology I course, with 6 to 10 hours of teacher instruction iden-tified as the optimum duration. Although 6 to 10 hours of evolution instruction did not appear to reduce the number of misconceptions students brought into the classroom, this duration did seem to inhibit their devel-opment as compared to shorter or longer durations of instruction where the number of students’ misconcep-tions increased from their initial levels by levels higher than the 0.01 mean increase afforded by the 6 to 10 hours of instruction. Interestingly, one teacher in the study indicated dedicating no hours to the teaching of evolution in the Biology I course yet produced the most favorable student results. This teacher’s students (n = 17) had a mean decrease of 1.0 (SD = 2.98) misconceptions from pre- to post-instruction BEL Survey while presum-ably lacking any teacher instruction. Of course, the accur-acy and quality of the evolution instruction is no doubt more important than the quantity of time spent teaching evolutionary concepts in the classroom.
BEL survey statement analysis
Especially enlightening were those results obtained when the 35 teachers’ BEL Survey index scores were ranked from highest to lowest, subsequently divided into two groups - the HISG and the LISG - and the mean change in both groups’students’ BEL Survey index scores and number of misconceptions from pre- to post-instruction were analyzed. Results revealed that from pre- to post-instruction, those students of teachers classified in the HISG produced a significantly higher (p< .01) BEL Sur-vey mean index score coupled with a significantly lower (p< .05) mean number of misconceptions than did those students whose teachers were classified in the LISG (keeping in mind that the mean number of misconcep-tions increased for both groups of students from pre- to post-instruction). These results indicate that students of teachers who possess a relatively better knowledge of biological evolution have an increased opportunity to learn and retain biological evolution-related concepts. While the data do not indicate a concurrent reduction in evolution misconceptions, these students have an opportunity to minimize the number of new miscon-ceptions acquired during the course of instruction as opposed to those students taught by teachers with a relatively poorer knowledge of biological evolution con-cepts. Studies repeatedly show the positive impact effective teachers can have on student achievement. For example, both Sanders and Horn (1994) and Marzano (2003) re-vealed a 39.0 percentage point difference in student achievement gains between students with most effective andleast effectiveteachers (as cited in Miller 2003, p. 2).
evidence supporting the theory of evolution’), produced a 0.22 (SD = 0.59) increase in the mean number of misconceptions from pre- to post-instruction in those students whose teachers possessed the misconception as opposed to a 0.01 (SD = 0.59) decrease in stu-dents whose teachers lacked the misconception. At the p = .0001 level of significance, there exists a high probability that this particular misconception was passed from teacher to student. Were other misconceptions passed from teacher to student? Most likely, as several other BEL Survey statements teetered on the brink of stat-istical significance (Table 9) but only statement 20 crossed the line at thep< .05 level of significance.
Even though analysis identified only one BEL Survey statement misconception with a high probability of being transmitted from teachers to their students, the study did reveal an important relationship between teachers’ levels of misconceptions and student achieve-ment which may provide additional evidence of miscon-ception transmission from teachers to students. Results suggest an inversely correlated relationship between the number of teachers’ misconceptions and students’ post-instruction BEL Survey index scores, that is, as the num-ber of teachers’misconceptions increased, students’BEL Survey post-instruction index scores decreased and, as the number of teachers’ misconceptions decreased, students’ BEL Survey post-instruction index scores in-creased. Transmission of misconceptions from these teachers to their students cannot be ruled out as a causa-tive agent although several variables may come into play in the decrease of students’post-instruction BEL Survey index scores following instruction by teachers with high levels of misconceptions as evidenced by the fact that Pearson’s r2 indicated that only 2.9% of students’ post-instruction BEL Survey index scores were predicted by the number of teachers’misconceptions.
Limitations of study
Several possible limitations were evident in this study. For example, all teacher participants volunteered for the study and therefore are probably not a truly random sample of all Oklahoma public high school Biology I teachers. Similarly, during the duration of the study some students may have been exposed to biological evo-lution misconceptions in non-biology courses or in other contexts. In addition, for some variables tested, small teacher and/or student sample sizes may have produced results that were not representative of the population as a whole. In light of these limitations, a completely causative link between students’ acquisition of bio-logical evolution misconceptions and the variables de-fined within the study is not assigned. Nevertheless, evidence suggests that the data reported here are reli-able and representative, and the results are consistent
with those reported by previous researchers (for example, Almquist and Cronin 1988; Bishop and Anderson 1990; Cunningham and Wescott 2009; Wilson 2001).
Conclusions
This study revealed some problematic issues concerning the teaching of biological evolution in Oklahoma’s public high school introductory biology course, as evidenced by the fact that the average student in the study completed the Biology I course with increased confidence in their biological evolution knowledge yet with a greater num-ber of biological evolution misconceptions and, there-fore, less competency in the subject. Who is culpable? Certainly one’s first compulsion is to implicate the teacher. Such a verdict may be justified in many cases as research has revealed ‘ … instruction in evolutionary biology at the high school level has been absent, cursory, or fraught with misinformation’ (Rutledge and Mitchell 2002 p. 21) and ‘about one-fourth of Oklahoma public school life-science teachers place moderate or strong emphasis on creationism’(Weld and McNew 1999, p. 52). Disturbingly, this study revealed two cases in which stu-dents who entered their Biology I courses held a higher pre-instruction BEL Survey mean index score than the BEL Survey index scores produced by their respective teachers on the identical survey. This result indicates that these students, on average, had a more accurate under-standing of biological evolution prior to instruction than did the teachers whose task was to instruct them in the topic. Based on this result alone, there is little doubt that teachers may serve as sources of biological evolution-related misconceptions or, at the very least, propagators of existing misconceptions.