C O M M E N T A R Y
Open Access
Field
et al
. Redux.
Maximilian J Telford
Abstract
On 12 February 1988 (by coincidence Charles Darwin’s birthday), a paper published inScienceby Katherine Field, Rudy Raff, and colleagues presented the first credible molecular analysis of metazoan phylogeny based on sequences from the small subunit ribosomal RNA gene (SSU). Here I examine the main conclusions reached in this manuscript. I reconstitute their dataset and, by recompiling software available in 1988, I consider how they might have achieved a more accurate tree. I show how three common methods to avoid systematic error - more data, careful taxon sampling and superior models of evolution - overcome the errors that exist in the original paper. This approach illustrates the basis of some of the major advances of the past 25 years resulting in our current understanding of animal phylogeny.
Keywords:Phylogeny, Evolution, Metazoa, SSU, Ribosomal RNA, Maximum likelihood
Background
Twenty-five years ago, on the 179th anniversary of Charles Darwin’s birthday, a paper published inScience
began a revolution in the study of animal phylogeny [1]. The paper reported the first use of small subunit ribosomal RNA sequences (SSU) for reconstructing animal phylogeny and adopted the technique for fast, direct sequencing of ribosomal RNA using reverse transcriptase pioneered by Norman Pace and others [2]. The work, from a team led by Rudy Raff, is referred to familiarly in the community as‘Fieldet al.’after the first author, Katherine Field (from here I refer to the paper as‘FEA’). FEA set the scene for hundreds of sub-sequent SSU-based analyses of metazoan phylogeny; among these several equally influential papers that col-lectively have overturned traditional thinking about metazoan evolution resulting in what has been termed the‘new animal phylogeny’[3].
While hugely influential and widely cited, not all of the citing articles refer to FEA as a trustworthy guide to metazoan phylogeny. While globally accurate, there are some important errors and the critical response was almost immediate, with letters quickly appearing in the pages of Science [4-7]. The two most serious errors in their phylogeny are: (1) polyphyletic origins of Metazoa (independent origins of cnidarians and
bilaterians); and (2) non-monophyletic Lophotrochozoa (Platyhelminthes grouped basal to other bilaterians rather than alongside molluscs, annelids, and relatives). Here I describe the reconstitution of their sequence alignments and I use this dataset to recapitulate the original analyses. I then consider whether it was, in principle, possible to produce a more accurate phylogeny with the resources available at the time of the original work. Finally I ask what subsequent advances in theory and technology were needed to arrive at the metazoan phylogeny generally accepted today.
Main text
Reconstituting the original dataset
I downloaded the original FEA data files from GenBank. The majority of these are composed of three separate sequences from each taxon covering different subre-gions of the SSU molecule: these original data form dataset 1. To complement these partial sequences I added complete SSU sequences derived from all taxa represented by a partial sequence in the original data-set. Where a full sequence from the identical species was not available I used data from the closest relative I could find according to the GenBank taxonomy. I also added full length sequences from a slowly evolving platyhelminth to replace the rapidly evolving Dugesia: these form dataset 2. All sequences were aligned using Clustalx. I made character sets for inclusion of nucleo-tide positions in analyses corresponding to the
Correspondence:[email protected]
Department of Genetics, Evolution and Environment University College London, Darwin Building Gower Street, London WC1E 6BT, UK
© 2013 Telford; licensee BioMed Central Ltd. This is an Open Access article distributed under the terms of the Creative Commons Attribution License (http://creativecommons.org/licenses/by/2.0), which permits unrestricted use, distribution, and reproduction in any medium, provided the original work is properly cited.
TelfordEvoDevo2013,4:5
positions used to reconstruct the trees shown in FEA-figs 2 to 5. I also made my own character set covering the whole SSU gene using the complete sequences. An add-itional file containing all aligned sequences, character sets used and a PAUP block to run all analyses described is available for download (see Additional file 1).
Phylogenetic analyses
All phylogenetic analyses were done using PAUP 4.0b10 [8] and Phylip 3.0 [9]. Trees are rooted onZea mays (maize) rather than Dictyostelium discoideumas in FEA, as the latter is now considered closer to the opisthokonts (Metazoa, fungi and others) than are plants or the ciliophoran Oxytricha [10]. I first re-ran the heuristic distance matrix-based analyses shown in FEA Figs 2 to 5 using the same taxa, the original sequences and the same portions of alignment (Figure 1) as well as an analysis using all the original taxa simultaneously using the character set from FEA Fig 2. Jukes Cantor distance estimates were derived from each set of partial sequences. Using PAUP, trees were compared using a heuristic search with a random addition of taxa (10 replicates) and tree bisection and reconnection (TBR) branch swapping. The optimality criterion was weighted least squares with power = 2. Using all sequences at once, a single best tree (Figure 2A) was found.
The analysis shown in Figure 2B used a Maximum Likelihood method performed using software available at the time of FEA. I downloaded and compiled DNAML from Phylip version 3.0: April 1987 [9]. The maximum number of species that could be considered by the software was originally fixed at 20 and the maximum number of characters was just 300 reflecting limitations of CPUs and available computer memory in 1988; both values were increased before compiling to accommodate the datasets used here. Maximum Likeli-hood estimates of base frequencies and transition: transversion ratios were based on the tree shown in Figure 1A and were estimated using PAUP 4.0b10 (Assumed nucleotide frequencies A= 0.25079 C= 0.23583 G= 0.24494 T= 0.26843, transition/transversion ratio = 1.4497). Global rearrangements G option was selected and the analysis was run 10 times using different random numbers with the Jumble J option and the tree with the highest ln-likelihood retained.
The analysis shown in Figure 2C used a Maximum Likelihood method from PAUP 4.0b10. Full-length sequences were used and the fast evolving flatworm
Dugesia was replaced with the more slowly evolving
Macrosotomum(dataset 2). An initial neighbour joining (NJ) tree was used to get a Maximum Likelihood esti-mate of nucleotide frequencies, the gamma parameter, the proportion of invariant sites and the GTR substitu-tion matrix. These parameter estimates were fixed and
the tree estimated using a heuristic search with a ran-dom addition of taxa (10 replicates) and TBR branch swapping. After this procedure, the parameters (GTR substitution matrix, base frequencies, gamma para-meter and proportion of invariant sites) were re-estimated on the resulting tree and this procedure repeated until there was no further change in topology or estimates of parameters.
Results and discussion
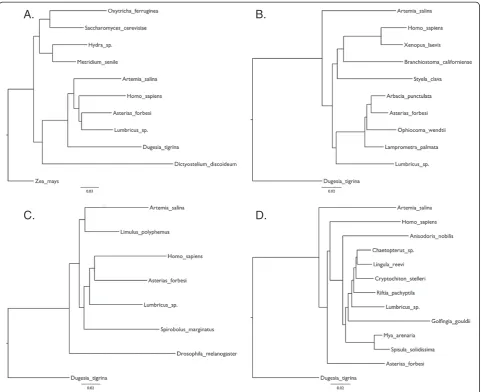
Rerunning the original analyses from FEA Figs 2–5 using a heuristic distance method gave similar but not identical results (Figure 1). In my recapitulation of FEA Fig 3 the arthropod Artemia is basal and the annelid
Lumbricus sistergroup to the Echinoderms rather than the other way around as seen in the original. In my recapitulation of FEA Fig 4 the position of the root is different resulting in non-monophyletic arthropods. The differences may be due to improved methods for searching tree space possible today in PAUP* and the positions of the taxa that differ between FEA and my re-analyses seem to be particularly unstable. Figure 2A shows the tree reconstructed using all the partial sequences and tree reconstruction methods of the original paper. While FEA did not use all sequences in a single analysis, probably due to computational burden or memory requirements, this tree nevertheless recapi-tulates most of their findings well. Currently accepted major monophyletic groups are highlighted by shading: Chordata, dark blue; Echinodermata, light blue; Lophotro-chozoa, red; Arthropoda, green; Cnidaria, yellow. The polyphyletic origins of the Metazoa are recovered as is the basal position of the platyhelminthDugesia tigrina, distant from the other Lophotrochozoa. The long branched urochordateStyelais not close to the other chordates.
Alongside the major errors I have described, there are a number of additional errors within the major clades such as the basal position of the long-branched sea cucumbers (Sclerodactyla briareus and Leptosynapta inhaerens) within the echinoderms and paraphyly of molluscs (the bivalvesMya and Spisulaare not sister to the chitonCryptochiton).
One question of great historical interest asks how much improvement in the accuracy of the tree was theoretically possible at the time of publication, if optimal tree recon-struction methods had been used. Using the simple Max-imum Likelihood (ML) models represented in software available at the time I have reconstructed the tree shown in Figure 2B. This likelihood approach produces a signifi-cant improvement in the tree topology, the Metazoa are now monophyletic; the sea cucumbers are no longer at the base of the echinoderms but in their correct position as sistergroup of the echinoids and the urochordateStyela
of a problem. The major remaining error concerns the position of the platyhelminth, Dugesia basal to all other Bilateria.
Clearly there was the possibility in 1988 to approach closer to the tree widely accepted today; practically, how-ever, maximum likelihood methods are hugely slower than the distance methods used in the original paper and com-puter CPUs are more than 10,000 times faster than in 1988 and the random access memory (RAM) available is orders of magnitude greater. Performing the 10 iterations used to produce the tree shown in Figure 2B took approxi-mately 2 hours on my desktop computer yet would have taken at least 2 years in 1988. Even with 10 iterations I have not recovered the tree with the highest likelihood; running the same model using PAUP* produced a tree with a
lnLikelihood of -10,287 (compared to -10,294 using PHYLIP 3.0).
The increase in accuracy of molecular phylogenetic trees of the past 25 years depends on three main developments in phylogenetics: systematic errors are reduced by longer sequences (now typically hundreds or even thousands of genes) and systematic errors are addressed by careful and more extensive species sampling and improved likelihood methods [11]. I have implemented all three approaches in a stepwise fashion. Using full-length SSU sequences results in subtle changes in the tree, some beneficial (brittlestar,
Ophiocoma, in a more credible position) yet some detrimental (paraphyletic deuterostomes) suggesting that, while stochastic error might have reduced, systematic errors are still present. Replacing the rapidly evolving platyhelminth Dugesia by
A.
B.
C.
D.
Figure 1Recapitulation of the analyses in Fieldet al. figures 2 to 5 using original data and methods of analysis.(A) Recapitulation of FEA Figure 2‘Evolutionary tree for animals’. (B) Recapitulation of FEA Figure 3‘Chordate and echinoderm portions’. (C) Recapitulation of FEA Figure 4‘Arthropod portion’. (D) Recapitulation of FEA Figure 5‘Eucoelomate protostome portion’. Slight differences to the original results are discussed in the text.
TelfordEvoDevo2013,4:5 Page 3 of 6
B
Figure 2Metazoan phylogenies using small subunit ribosomal RNA data.(A) A recapitulation of the original Fieldet al. analysis using all original sequences in dataset 1. Three main errors are seen: (1) the cnidariansHydraandMetridium(yellow) are separated from other Metazoans; (2) the flatwormDugesiais separated from other Lophotrochozoans (red); and (3) the urochordateStyela is separate from other chordates (light blue). (B) Tree using the original data (dataset 1) re-analysed with a 1988 Maximum Likelihood method. Metazoa and chordates are now monophyletic. (C) Analysis of full length SSU sequences with long branchedDugesiareplaced by shorter branchedMacrostomum(dataset 2) and analysed with modern ML methods (GTR+I+G model). The flatworm is found with the other Lophotrochozoa. Arthropods are in green, echinoderms are in dark blue.
2013,
4
:5
Page
4
of
6
ournal.com/co
the shorter branched Macrosotomum clearly improves the tree, however, and results in the flatworm correctly joining the other lophotrochozoans. This approach is perhaps best exemplified by the work of Aguinaldo
et al. [12] who found support for the Ecdysozoa (includ-ing nematodes and arthropods) only follow(includ-ing selection of slowly evolving nematodes. Finally, the simple ML model implemented in the 1987 Phylip software models just two types of substitution (transitions and transver-sions) and has no parameters allowing for variation in substitution rates across sites. The use of a complex ML model incorporating a General Time Reversible model of substitution (all six possible substitutions modeled independently), an estimate of the proportion of invari-ant sites and a gamma model to account for variable rates across sites (GTR+I+G) results in a tree that closely approximates the most recent estimates of meta-zoan evolution (Figure 2C) [13-15]. Not only are chor-dates and lophotrochozoans now monophyletic but, within clades, we also see the close relationship of sea cucumbers with echinoids and monophyletic molluscs.
Conclusions
It seems to have been through a mixture of pragmatism, good judgement and extraordinary good fortune that the 18S gene was chosen as the early workhorse for animal phylogenetics. While ribosomal RNA genes were used early on in phylogenetics due to the possibilities for extracting and purifying rRNA in large quantities, its amenability to direct sequencing and its universality, three additional features of 18S are the key to its subsequent successes. First, its length meant that stochastic or sam-pling errors were much reduced when compared to previ-ous work on the 5S gene and in general it contains enough information to support the accurate estimation of the multiple parameters of the new models I have described. Second, it is composed of regions of greater and lesser sequence conservation meaning it has provided evidence for relationships at many different levels of the animal phylogeny and indeed across the whole of life. Fi-nally, being a non-coding RNA means no problems from a degenerate code: the most tightly constrained regions of 18S hardly change meaning, come the PCR revolution, designing universal primers to amplify the gene from any animal was trivial. Compare this situation to the degener-ate primers required to amplify a protein coding gene with neutrally variable first and third codon positions.
While I have studied the reasons behind the shortcom-ings of FEA, this truly was a landmark paper; a number of their conclusions were both revolutionary and correct and they did not by any means over interpret their results at the time. Two of their conclusions are of particular signifi-cance as they overturned entrenched ideas of animal
evolution and their eventual acceptance forced a reassess-ment of the pattern and process of metazoan evolution.
(1) The brachiopods are more closely related to annelids and molluscs (Protostomia) than to the hemichordates (Deuterostomia) meaning the lophophore, that both these groups possess, is likely to be a convergent adaptation [16];
(2) The arthropods are the sister group of the other protostomes represented in the dataset (all Lophotrochozoa) and are not closely related to or derived from within the annelids (as per the Articulata hypothesis) raising questions about the evolution of body segmentation still hotly debated [12].
Both of these observations were counter to prevailing thought, each has since been demonstrated correct in high profile papers and each has revolutionised our understanding of how animals evolved [17]. The 25th anniversary of Fieldet al. deserves to be marked and its coincidence with Darwin’s birthday is both remarkable and fitting.
Additional file
Additional file 1:Name: Telford_FEA.nex, Format: Nexus.Description: Aligned 18S ribosomal RNA sequences from original Fieldet al.publication along with more recent, full-length, equivalent sequences. Character sets used in the analyses described are included along with a‘PAUP block’ which will automatically run all analyses described in this manuscript.
Abbreviations
FEA: Fieldet al.; GTR+I+G: General Time Reversible, Invariant sites, Gamma correction; LBA: Long branch attraction; ML: Maximum Likelihood; NJ: Neighbour joining; SSU: Small subunit ribosomal RNA; TBR: Tree bisection and reconnection.
Competing interests
The author declares that he has no competing interests.
Acknowledgments and funding information
MJT is supported by a Royal Society Wolfson Research Merit Award. The alignments used are available as a nexus file Telford_FEA.nex with all character and taxon sets and PAUP analysis instructions included.
Received: 27 November 2012 Accepted: 4 January 2013 Published: 12 February 2013
References
1. Field KG, Olsen GJ, Lane DJ, Giovannoni SJ, Ghiselin MT, Raff EC, Pace NR, Raff RA:Molecular phylogeny of the animal kingdom.Science1988, 239:748–753.
2. Lane DJ, Pace B, Olsen GJ, Stahl DA, Sogin ML, Pace NR:Rapid determination of 16S ribosomal RNA sequences for phylogenetic analyses.Proc Natl Acad Sci USA1985,82:6955–6959.
3. Adoutte A, Balavoine G, Lartillot N, Lespinet O, Prud’homme B, de Rosa R: The new animal phylogeny: reliability and implications.Proc Natl Acad Sci USA2000,97:4453–4456.
4. Nielsen C:Technical comment: Phylogeny and molecular data. Science1989,243:548.
5. Walker WF:Technical comment: Phylogeny and molecular data. Science1989,243:548–549.
TelfordEvoDevo2013,4:5 Page 5 of 6
6. Bode HR, Steele RE:Technical comment: Phylogeny and molecular data. Science1989,243:549–550.
7. Field KG, Olsen GJ, Giaovannoni SJ, Raff EC, Pace NR, Raff RA:Technical comment: Phylogeny and molecular data. Response.Science1989, 243:550–551.
8. Swofford DL:PAUP*. Phylogenetic Analysis Using Parsimony *and Other Methods. 4th edition. Sunderland, MA: Sinauer Associates; 2000. 9. Felsenstein J:PHYLIP- phylogeny inference package.Cladistics1989,
5:164–166.
10. Adl SM, Simpson AGB, Lane CE, LukešJ, Bass D, Bowser SS, Brown MW, Burki F, Dunthorn M, Hampl V, Heiss A, Hoppenrath M, Lara E, Le Gall L, Lynn DH, McManus H, Mitchell EA, Mozley-Stanridge SE, Parfrey LW, Pawlowski J, Rueckert S, Shadwick L, Schoch CL, Smirnov A, Spiegel FW:The revised classification of eukaryotes.J Eukaryot Microbiol2012,
59:429–514.
11. Philippe H, Telford MJ:Large-scale sequencing and the new animal phylogeny.Trends Ecol Evol2006,21:614–620.
12. Aguinaldo AM, Turbeville JM, Linford LS, Rivera MC, Garey JR, Raff RA, Lake JA:Evidence for a clade of nematodes, arthropods and other moulting animals.Nature1997,387:489–493.
13. Dunn CW, Hejnol A, Matus DQ, Pang K, Browne WE, Smith SA, Seaver E, Rouse GW, Obst M, Edgecombe GD, Sørensen MV, Haddock SH, Schmidt-Rhaesa A, Okusu A, Kristensen RM, Wheeler WC, Martindale MQ, Giribet G: Broad phylogenomic sampling improves resolution of the animal tree of life.Nature2008,452:745–749.
14. Telford MJ, Copley RR:Improving animal phylogenies with genomic data. Trends Genet2011,27:186–195.
15. Edgecombe GD, Giribet G, Dunn CW, Hejnol A, Kristensen RM, Neves RC, Rouse GW, Worsaae K, Sørensen MV:Higher-level metazoan relationships: recent progress and remaining questions.Org Divers Evol2011, 11:151–172.
16. Halanych KM, Bacheller JD, Aguinaldo AM, Liva SM, Hillis DM, Lake JA: Evidence from 18S ribosomal DNA that the lophophorates are protostome animals.Science1995,267:1641–1643.
17. Telford MJ, Budd GE:The place of phylogeny and cladistics in Evo-Devo research.Int J Dev Biol2003,47:479–490.
doi:10.1186/2041-9139-4-5
Cite this article as:Telford:Fieldet al. Redux..EvoDevo20134:5.
Submit your next manuscript to BioMed Central and take full advantage of:
• Convenient online submission
• Thorough peer review
• No space constraints or color figure charges
• Immediate publication on acceptance
• Inclusion in PubMed, CAS, Scopus and Google Scholar
• Research which is freely available for redistribution