S H O R T R E P O R T
Open Access
Paired-end mappability of transposable
elements in the human genome
Corinne E. Sexton
1,2and Mira V. Han
1,2*Abstract
Though transposable elements make up around half of the human genome, the repetitive nature of their sequences makes it difficult to accurately align conventional sequencing reads. However, in light of new advances in sequencing technology, such as increased read length and paired-end libraries, these repetitive regions are now becoming easier to align to. This study investigates the mappability of transposable elements with 50 bp, 76 bp and 100 bp paired-end read libraries. With respect to those read lengths and allowing for 3 mismatches during alignment, over 68, 85, and 88% of all transposable elements in the RepeatMasker database are uniquely mappable, suggesting that accurate locus-specific mapping of older transposable elements is well within reach.
Keywords:Transposon, Mappability, L1HS, RNA-Seq, GEM
Background
Sequences from transposable elements (TE) have been observed to account for an average of 7% of reads from human RNA-Seq datasets [1]. Because of the re-petitive nature of TE sequences, fragments originating from locus-specific TEs are challenging to accurately align to a reference genome. However, RNA-Seq pro-tocols now allow for paired-end reads up to 150 bp long which theoretically should substantially increase the ability to confidently map to repetitive regions [2]. Mappability of the genome has been analyzed be-fore, and several representations have been proposed, including pair-wise cross mappability, and minimum unique length [3–6], but no study has investigated the mappability of TE regions in light of differences in read lengths and paired-end sequencing. The pur-pose of our study is to assess which TEs can be con-fidently quantified at the locus-specific level, rather than at the aggregated family level. We provide base level mappability of TEs in detail and show that a significant fraction of TEs are uniquely mappable at the element level.
Mappability has been defined for the genome by Der-rien et al. as the inverse of the number of times a k-mer originating from the genome appears in the genome,
considering its reverse complement and allowing a lim-ited number of mismatches [5]. We follow this definition to attain mappability scores for all TE regions in the RepeatMasker database using both the GEM (GEnome Multitool) Mappability and Bowtie programs [5,7].
Several factors affect the ability to accurately map a sequencing read to its originating locus which are not accounted for in this analysis. These include sequen-cing errors in the reads, true variants between the genome which was sequenced and the reference gen-ome, and the accuracy of the alignment software used to map the reads. Both random sequencing errors and true genomic variants can potentially create se-quencing reads that are not present in the genome [8, 9]. Such reads are not generated in the simulation in this analysis, but by allowing for up to 3 mismatches for each read in our alignment, we are capturing pos-sible mappings to potential errors and variants up to 3 nucleotides for every sequence of read length in the genome. Also, since no alignment software maps se-quencing reads perfectly [1], we compare our esti-mates of mappability based on two independent alignment algorithms, GEM and Bowtie, and check whether the estimates are largely congruent between the two methods.
Additional factors which affect the ability to discern the originating position of reads when looking at TE loci spe-cifically include the copy number of the TE subfamily
© The Author(s). 2019Open AccessThis article is distributed under the terms of the Creative Commons Attribution 4.0 International License (http://creativecommons.org/licenses/by/4.0/), which permits unrestricted use, distribution, and reproduction in any medium, provided you give appropriate credit to the original author(s) and the source, provide a link to the Creative Commons license, and indicate if changes were made. The Creative Commons Public Domain Dedication waiver (http://creativecommons.org/publicdomain/zero/1.0/) applies to the data made available in this article, unless otherwise stated.
* Correspondence:[email protected]
1School of Life Sciences, University of Nevada, Las Vegas, NV 89154, USA 2
Nevada Institute of Personalized Medicine, Las Vegas, NV 89154, USA
Sexton and HanMobile DNA (2019) 10:29
[10], the Hamming distance between related loci relative to the allowed mismatch rate and, importantly, the accur-acy of TE annotations. In this analysis we use the Repeat-masker TE annotation database for all TE classifications, but the current lack of benchmarking methods for TE an-notation likely results in missing anan-notations or incorrect annotations even in this database [11]. Our analysis takes this fact into consideration as we have calculated mapp-ability scores for the entire genome and therefore TE locus level scores would be simple to recalculate based on any future updates to TE annotations.
In our analysis, we provide a specific mappability score which represents the ability of Bowtie software to map a read pair uniquely to a locus when allowing for up to 3 mismatches. Although this is a very spe-cific definition of mappability and we cannot account for all of the above listed confounding factors, these scores provide an estimate of the sequence unique-ness under particular parameters and assumptions [12]. While mappability scores are not directly related to how well a read maps to a region, they do provide a conservative estimate of the uniqueness of a se-quence which can inform on the resulting confidence of a read mapping.
We have provided six new hg38 mappability tracks for the UCSC browser as well as provided aggregate mappability scores for each TE locus found in the RepeatMasker database. We show that more than 85% of TE loci are considered to be unique in terms of 76 bp paired-end mappability allowing for 3 mis-matches using the Bowtie aligner. Because these TE loci have unique mappability scores, we present these TE loci as a high confidence set that researchers can utilize as a reference for studying TE expression based on RNA-seq.
Methods
We used two approaches to estimate the mappability of repeat elements. First to obtain baseline single-end read mappability scores, we used GEM Mappability, an efficient software used to rapidly determine mapp-ability with multiple mismatches. And second, we generated all possible k-mers from the reference gen-ome sequence, and mapped them back to the refer-ence genome using Bowtie reporting all mappings. We considered this approach would be complemen-tary to GEM Mappability because the scores from Bowtie 1) represent how an aligner would actually map the reads and 2) can accurately assess paired-end read mappability by allowing for a range of insert sizes.
Additionally, Karimzadeh et al. have more recently de-scribed Umap [4] as a method for scoring genome
mappability. Though Umap does map kmers to the gen-ome using Bowtie, similar to our method, we omit a comparison to this software because the definition of mappability used in Umap is vastly different from both GEM Mappability and our method. Umap defines mapp-ability as “the fraction of a region that overlaps at least one uniquely mappable k-mer”whereas we define mapp-ability as the inverse of the number of times a k-mer ori-ginating from the genome appears in the genome. In other words, our method depends on the start position of a kmer to determine mappability scores, whereas Umap takes into account the length of the kmer in its scoring. Additionally, the default Umap mappability tracks were created using Bowtie not allowing any mis-matches whereas our Bowtie mappability scores allowed for 3 mismatches. This results in dramatically different scores as well and for these reasons we believe a direct comparison between GEM Mappability, Umap and our method could be misleading.
GEM Mappability estimates
To get single-end mappability scores for comparison, GEM Mappability (build 1.315) [5] was run on hg38 with a read length of 50, 76, and 100 base pairs and an allowance of 3 mismatches.
Read generation for bowtie mapping
To represent all possible single-end read sequences that could be transcribed from the reference genome, we generated 76-mers from hg38 using jellyfish [13]. We assume that no splicing events occur in the transcrip-tion of the transposon sequence. Although, this as-sumption can be wrong for certain transposons, it is generally applicable to the majority of transposons. To simulate paired-end reads, we generated all possible 200-mers, 242-mers, and 300-mers from hg38 using jellyfish. For each of these sizes we removed a region between the two paired-end“reads,”(100 bp, 90 bp, and 100 bp respectively) and reverse complemented the sec-ond “read” in each pair to simulate a forward-reverse paired-end library. This process created the 50 bp, 76 bp, and 100 bp paired-end read libraries, respectively. In order to create a library similar to the RNA-seq data from the Genotype-Tissue Expression (GTEx) project [5] insert length of 242 bp was chosen for the 76 bp paired-end library based on the median insert length across GTEx bamfiles.
Bowtie Mappability estimates
3 mismatches. We also investigated the effect of align-ment by using STAR instead of Bowtie using options --outFilterMultimapNmax 1000 --winAnchorMulti-mapNmax 100. For all 4.67 million TEs, only 13,496 (0.29%) have lower mappability scores in the STAR mappability estimates when compared to our original Bowtie results and 93.5% of scores for STAR and Bow-tie are within 0.05 of each other. We have thus con-cluded that Bowtie and STAR results are extremely similar, with Bowtie in the vast majority of cases being more conservative (Additional file 1: Figure S1), there-fore we decided to use Bowtie for the downstream analyses.
Throughout this article, when we refer to mappabil-ity of a single base position in the genome, it is based on the read alignments that start at that base pos-ition. We inferred the mappability of a position in the genome using the Bowtie alignments as follows. As an example, for a single base position, if a kmer mapped to that position and jellyfish reported that
kmer to appear 5 times in the genome, the mappabil-ity of that position would be 1/5. Using the reported counts from jellyfish we can significantly simplify the process of mapping by including each unique kmer sequence only once in our read set while still retain-ing all pertinent information for the mappability cal-culation. Similarly, if multiple kmers map to a base position, as is often the case when considering mis-matches, we calculate mappability by summing all re-ported jellyfish counts for each mapped kmer. For example, if 2 kmers map to a single position and jellyfish reports that one of the kmers appears 3 times in the genome and the other kmer appears only 1 time in the genome, the mappability for that base position would be 1/4.
An alternative, but equivalent, way of calculating mappability from a bamfile is to identify a kmer which maps exactly to a base position and take the inverse of how many times that kmer appears at other positions in the bamfile. For example, if a kmer
Fig. 1Comparison of single-end and paired-end TE mappability. Each point represents 1 TE sequence. Paired-end mappability scores were generated from 76 base pair read alignments with <= 3 mismatches. Single-end mappability scores were generated from GEM Mappability (k = 76) with the default of a 4% mismatch rate. Mappability scores were aggregated for each TE as the percent of base pairs in the sequence with a unique mappability score
Fig. 2Paired-end and single-end alignment. Paired-end mappability for certain base pair positions may be lower than for the single-end mappability due to the read pair aligning multiple times in the same start position with a different insert size. In that case, the paired-end mappability score for that specific base position could be lower than the single-end mappability as in this example
maps perfectly to a base position and appears at exactly 4 other positions in the genome, then the mappability for that position would be 1/5. With this method, if 2 kmers mapped to the same base pos-ition, we would only consider mappability as the number of times the perfectly matching kmer appears in the bamfile.
These methods are theoretically equivalent, provided jellyfish reports correct counts, and Bowtie reports the complete set of mappable positions. In reality, with single-end reads, we found that they are exactly equivalent (Additional file 2: Figure S2a). For paired-end reads, the two methods have a correlation coeffi-cient of 0.98 with over 90% of mappability scores the exact same between the two methods (Additional file 2: Figure S2b). But the fact that the correlation is not 1 shows that there are some minor amount of errors in the approach that results in both missed mappings
(points in the upper diagonal), or spurious mappings (points in the lower diagonal) in the Bowtie align-ment, or vice versa for Jellyfish. The fact that we see more data points in the upper diagonal shows us that the method relying on Jellyfish counts (method 1) is more sensitive in retrieving all possible mappings compared to the method relying on Bowtie only (method 2). We use method 1 in our mappability cal-culations throughout this study.
Transposon locus Mappability
Extending this definition, we describe transposon locus mappability. If all positions in a transposon locus are uniquely mappable then the locus is consid-ered uniquely mappable. Otherwise, if at least one position is not uniquely mappable, then the entire locus is classified as not uniquely mappable. We
introduce this stringency because we are interested in a conservative mappability estimate. This approach also avoids possible mappability score inflation caused by unique flanking regions around TEs because the entire sequence must be considered unique for a TE locus to be classified as uniquely mappable.
Results and discussion
Mappability estimates across software and paired-end results
In general GEM Mappability and Bowtie mapping scores have highly concordant results for single end mapping (Additional file 3: Figure S3), suggesting that Bowtie
Fig. 4Mappability scores with regards to age and copy number of TEs. Plots of average unique mappability score in each TE subfamily colored by class. The average unique mappability score for each subfamily is calculated by averaging each individual locus’s percent unique sequence. The percent unique sequence is defined as the percent of uniquely mappable base positions in each individual locus. These aggregated scores are plotted against (a) copy number and (b) age for each subfamily. The ages in (b) were predicted in Pace and Feschotte [14]
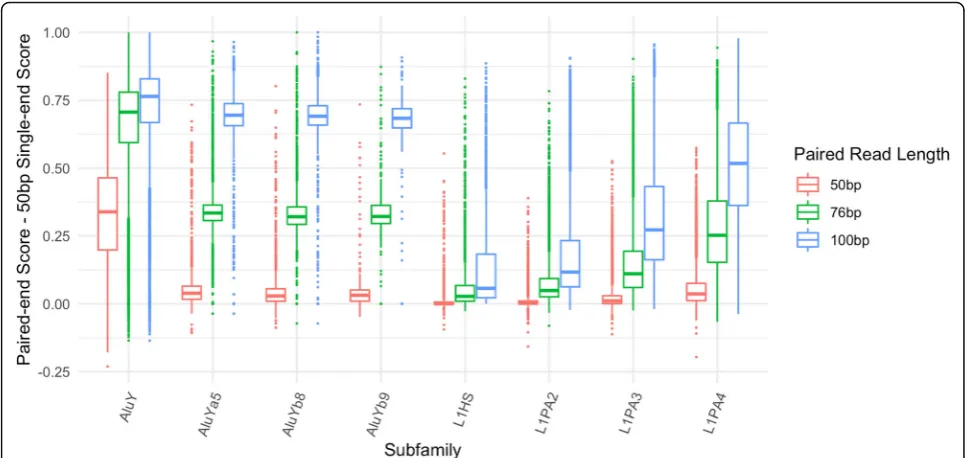
Fig. 5Increase in mappability between single-end and paired-end reads for low mappability families. For 8 of the lowest mappability scoring subfamilies in L1 and Alu, the boxplots show the difference between paired-end scores (at 50 bp, 76 bp and 100 bp read lengths) and the 50 bp single-end scores for every element in the subfamily
does indeed recover most if not all possible mapping lo-cations when using the -a parameter. Since GEM Mapp-ability software is also based on an independent alignment algorithm, the congruence between the two methods, especially for the exact matches, shows that the impact of alignment errors are limited. There are more discrepancies between the two methods as more mismatches are allowed, and it gives us some idea of the errors originating from mis-alignments. Even with 2 mismatches, the difference in mappability is less than 0.25 for 99.7% of TE loci, and the correlation between the two methods is 0.98. We report the GEM Mappabil-ity results to represent single-end mappabilMappabil-ity going forward.
Figure1shows the mappability scores for both single-end and paired-end mapping. Each point in Fig.1represents a TE with its mappability score generated from the 76 bp reads with single-end (GEM) on the x-axis and paired-end (Bowtie) on the y-axis. The clear trend is an increase in mappability score with paired-end alignment. However, some paradoxical points have higher single-end mappability
than paired-end mappability. These points make up less than 1% of total TE loci and can be accounted for by the presence of valid multiple mappings for the mate in the read pair (Fig. 2). Especially in repetitive TE sequences, paired-end reads can map to the same starting position with varying insert sizes. This lowers the overall mappabil-ity score for a base position, in some cases making it lower than single-end mappability. An example of this is the AluY element at chrY:9192414–9192738. This 325 bp-long elem-ent has 55 base positions where a varying insert size of the paired-end reads results in lower 50 bp paired-end mapp-ability scores compared to 50 bp single-end mappmapp-ability scores. It is relatively rare that varying insert sizes impact mappability scores in this way and therefore in analysis we treat differing insert size mappings conservatively as dis-tinct mappings as shown in Fig.2.
Mappability of elements
To assess general mappability for the TE sequences in the RepeatMasker database, we calculated both single and paired-end mappability scores as described in the
methods. Figure3shows the percent of loci in each sub-family that are uniquely mappable for all three read li-brary lengths in both single-end and paired-end configurations. We define a locus as uniquely mappable if all base positions at that locus had unique mappability scores.
Across all 4.67 million TEs defined in the Repeat-masker database, when allowing for 3 mismatches using the Bowtie aligner, 68.2% of all TEs are uniquely mappable with 50 bp paired-end reads, 85. 1% of all TEs are uniquely mappable with 76 bp paired-end reads, and 88.9% of TEs are uniquely mappable with 100 bp paired-end reads. At the class level using 76 bp paired-end reads, 82.8% of SINE ments, 86. 1% of LINE elements, 91.4% of DNA ele-ments, and 84.7% of LTR elements are uniquely mappable (For full mappability statistics see Add-itional file 5: Table S1).
Given the nature of our mappability score calcula-tion we would expect trends to arise with regards to copy number and age of TEs. More specifically, we expect as copy number for each subfamily increases, observed mappability scores should decrease due to multiple similar sequences being present in the gen-ome. We investigated this relationship for each locus using 76 bp paired-end mappability scores in Fig. 4a. In general, the trend, though weak, is as predicted; as subfamily copy number increased, the average unique
mappability scores for TE loci decreased. This trend may not be as strong as expected because the age of the TEs overshadows the effects of copy number; lar-ger copy numbers do not necessarily lead to lower mappability, because mappability is also influenced by the mutations that have independently accumulated in each copy.
To examine age and its effect on mappability scores, in Fig. 4b, we plot the average unique 76 bp paired-end mappability scores for 125 TE subfamilies with ages estimated in Pace and Feschotte [14]. These families include LINEs, Alus, and DNA transposons, but not LTR transposons. Here, the trend is much clearer; as age decreases, mappability score decreases as well. There do exist some ancient families with un-usually low mappability, but we predict the majority of that effect is due to recent segmental duplications (Additional file 6: Table S2).
Specifically, the families with the least mappable ele-ments include some of the youngest, namely L1HS, L1PA2, L1PA3, AluY, and AluYa5. It is well known that the L1 and Alu families both contain elements which are considered to be active transposons [15, 16]. Because identical copies have recently been inserted in the gen-ome, this decrease in mappability is expected. However even for these low-mappability elements a substantial in-crease in mappability is achieved on average with paired-end reads when compared to single-paired-end 50 bp reads
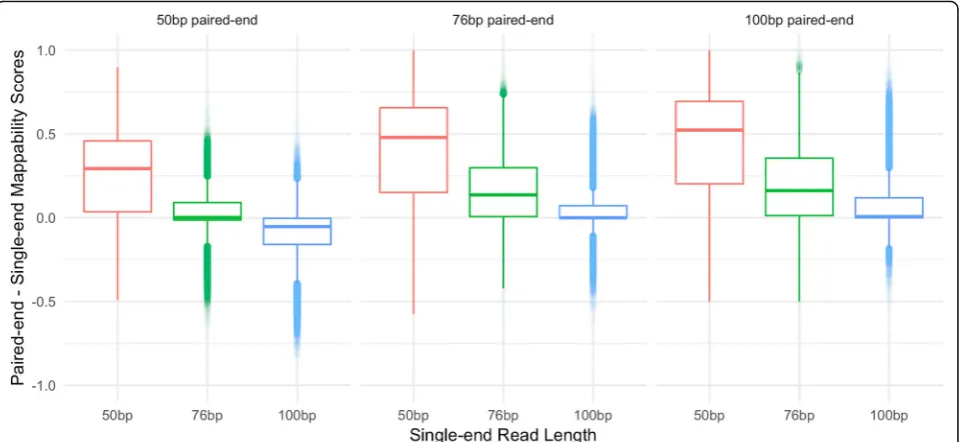
Fig. 7Difference in paired-end and single-end mappability scores across combinations of library sizes. Boxplots show the distribution of the differences between paired-end mappability scores (specified above the boxplots) and single-end mappability scores (specified along the x-axis) for each combination of 50 bp, 76 bp, and 100 bp paired and single-end libraries. The scores shown here exclude TE loci where all three paired-end libraries have 100% unique scores and where length < 300 bp in order to allow for a fair comparison with the 100 bp paired-paired-end library. Points < 0 signify a higher single-end than paired-end mappability score and points > 0 signify a higher paired-end than single-end mappability score
(Fig.5). There are a few data points where the paired end mappability is lower than the single ended mappability, due to the issue of variable insert sizes described above. The outlier with the lowest value in AluY in Fig.5is the AluY element at chrY:9192414–9192738 described above.
Effect of read lengths on Mappability of elements
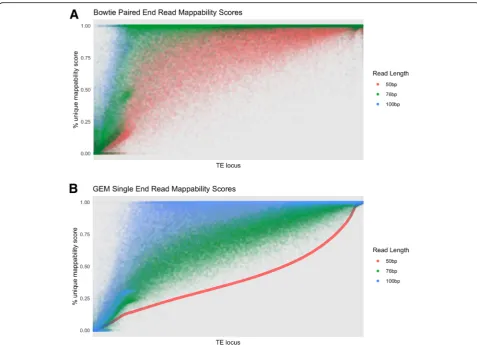
To investigate the effect of read length on mappability scores, we plotted the mappability scores for TE loci using our six different read libraries in Fig. 6. The loci
are sorted based on the 50 bp single-end mappability scores. As expected, there is a strong pattern of higher mappability scores with longer read length.
To further understand the gain between different li-brary types, we plotted the differences between all paired-end and single-end library mappability scores. As shown in Fig. 7, the scores from the 50 bp paired-end library are very comparable to a single 76 bp read library and are in general lower than a single 100 bp read library. Similarly, the 76 bp paired-end library has very similar scores when compared to a 100 bp single-end read library. This suggests that the gain in mappability from longer single reads may outweigh the gain from a shorter paired-end read library. It is however important to note that these scores are unique to our specific definition of mappability and therefore we cannot conclusively state at what point a single-read library is more advantageous than a paired-end library for all experiments.
Mappability of L1HS
As L1HS elements are active in both germline and som-atic cells [17,18], their mappability is of particular inter-est. Figure8shows that mappability scores for the 76 bp paired-end library correlate generally with the time since the L1 elements were active in the human genome; younger subfamilies contain less mappable loci than older subfamilies. This is expected because over time se-quences acquire variants and therefore become more unique leading to higher mappability scores. Because L1HS is the youngest subfamily of L1 in the human gen-ome, it contains the smallest amount of uniquely map-pable elements.
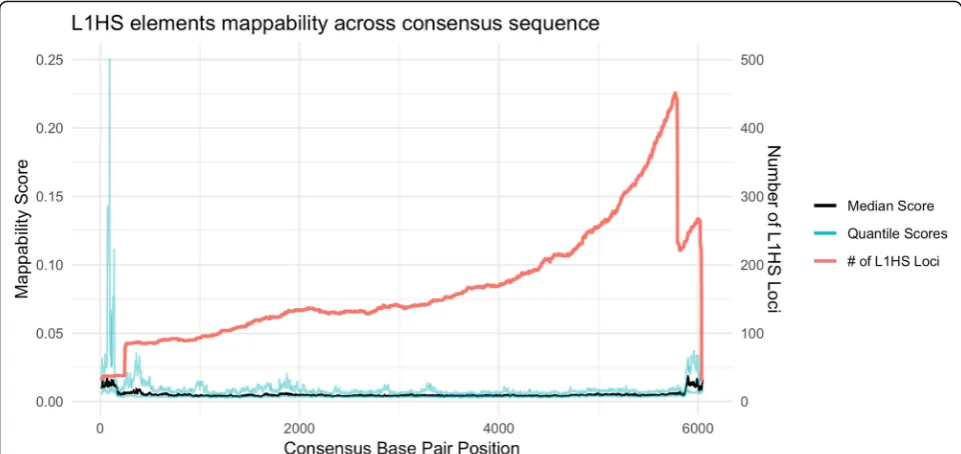
To further understand the mappability of L1HS, we in-vestigated each L1HS sequence. The insertion mechan-ism of L1HS initiates from the 3′ end of the L1 RNA and often fails to reach the 5′end [19] and therefore we expect more elements present and lower mappability scores at the 3′ end of L1HS consensus sequence. We used BLAST to align each L1HS locus in the genome to the consensus sequence obtained from RepBase [20] and recovered the mappability score for each locus at each position of the consensus sequence. Using those mapp-ability scores, the trend is confirmed, shown in Fig. 9. The median mappability score across loci decreases and the number of L1HS loci is greater towards the 3′end of the consensus sequence. Conversely the median mappability increases and the number of L1HS loci is lower towards the 5′end of the consensus sequence. For the 5′end of L1HS, about 15% of the elements have a mean mappability greater than 0.20, meaning, the source of the read can be narrowed down to five potential L1HS loci in the genome.
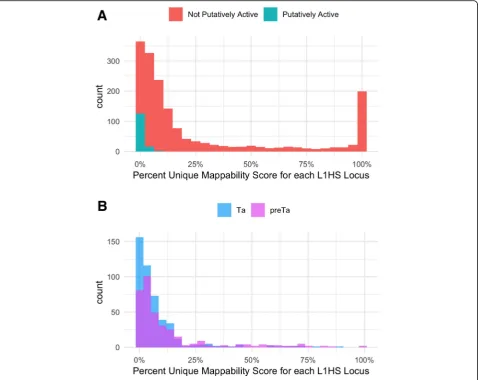
We also determined mappability scores for putatively active L1HS elements defined in L1Base 2 [21] as com-pared to other elements in the L1HS subfamily. These ele-ments are classified as putatively active if they are either full-length or contain an intact ORF2 region. Figure 10a shows the distribution of mappability for both the 144 pu-tatively active L1HS elements and the 1,542 L1HS ele-ments not predicted to be active. Using a two-sided permutation test [22], we generated a null distribution of mean differences in mappability by randomly permuting the labels“putatively active”and “not active”across all 1, 686 L1HS elements. The observed mean mappability of “putatively active” and“not active” elements were signifi-cantly different atp= 2.2e-16, which corroborates the hy-pothesis that active elements are less mappable than inactive elements.
In addition, we further classified the L1HS elements classified in Repeatmasker into sub-clades by their charac-teristic 3′UTR variants: ACA for L1HS-Ta and ACG for L1HS-preTa [23]. The resulting distributions as shown in Fig. 10b are also significantly different (p = 2.491e-06) again validating the idea that older elements, L1HS-preTA in this case, have higher mappability scores than younger elements, L1HS-Ta elements.
Conclusions
In conclusion, we present our findings that increased read length and paired-end libraries result in a rise in
the mappability of repeat elements, to the point where a majority of elements are uniquely mappable using Bowtie with paired-end reads allowing for 3 mismatches. Additionally we predict that a longer read library size of 150 bp would further increase mappability scores, although we have only calculated scores for up to 100 bp paired-end reads for feasibility reasons. In our mappability analysis the insert size chosen to simulate the paired-end kmers was fixed, whereas in a true dataset the insert size would follow a distribution. However, by aligning the kmers with Bowtie’s default allowance of a variable insert size, we allow for a distribution of possible alignments.
A limitation of our study is that we did not account for the polymorphic TEs present in the human popu-lation which could lower the mappability even further for younger elements. This limitation could be ad-dressed in the future, once we have a compilation of the full-length sequences of longer polymorphic TEs utilizing long read sequencing platforms, such as the Pacific Biosciences (PacBio) platform or the Oxford Nanopore platform. Another limitation of our study is that we do not consider splicing events that happen for certain endogenous retroviruses, e.g. HERV-K(HML-2), or MLT2A1 LTRs. This is a common limi-tation found in virtually all mappability studies due to feasibility issues, including ones aimed at regular genes. For example, for genes, artificial transcripts are generated by concatenating all exons within the
Fig. 9Mappability along the L1HS consensus sequence. The black line is the median mappability scores across L1HS elements and the blue lines are the 1st and 3rd quartile scores. The x axis represents the base positions along the consensus sequence. The red line is a density line of the number of loci present at that base position of the consensus sequence
boundary of the gene, and mappability is calculated based on the artificial transcript, ignoring realistic splicing events observed. We partially address this issue by examining the alignment using STAR, a spli-cing oriented alignment software. But, we found that in general Bowtie gave us more conservative mapp-ability, i.e. STAR was missing a lot of mappable positions.
Based on previous studies [24], only a few of all TE loci in the genome have been observed to be tran-scriptionally active depending on the tissue and devel-opmental time point, and the majority of the uniquely mappable TE loci we have identified may be biologic-ally irrelevant. Even so, these mappability estimates give us a set of references that we can utilize to
identify the few transcriptionally active and potentially biologically relevant loci with confidence. Overall, our paired-end mappability analysis suggests that longer paired-end read libraries can be confidently mapped to repetitive regions and specifically to the locus-level of the majority of TEs.
Additional files
Additional file 1:Figure S1.Colored by class distinction, each bar represents the percent unique elements in each subfamily. An element is only considered unique if every position in its sequence has a unique mappability score. Both the Bowtie and STAR scores were generated by 76bp paired-end simulated kmers. (PNG 269 kb)
Additional file 2:Figure S2.Bowtie mappability calculation method comparison. Comparison of mappability scores when calculated with two different methods. Method 1: For a single base position, if a kmer mapped to that position and jellyfish (the kmer generator) reported that kmer to appear 5 times in the genome, the mappability of that position would be 1/5. Method 2: Identify a kmer which maps exactly to a base position and take the inverse of how many times that kmer appears at other positions in the bamfile. Although the figure does not reflect it very well, over 90% of the points are placed along the diagonal of the plot. In this study we use method 1, the more conservative measure, for all paired-end score calculations. (PNG 288 kb)
Additional file 3:Figure S3.Bowtie vs GEM Mappability scores for single-end mappability. Comparison of Bowtie 76bp mapping and GEM Mappability 76-mer mappability scores with 0, 1, and 2 mismatches. (PNG 849 kb)
Additional file 4:Figure S4.UCSC Genome Browser tracks. Visualization of the 6 new hg38 UCSC Genome Browser tracks. The paired-end scores are in blue and the single-end scores are in red. (PNG 285 kb)
Additional file 5:Table S1.TE class and family mappability scores. Percent of elements in each TE class and family with completely unique mappability scores based on Bowtie alignment of 76 bp simulated reads allowing for 3 mismatches. (XLSX 8 kb)
Additional file 6:Table S2.Ancient TE families with unusually low mappability and accompanying segmental duplications. This table enumerates a number of ancient TE families which have unusually low mappability scores. Though some of these scores can be accounted for by recent segmental duplications, there still remains a substantial portion of older elements with low mappability scores that could be furthered explored. (XLSX 5 kb)
Abbreviations
GEM:GEnome Multitool; GTEx: Genotype-Tissue Expression Project; TE: Transposable Element
Acknowledgements
Not applicable.
Authors’contributions
CES and MVH conceived the study, ran the analysis, and wrote the manuscript. Both authors critically reviewed and approved the final manuscript.
Funding
This work was supported by the National Institutes of Health [R15GM116108, P20GM121325 to M.V.H.].
Availability of data and materials
Six hg38 mappability tracks (GEM Mappability single-end 50 bp, 76 bp, and 100 bp allowing 3 mismatches, Bowtie paired-end 50 bp, 76 bp, and 100 bp allowing 3 mismatches) are available for upload as a custom track on the UCSC browser athttps://github.com/HanLabUNLV/TEmappability(Additional file4: Figure S4), as well as locus level mappability scores for all TEs in the RepeatMasker database.
Ethics approval and consent to participate
Not applicable.
Consent for publication
Not applicable.
Competing interests
The authors declare that they have no competing interests.
Received: 6 February 2019 Accepted: 2 July 2019
References
1. Mangul S, Yang HT, Strauli N, Gruhl F, Porath HT, Hsieh K, et al. ROP: dumpster diving in RNA-sequencing to find the source of 1 trillion reads across diverse adult human tissues. Genome Biol. 2018;19(1):36.
2. Slotkin RK. The case for not masking away repetitive DNA. Mob DNA. 2018;9(1):15. 3. Saha A, Battle A. False positives in trans-eQTL and co-expression analyses
arising from RNA-sequencing alignment errors. F1000Res. 2019;7 [cited 2019 May 21].
4. Storvall H, Ramsköld D, Sandberg R. Efficient and Comprehensive Representation of Uniqueness for Next-Generation Sequencing by Minimum Unique Length Analyses. PLoS One. 2013;8(1) [cited 2019 May 21]. 5. Derrien T, Estellé J, Sola SM, Knowles DG, Raineri E, Guigó R, et al. Fast
computation and applications of genome mappability. PLoS One. 2012;7(1): e30377.
6. Karimzadeh M, Ernst C, Kundaje A, Hoffman MM. Umap and Bismap: quantifying genome and methylome mappability. Nucleic Acids Res. 2018; 46(20):e120.
7. Langmead B, Trapnell C, Pop M, Salzberg SL. Ultrafast and memory-efficient alignment of short DNA sequences to the human genome. Genome Biol. 2009;10(3):R25.
8. Meyer CA, Liu XS. Identifying and mitigating bias in next-generation sequencing methods for chromatin biology. Nat Rev Genet. 2014;15(11):709–21.
9. Day DS, Luquette LJ, Park PJ, Kharchenko PV. Estimating enrichment of repetitive elements from high-throughput sequence data. Genome Biol. 2010;11(6):R69.
10. Ewing AD. Transposable element detection from whole genome sequence data. Mob DNA. 2015;6(1):24.
11. Hoen DR, Hickey G, Bourque G, Casacuberta J, Cordaux R, Feschotte C, et al. A call for benchmarking transposable element annotation methods. Mob DNA. 2015;6(1):13.
12. Sims D, Sudbery I, Ilott NE, Heger A, Ponting CP. Sequencing depth and coverage: key considerations in genomic analyses. Nat Rev Genet. 2014; 15(2):121–32.
13. Marçais G, Kingsford C. A fast, lock-free approach for efficient parallel counting of occurrences of k-mers. Bioinformatics. 2011;27(6):764–70. 14. Pace JK, Feschotte C. The evolutionary history of human DNA transposons:
evidence for intense activity in the primate lineage. Genome Res. 2007; 17(4):422–32.
15. Sassaman DM, Dombroski BA, Moran JV, Kimberland ML, Naas TP, DeBerardinis RJ, et al. Many human L1 elements are capable of retrotransposition. Nat Genet. 1997;16(1):37–43.
16. Bennett EA, Keller H, Mills RE, Schmidt S, Moran JV, Weichenrieder O, et al. Active Alu retrotransposons in the human genome. Genome Res. 2008;18(12):1875–83. 17. Coufal NG, Garcia-Perez JL, Peng GE, Yeo GW, Mu Y, Lovci MT, et al. L1
retrotransposition in human neural progenitor cells. Nature. 2009; 460(7259):1127–31.
18. Upton KR, Gerhardt DJ, Jesuadian JS, Richardson SR, Sánchez-Luque FJ, Bodea GO, et al. Ubiquitous L1 mosaicism in hippocampal neurons. Cell. 2015;161(2):228–39.
19. Sun X, Wang X, Tang Z, Grivainis M, Kahler D, Yun C, et al. Transcription factor profiling reveals molecular choreography and key regulators of human retrotransposon expression. Proc Natl Acad Sci U S A. 2018;115(24):E5526–35. 20. Bao W, Kojima KK, Kohany O. Repbase update, a database of repetitive
elements in eukaryotic genomes. Mob DNA. 2015;6:11.
21. Penzkofer T, Jäger M, Figlerowicz M, Badge R, Mundlos S, Robinson PN, et al. L1Base 2: more retrotransposition-active LINE-1s, more mammalian genomes. Nucleic Acids Res. 2017;45(D1):D68–73.
22. Hothorn T, Hornik K, Van De Wiel MA, Zeileis A. Implementing a class of permutation pests: the coin package; 2008.
23. Boissinot S, Chevret P, Furano AV. L1 (LINE-1) retrotransposon evolution and amplification in recent human history. Mol Biol Evol. 2000;17(6):915–28. 24. Faulkner GJ, Kimura Y, Daub CO, Wani S, Plessy C, Irvine KM, et al. The
regulated retrotransposon transcriptome of mammalian cells. Nat Genet. 2009;41(5):563–71.
Publisher’s Note
Springer Nature remains neutral with regard to jurisdictional claims in published maps and institutional affiliations.