A comparative theoretical study of three dozers` productivity
Ola Shalaby, M. A. A. Emam
*, S. Shaaban and S. El-Demerdash
(Automotive and Tractor Engineering Dept., Helwan University.)
Abstract:Selection of earth moving equipment selected for a specific construction project is critical to the success of thistype of work. As a step forward for enhancing the information related to such issue this research aims at clarifying the effect of some dozers` design parameters on their productivity. In this regard, three tracked dozers of high reputation brands are selected and some of their performance and design parameters are retrieved from manufacturers` published manuals.The major design parameters we believe are much influencing the have been chosen in the study are; the dozer weight, the dozer blade type, and blade capacity. The selected bulldozers` are having approximately same power to weight ratio. Empirical equations for calculating the productivity for each brand have also been developed by using data-fit program. Finally, it has been concluded that the blade capacity stands as the most significant parameter as the dozer productivity increases by 60% in average whenever the blade capacity increases by 25%.
Keywords:earth moving equipment productivity, track type dozer, dozing distance, dozer design parameters productivity
Citation: Shalaby,O., M. A. A. Emam, S. Shaaban, and S. El-Demerdash. 2015. A comparative theoretical study of three dozers` productivity. AgricEngInt: CIGR Journal, 17(1): 68-77.
1 Introduction
1The productivity of dozers depends on their rim pull
which in turn is mainly affected by various parameters
such as; the terrain section grade, the rolling resistance to
dozer motion generated by the soil, the dozer travel speed,
and the gear shift used. The main design parameters for
selecting an appropriate dozer for a specific job are; the
dozer weight, the blade type, and the blade capacity. In
the present study the three tracked dozers of different
weights, blade dimensions, and blade capacity have been
used. The estimated productivity of each dozer has been
theoretically calculated, and the dozer operator basic
skills, the type of soil, the soil particles gradation, the
type of dozing, and the job efficiency havealso been
considered.
2 Dozer design parameters and productivity
Received date: 2014-11-05Accepted date:2015-01-25
*Corresponding author:Assoc. Prof. M. A. A. Emam, Automotive Engineering Dept., Faculty of Engineering, Mataria, Helwan University, Cairo, Egypt., P.O. Box 11718. Email: [email protected].
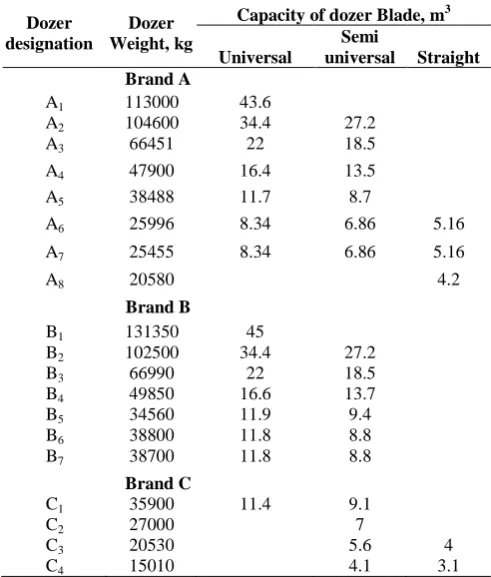
The major dozer design parameters that might be used
for selecting a proper dozer for a certain job are shown in
the Table 1; these data are being retrieved from the
performance handbooks of the three dozer brands [1, 2,
and 3].
Table 1 Selected design parameters of dozers
from three different brands
Dozer designation
Dozer Weight, kg
Capacity of dozer Blade, m3
Universal
Semi
universal Straight Brand A
A1 113000 43.6
A2 104600 34.4 27.2
A3 66451 22 18.5
A4 47900 16.4 13.5
A5 38488 11.7 8.7
A6 25996 8.34 6.86 5.16
A7 25455 8.34 6.86 5.16
A8 20580 4.2
Brand B
B1 131350 45
B2 102500 34.4 27.2
B3 66990 22 18.5
B4 49850 16.6 13.7
B5 34560 11.9 9.4
B6 38800 11.8 8.8
B7 38700 11.8 8.8
Brand C
C1 35900 11.4 9.1
C2 27000 7
C3 20530 5.6 4
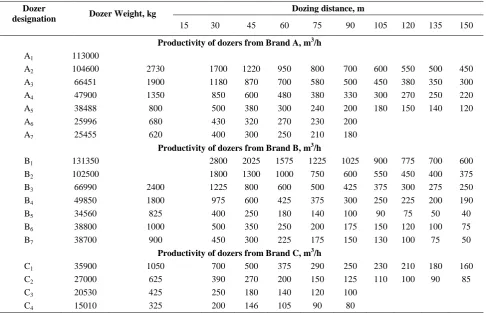
The dozers productivity figures as published in
manufacturers` manuals for various dozing distances,
using two types of blades for each dozer (universal and
semi universal) are shown in Table 2 and Table 3.
Table 2 Productivity of dozers from different brands, equipped with universal blade Dozer
designation Dozer Weight, kg
Dozing distance, m
15 30 45 60 75 90 105 120 135 150
Productivity of dozers from Brand A, m3/h
A1 113000 3900 2375 1660 1300 1060 900 800 700 650 600
A2 104600 3450 2000 1450 1100 900 800 650 600 550 500
A3 66451 2300 1300 940 700 600 550 450 400 350 300
A4 47900 1600 950 650 550 450 350 300 290 270 250
A5 38488 1070 650 450 350 300 250 230 200 180 150
A6 25996 930 580 370 300 250 220 180 150 120
A7 25455 850 500 330 260 220 180 150 130 100
A8 20580 580 330 240 180 150 130 100 90 80
Productivity of dozers from Brand B, m3/h
B1 131350 2600 2000 1425 1200 1000 850 775 625 600
B2 102500 2200 1425 1100 900 775 625 580 500 420
B3 66990 2300 1225 810 620 520 425 390 350 300 250
B4 49850 1800 1000 625 500 400 350 300 250 225 200
B5 34560 1050 575 400 300 225 200 175 160 150 120
B6 38800 1000 560 350 250 200 175 150 125 100 80
B7 38700 900 450 300 225 180 150 130 100 80 70
Productivity of dozers from Brand C, m3/h
C1 35900 1250 750 550 420 350 270 230 190 180 160
Table 3 Productivity of dozers from different brands, equipped with semi-universal blade Dozer
designation Dozer Weight, kg
Dozing distance, m
15 30 45 60 75 90 105 120 135 150
Productivity of dozers from Brand A, m3/h
A1 113000
A2 104600 2730 1700 1220 950 800 700 600 550 500 450
A3 66451 1900 1180 870 700 580 500 450 380 350 300
A4 47900 1350 850 600 480 380 330 300 270 250 220
A5 38488 800 500 380 300 240 200 180 150 140 120
A6 25996 680 430 320 270 230 200
A7 25455 620 400 300 250 210 180
Productivity of dozers from Brand B, m3/h
B1 131350 2800 2025 1575 1225 1025 900 775 700 600
B2 102500 1800 1300 1000 750 600 550 450 400 375
B3 66990 2400 1225 800 600 500 425 375 300 275 250
B4 49850 1800 975 600 425 375 300 250 225 200 190
B5 34560 825 400 250 180 140 100 90 75 50 40
B6 38800 1000 500 350 250 200 175 150 120 100 75
B7 38700 900 450 300 225 175 150 130 100 75 50
Productivity of dozers from Brand C, m3/h
C1 35900 1050 700 500 375 290 250 230 210 180 160
C2 27000 625 390 270 200 150 125 110 100 90 85
C3 20530 425 250 180 140 120 100
2.1 Effect of dozer weight of productivity
The weight of the dozer is considered as the operating
weight including operator, lubricants, coolant, full fuel
tank, hydraulic controls and fluids, front pull device and
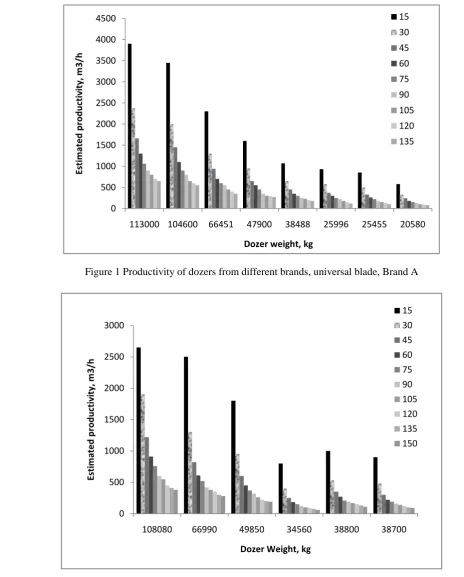
standard service crankcase guard. It has been found that
the dozer weight affects its productivity; productivity
increases as dozer operating weight increases, this is
shown in Figure 1, Figure 2 and Figure 3. This is because
the dozer can push more as its weight increases and this
means more material being dozed and pushed so
accordingly the productivity of the dozer increase.
Figure 1 Productivity of dozers from different brands, universal blade, Brand A
Figure 2 Productivity of dozers from different brands, semi-universal blade, Brand B
0 500 1000 1500 2000 2500 3000 3500 4000 4500
113000 104600 66451 47900 38488 25996 25455 20580
Esti
m
ate
d
p
ro
d
u
ctiv
ity,
m
3
/h
Dozer weight, kg
15 30 45 60 75 90 105 120 135
0 500 1000 1500 2000 2500 3000
108080 66990 49850 34560 38800 38700
Esti
m
ate
d
p
ro
d
u
ctiv
ity,
m
3
/h
Dozer Weight, kg
It also can be concluded from the below Figures that
the dozing distance affect the dozer productivity;
productivity decreases as the dozing distance increases
that can be declared by as longer dozing distance means
more material needed to be pushed so the pushing force
needed is bigger and the available force needed for
dozing is less.
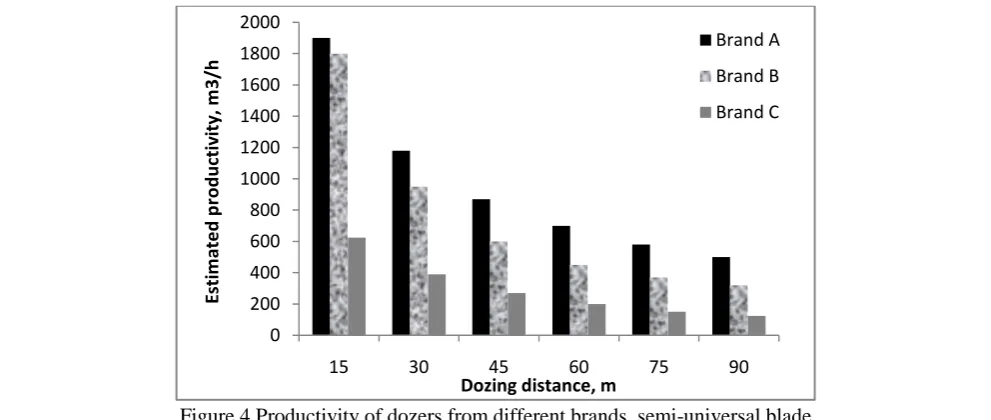
A comparison between the dozers` productivity from
three different brands is shown in Figure 4. The dozers
from each brand and using semi-universal blades are
selected such that they have approximately same power to
weight ratio; (0.0061 to 0.0065). It is clear from Figure 4
that the dozers from brand (A) have highest productivity.
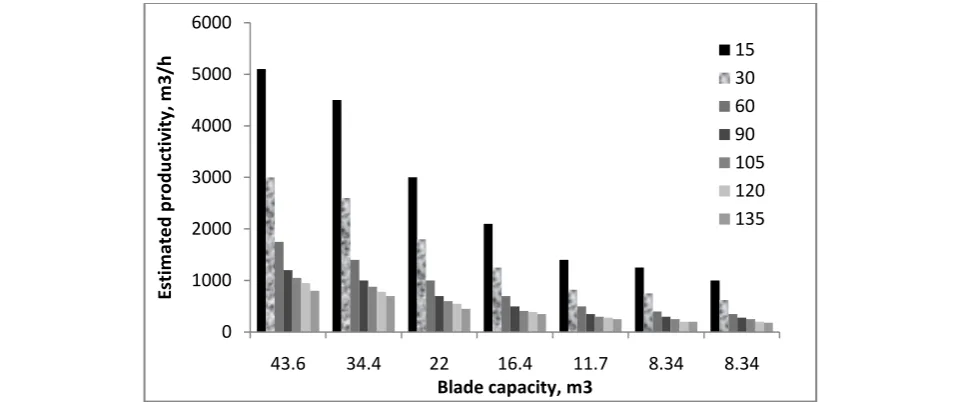
2.2 Effect of type of blade on dozer productivity
Effect of type of blade on dozer productivity is dealt
with into two parts: the kind of blade and the capacity of
blade. It has been found that the dozer productivity of the
dozer increase as the blade capacity increase and this is
true for various dozing distance as illustrated in Figure 5,
Figure 6 and Figure7. This can be explained as the blade
capacity increases this means that the ability of the blade
to doze more material increase so correspondingly the
productivity of the dozer increases. It is found that the
effect of blade capacity is the same for all the three
different brands and for different blade types. Figure 3 Productivity of dozers from different brands, semi-universal blade, Brand C
0 200 400 600 800 1000 1200
35900 26600 20530 15010
Esti
m
ate
d
p
ro
d
u
ctiv
ity,
m
3
/h
Dozer Weight, kg
15 30 45 60 75 90
Figure 4 Productivity of dozers from different brands, semi-universal blade
0 200 400 600 800 1000 1200 1400 1600 1800 2000
15 30 45 60 75 90
Esti
m
ate
d
p
ro
d
u
ctiv
ity,
m
3
/h
Dozing distance, m
Brand A
Brand B
Figure 5 Productivity at different dozing distance of dozer equipped with universal blade for brand (A)
Figure 6 Productivity at different dozing distance of dozer equipped with semi universal blade for brand (B).
Figure 7 Productivity at different dozing distance of dozer equipped with semi universal blade for brand (C).
0 1000 2000 3000 4000 5000 6000
43.6 34.4 22 16.4 11.7 8.34 8.34
Esti
m
ate
d
p
ro
d
u
ctiv
ity,
m
3
/h
Blade capacity, m3
15 30 60 90 105 120 135
0 500 1000 1500 2000 2500 3000 3500 4000
5 10 15 20 25 30
Esti
m
ate
d
p
ro
d
u
ctiv
ity
,m
3
/h
Blade capacity, m3
15 30 45 60 75 90 105 120 150
0 200 400 600 800 1000 1200
3.5 5.5 7.5 9.5 11.5 13.5
Esti
m
ate
d
p
ro
d
u
ction
,m
3
/h
Blade capacity, m3
15
30
45
60
75
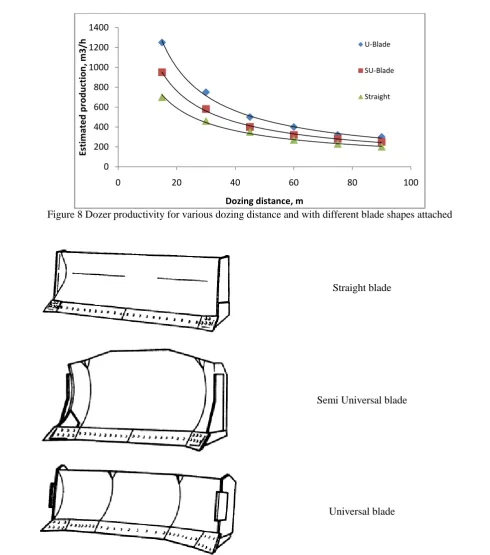
In Figure 8, the effect of shape of the blade used on
productivity is shown. It has been found that the dozers
from brand (A) equipped with universal blade have the
highest productivity relative to dozers from the two other
brands. This is due to fact that the surface area of the
universal blade, refer to Figure 9. As the surface area of
the dozing blade increases, the moved soil material in
front the blade will be more and accordingly the
productivity of the dozer increases.
Figure 8 Dozer productivity for various dozing distance and with different blade shapes attached
Straight blade
Semi Universal blade
Universal blade
Figure 9 Shapes of various dozer blades
0 200 400 600 800 1000 1200 1400
0 20 40 60 80 100
Esti
m
ate
d
p
ro
d
u
ction
,m
3
/h
Dozing distance, m
U-Blade
SU-Blade
3Empirical equations for calculating dozers`
productivity
In this study, data fit program is used to develop an
empirical equation for each dozer brand that enables
calculating its productivity. The dozer data such as;
power to weight ratio, shoe width, blade capacity, and
dozing distance are used as input data. The estimated
productivity of the track-type dozer retrieved from dozers
manuals has been compared against the results obtained
from productivity empirical equations.
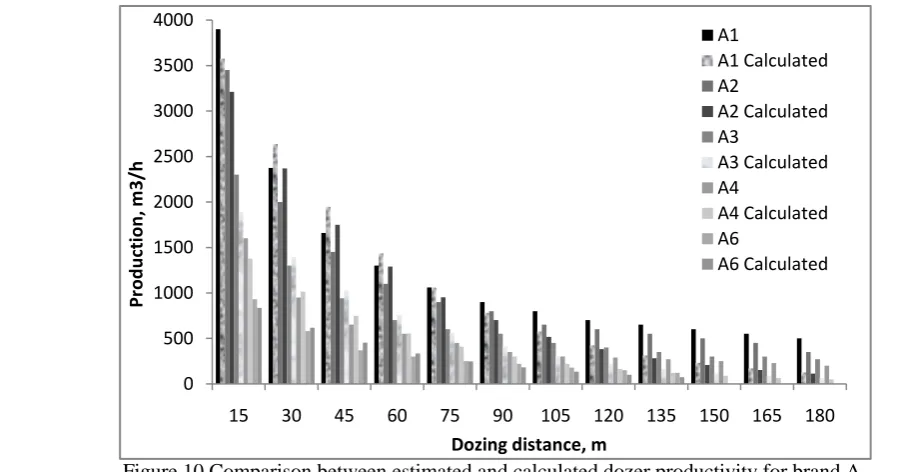
3.1 Empirical equation for dozer brand A
For developing a productivity empirical equation
(Equation 1) for dozer brand A, eight different models
were used, and their data have been introduced. Finally
the following equation has been obtained;
YA= exp (aAX1+ bAX2+ cAX3+ dAX4+eA) (1)
Where:
YA = productivity for brand A,
X1 = dozing distance,
X2 = power to weight ratio,
X3 = width and
X4 = blade capacity.
aA= - 0.02027694731,
bA= -65.01613574,
cA= -2.277912459,
dA= 0.05894368162
eA= 8.364750586.
A comparison between the estimated productivity
retrieved from the performance handbook of dozer brand
A and the calculated productivity from the above
empirical equation is shown in Figure 10 for five dozer
models.
3.2 For brand B
For developing an empirical equation to calculate
productivity for dozer brand B, seven different models
were used, and the empirical equation is written as
following Equation 2.
YB= exp (aBX1+ bBX2+ cBX3+ dBX4+eB) (2)
Where;
aB= - 0.01679468253,
bB= -62.41600132,
cB= -4.786156406,
dB= 0.07958380743
eB= 9.211688575.
Figure 10 Comparison between estimated and calculated dozer productivity for brand A.
0 500 1000 1500 2000 2500 3000 3500 4000
15 30 45 60 75 90 105 120 135 150 165 180
Pr
o
d
u
ction
, m
3
/h
Dozing distance, m
A1
A1 Calculated A2
A2 Calculated A3
A3 Calculated A4
A4 Calculated A6
A comparison between the estimated productivity
retrieved from the performance handbook of dozer brand B
and the calculated productivity from the above empirical
equation is shown in Figure 11 for five dozer models.
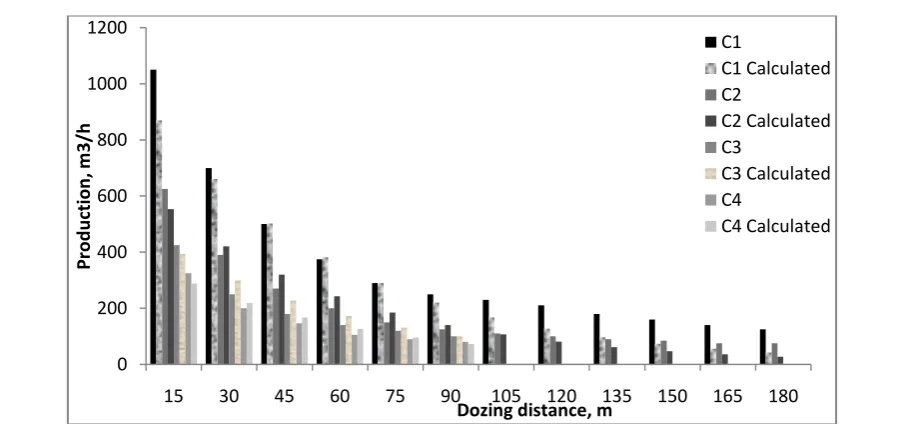
3.3 For brand C
For developing an empirical equation to calculate
productivity for dozer brand C, four different models
were used, and the empirical equation is written as
following Equation 3.
YC= exp (aCX1+ bCX2+ cCX3+ dCX4+eC) (3)
Where;
aC= - 0.01830648415,
bC= -38.86771788,
cC= 1.2024502,
dC= 0.2207064179
eC= 4.5772012.
A comparison is shown between the estimated
productivity taken from the performance handbook of
brand C and the calculated productivity from the above
empirical equation for brand C is shown in Figure 12.
Figure 12 Comparison between estimated and calculated dozer productivity for brand C.
0 200 400 600 800 1000 1200
15 30 45 60 75 90 105 120 135 150 165 180
Pr
o
d
u
ction
, m
3
/h
Dozing distance, m
C1
C1 Calculated C2
C2 Calculated C3
C3 Calculated C4
C4 Calculated
Figure 11 Comparison between estimated and calculated dozer productivity for brand B.
0 500 1000 1500 2000 2500 3000
15 30 45 60 75 90 105 120 135 150 165 180
Pr
o
d
u
ction
, m
3
/h
Dozing distance, m
B1
B1 Calculated B2
B2 Calculated B3
B3 Calculated B4
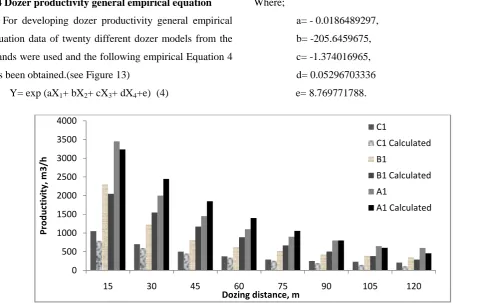
3.4 Dozer productivity general empirical equation
For developing dozer productivity general empirical
equation data of twenty different dozer models from the
brands were used and the following empirical Equation 4
has been obtained.(see Figure 13)
Y= exp (aX1+ bX2+ cX3+ dX4+e) (4)
Where;
a= - 0.0186489297,
b= -205.6459675,
c= -1.374016965,
d= 0.05296703336
e= 8.769771788.
4 Effect of dozer design parameters on
productivity
By using the productivity empirical equation for brand
(A), it has been found that with increasing the blade
capacity by 25 % the dozer productivity has increased 65%
approx.
On the other hand by decreasing of the dozer track
shoe width by 12% the productivity has been increased
by 25%.
Reducing the power to weight ratio by 15% the
productivity has been increased by 7.5%.
Similarly, the empirical equation for brand B has been
used and it has been found that by increasing the dozer
blade capacity with same percent as brand A the
productivity has been increases by 54% and with
reduction of the dozer track shoe width by 12% the
productivity has been increased by 61%. In case the
power to weight ratio has been decreased by 15% the
productivity would be increasing by 7%.
For brand C, the following it has been found that the
dozer productivity increases by 64% with increase of
blade capacity by 25%, and by reducing the dozer power
to weight ratio by 15% the productivity increases by 4.3%.
Meanwhile, the dozer track shoe width has no significant
effect on the productivity.
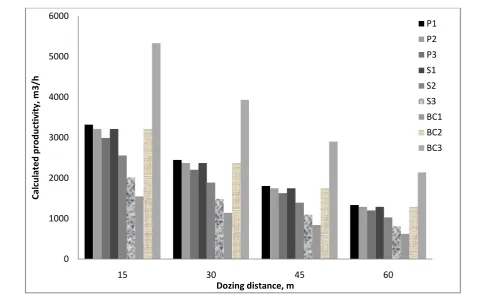
Figure 14 shows the evolution of dozer productivity
with variation of blade shape, dozer power-to-weight
ratio, and track shoe width.
Figure 13 Comparison between the estimated and calculated productivity for dozers from three brands by using the developed general empirical
0 500 1000 1500 2000 2500 3000 3500 4000
15 30 45 60 75 90 105 120
Pr
o
d
u
ctiv
ity,
m
3
/h
Dozing distance, m
C1
C1 Calculated
B1
B1 Calculated A1
5 Conclusions
Based on some design parameters of tracked dozers
from three different brands, four empirical equations for
calculating the dozer productivity have been developed;
one for each brand and the last one is a general equation
for any brand. Three different dozer design parameters
have been considered in developing these equations; they
are namely blade capacity, power to weight ratio and
track shoe width. Finally it has been concluded that the
blade capacity is the most effective parameter that
considerably affects dozers` productivity; it increases by
60% if its capacity increased by only 25%. The power to
weight ratio has a least effect on productivity as if it is
reduced by 15%, the dozer productivity increases by only
6%.
References
Caterpillar performance handbook No.42, Caterpillar Inc, January 2012.
Komatsu performance handbook No. 27, Komatsu Ltd, August 2006.
New Holland performance handbook, New Holland Construction, September 2011.
Construction planning, equipment and methods, Robert L. Peurifoy, Clifford J. Shexandyer and AviadShapira, 2006.
Construction equipment management for engineers, estimators and owners, Douglas D. Gransberg, Calin M. Popescu and Richard C. Ryan, 2006.
Figure 14 Evolution of dozer productivity with variation of blade shape, dozer power-to-weight ratio, and track shoe width.
0 1000 2000 3000 4000 5000 6000
15 30 45 60
Cal
cu
late
d
p
ro
d
u
ctiv
ity,
m
3
/h
Dozing distance, m