Data Compression Scheme of Fronthaul Network
Based on LTE
https://doi.org/10.3991/ijoe.v14i10.9312
Chenwei Feng
Xiamen University of Technology, Xiamen, China [email protected]
Abstract—As the long term evolution (LTE) mobile users and transmission data increase, the load of the fronthaul network increases. In order to control the consumption of optical fiber resources, and prevent congestion under the prem-ise of increasing data transmission, it is necessary to compress the data of the fronthaul network. In this paper, a data compression scheme of LTE-based fron-thaul network is proposed. According to the characteristics of LTE baseband signals, discrete sine transform (DST) is applied to the time domain signals, and the transformed coefficients are partitioned according to the energy concentra-tion characteristics. Bit allocaconcentra-tion is performed in different blocks, and the coef-ficients of each block are quantized by Lloyd-Max quantizer. Finally, Huffman coding is carried out to improve the compression ratio under the condition that the error is allowed. The simulation results show that the proposed data com-pression scheme has good performance in both comcom-pression ratio (CR) and er-ror vector magnitude (EVM).
Keywords—Long term evolution, Fronthaul network, Data compression, Dis-crete sine transform, Lloyd-Max quantization, Huffman coding
1
Introduction
As the distributed base station is widely used, the traditional macro base station is divided into building baseband unit (BBU) and remote radio unit (RRU). RRU and BBU are connected by optical fiber, and the network between BBU and RRU is called fronthaul network [1]. As the LTE mobile users and transmission data increase, the data size transmitted by the fronthaul network increases greatly, so it is necessary to invest a large amount of optical fiber to expand the capacity. In order to control the consumption of optical fiber resources and not generate congestion when the transmit-ted data size increases, it is necessary to compress the data of the fronthaul network so as to reduce the data size to be transmitted.
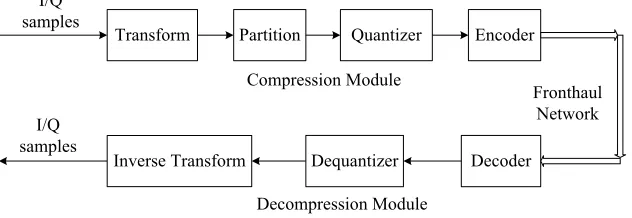
Figure 1 is a base station system deployed with a data compression scheme where a compression module and a decompression module are added to the uplink and down-link of BBU and RRU respectively.
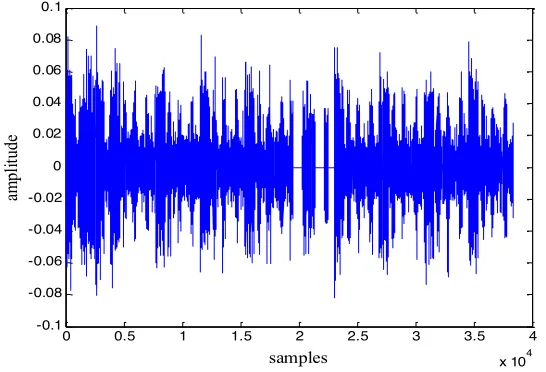
System Toolbox of Matlab is used to generate LTE downlink baseband signal, and the subcarrier modulation scheme is 16QAM and the RB number is 15. The typical I-channel time domain sampling of LTE downlink baseband signal is shown in Figure 2, from which we can see that the correlation between the time domain samples of the signal is small and the dynamic range is large. The features of the I-channel and Q-channel uplink/downlink signals are similar to those of Figure 2. At present, scalar quantization is usually used in the compression technology of fronthaul network.
Fig. 1. A base station system deployed with compression scheme
Fig. 2. I-channel time domain waveform of LTE downlink baseband signal
In literature [3], a compression algorithm based on frequency domain is put for-ward. Firstly, OFDM baseband signal is transformed from time domain to frequency domain by fast Fourier transform (FFT), and then processed by block adaptive quanti-zation (BAQ). Finally, the binary code stream is generated by adaptive Huffman cod-ing. Literature [4]proposes a time domain compression algorithm based on amplitude layering, which layers the data in the block according to amplitude size after the OFDM signal is partitioned, and scales and quantizes the amplitude in each layer to realize lossy compression of LTE baseband signal. In literature [2], I/Q sampling
points are subjected to redundant frequency spectrum elimination, including K-fold up-sampling, low-pass filtering and L-fold down-sampling (K≤L). And then the
sig-BBU
Compression Module
RRU Fronthaul
Network Decompression
Module Compression Module
Decompression Module
0 0.5 1 1.5 2 2.5 3 3.5 4
x 104 -0.1
-0.08 -0.06 -0.04 -0.02 0 0.02 0.04 0.06 0.08 0.1
samples
am
pl
nal is subjected to adaptive dynamic range control. Finally, the original bit width is quantized to the target bit width by block nonlinear quantization. Literature [5] pro-poses two improved schemes on the basis of literature [2], which continuously
quan-tizes error transmission and dither signal multichannel transmission for improving the performance of coordinated multi-point transmission/reception (CoMP) system and distributed antenna system. In literature [6], the improved BAQ is applied to the com-pression of I/Q baseband signals. First, I/Q data are partitioned into blocks, and the blocks are transformed into normal distribution. Then the Lloyd-Max quantizer is used to determine the optimal quantization level. Finally, the data in the block are compared with the optimal level threshold and encoded. Literature [7]first conducts frequency domain redundancy compression on I/Q signal based on resampling, then transforms the signal from rectangular coordinate system to polar coordinate system. The transformed amplitude is subjected to 10 bit linear quantization based on noise shaping, and the phase is subjected to 12 bit linear quantization so as to achieve a high compression ratio within the allowable range of the error. Literature [8] proposes a compression algorithm based on vector quantization, studies the vectorization of I/Q samples, and uses multilevel vector quantization to reduce the search complexity and the size of the codebook, which improves the performance in terms of rate and distor-tion. Literature [9]proposes an LTE downlink baseband signal compression algorithm based on linear prediction and Huffman coding, which reduces the complexity of coding and decoding and limits the energy consumption.
In addition, the data compression under some specific scenes is also studied in some literatures. Literature [10] considers that in the uplink, the data packet of the terminals may have sparsity due to the burst transmission of the delay-sensitive ser-vice or the random access of the terminals, so distributed compressed sensing (CS) and joint restore technology are adopted. A distributed fronthaul network compression scheme based on CS is proposed. In the RRU scene based on large-scale antenna array, literature [11] proposes space-time fronthaul network compression algorithm for compressing uplink LTE baseband signal. The algorithm firstly uses the correla-tion of received signal in space and time to conduct low-rank approximacorrela-tion by prin-cipal component analysis (PCA) to reduce the matrix dimension, and then further compresses it with transform coding with bit allocation.
2
Compression Scheme
2.1 Scheme flow and block diagram
Figure 3 shows a flow chart of the compression scheme. The input original signal is sent to the transform module, and the generated coefficients are divided into high-energy and low-high-energy data blocks according to the distribution. Then the two parts of data blocks are sent to the quantization module for quantization coding and output. The receiver performs the reverse process, restoring the signal.
Fig. 3. Flow chart of scheme
Among all orthogonal transforms, the Karhunen-Loeve transform (KLT) is the best compression transform in theory, but it is not applicable in most practical cases. In other orthogonal transforms, discrete Fourier transform (DFT), discrete cosine trans-form (DCT), and DST have good energy convergence effects and the convergence degree is similar [12]. However, DFT involves complex operation, which is not con-ducive to the implementation of field-programmable gate array (FPGA). DCT trans-form is based on real number and the algorithm complexity is low, which is easy to implement. Besides, the performance of DCT transform is better than that of DFT transform in terms of compression. DST transform has very similar characteristics to DCT transform. The performance of DST is close to that of optimal KLT transform when processing random signal with weak correlation and its compression perfor-mance is better than that DCT [13-16].
After comprehensive comparison of the energy convergence effect, complexity and whether it is easy to implement in hardware, DST is selected as the transform method. Its characteristic of energy concentration is used to select and process the transformed coefficients. Only a few bits are used for the unimportant coefficients while more bits are used for the important coefficients with high energy. At the same time, combining Lloyd-Max [17] quantization and Huffman coding, an improved compression scheme is designed.
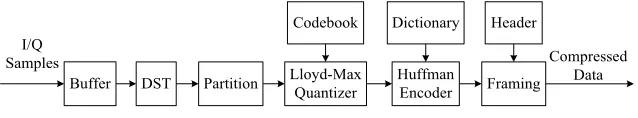
Figure 4 shows a functional block diagram of the scheme encoder. First, the input I/Q samples enter the buffer whose size depends on the actual application. The signal is then sent to a DST transform module to generate DST coefficients. The data are divided into high energy data block and low energy data block according to the
distri-Quantizer Encoder I/Q
samples
Dequantizer Decoder
Fronthaul Network I/Q
samples
Compression Module
Decompression Module Partition
Transform
bution of the DST coefficients. The two parts of data blocks are respectively sent to the Lloyd-Max quantization module, and different bits are allocated according to the distribution of the data of each block for quantization, and quantization index values are generated according to the codebook. Then lossless compression is conducted through Huffman coding to further reduce the code length. Finally, data of two blocks are encoded and combined, and the frame header information is added and encapsu-lated into a frame, wherein the frame header information may include frame length, block coding mode, and quantization coding table.
Fig. 4. Functional block diagram of scheme encoder
Figure 5 shows a functional block diagram of the scheme decoder. First, the re-ceived complete frame of data is put into a buffer for processing. Then, the frame is decoded and is decomposed into three parts: the frame header information, the first data block coding and the second data block coding, among which the frame header information will provide necessary information for the processing of the subsequent modules. The first data block encoding and the second data block encoding respec-tively enter Huffman decoders to generate the quantization index values according to the corresponding dictionary. The de-quantization module looks up the corresponding values in the codebook according to the index values, and restores the quantization value of the original sender. Finally, two parts of data are combined and I/Q samples are reconstructed by IDST.
In the following, the key modules of the encoder will be described, and the corre-sponding modules of the decoder are the reverse process, so it will not be described otherwise.
Fig. 5. Functional block diagram of scheme decoder
2.2 Analysis of key modules
DST module and block module. If a real sequence x(n) is given, the one-dimensional DST transform is defined as:
(1)
Buffer DST Partition Lloyd-MaxQuantizer
I/Q Samples
Codebook
Compressed Data Header
Framing Huffman
Encoder Dictionary
Buffer DecodingFrame HuffmanDecoder DequantizerLloyd-Max
I/Q Samples Dictionary
Compressed Data
IDST Combination Codebook
1 2
( ) ( )sin[ ]
1 1
N
n
nk
X k x n
N N
p =
=
Where, n, k = 0, 1..., N. The IDST is defined as:
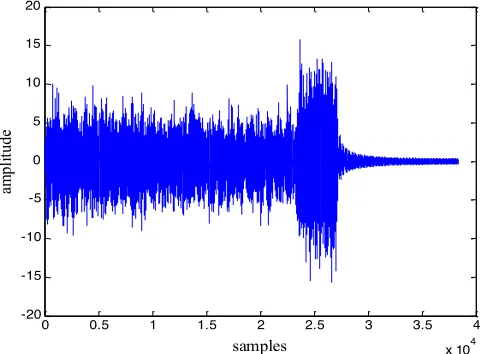
(2) The baseband signal shown in Figure 2 is used to observe the energy convergence property of the time domain data after DST transform, and the coefficient distribution after transform is shown in Figure 6. It can be found that the transformed energy is mainly concentrated in the low frequency part. Therefore, the DST coefficient of the energy concentration can be effectively retained while the coefficient of the smaller energy can be roughly expressed, thereby providing large space for the subsequent compression.
Fig. 6. DST transform coefficient distribution diagram of I-channel sampling of LTE downlink baseband signal
It can be found from simulation that when the RB number is the same, the dividing point between high energy and low energy of DST transform of I-channel or Q-channel signals of LTE baseband signal is not changed regardless of the uplink and downlink modes and the modulation of each subcarrier. Thus, the block module only needs to determine different dividing points according the RB number corresponding to the original signal so as to quickly partition, reducing the complexity of the system.
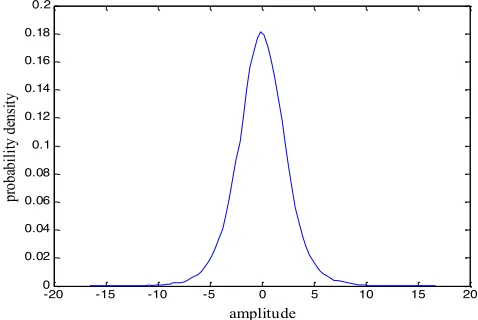
Quantization module. From the distribution of the coefficients of the high energy block and the low energy block in the DST transform coefficient diagram of the sig-nal shown in Figure 6, the probability density distribution is obtained in Figure 7, where the coefficients of the high energy block and the low energy block are both close to the Gaussian distribution. The signal condition of the Q-channel is similar to this.
1 2
( ) ( )sin[ ]
1 1
N
k
nk
x n X k
N N
p =
=
+
å
+0 0.5 1 1.5 2 2.5 3 3.5 4
x 104 -20
-15 -10 -5 0 5 10 15 20
samples
am
pl
(a) Probability density distribution diagram of high energy block coefficients
(b) Probability density distribution diagram of low energy block coefficients
Fig. 7. Probability density distribution diagram of two energy block coefficients after DST transform of I-channel signal
Non-uniform quantization is used because the signal input to the quantizer is not uniformly distributed. This scheme adopts Lloyd-Max quantization which is widely used at present. Lloyd-Max quantization achieves its optimal quantization according to the characteristics of the probability density function. In the region where the prob-ability distribution is larger, the quantization is denser, and vice versa, so that the mean-square error (MSE) of the statistical quantization is minimized [18]. The MSE of the statistical quantization is defined as:
-20 -15 -10 -5 0 5 10 15 20
0 0.02 0.04 0.06 0.08 0.1 0.12 0.14 0.16 0.18 0.2
amplitude
pr
oba
bi
lit
y de
ns
ity
-2 -1.5 -1 -0.5 0 0.5 1 1.5 2 2.5
0 0.5 1 1.5 2 2.5 3
amplitude
pr
oba
bi
lit
y de
ns
(3) Where, x is an input sample, fx(x) is a probability density function of signal x, (bi, bi+1) is a quantization region boundary, and yi is an output quantization value. If min-imum σq2 is required, then:
(4)
(5) From Formulas (4) and (5), it can be obtained that:
(6)
From Formula (5), it can be obtained that:
(7) To get the best bi and yi at the same time, we shall use Lloyd-Max algorithm to it-erate in the following steps:
1.Initialize parameters yi, [σq2]0, and ε, among which ε is a preset minimum value.
2.Update bi expressed in formula (6). 3.Update yi expressed in formula (7).
4.Calculate the minimum MSE expressed in formula (3).
5.If ([σq2]j-1-[σq2]j)/[σq2]j-1<ε, stop and output the codebook, namely yi; otherwise j=j+1, then turn to the step (2).
The number of the above training sequence should be large enough, ε should be small enough, and the initialized [σq2]0 can be much greater than ε. At the same time,
as the number of iterations increases, σq2 becomes smaller and the signal recovery effect is better.
What should be noted is that the quantization does not convert the data to a similar quantization value, but converts the index, also referred to as a codeword, correspond-ing to the quantization value in the codebook. In other words, the quantizer outputs the position code corresponding to the original data in its interval as a result of quan-tization. In the process of de-quantization, the value corresponding to the position found in the codebook is output as the value after de-quantization according to the
1
2 2 2
1
[( ) ] i ( ) ( )
i
M b
q b i x
i
E x y x y f x dx
s +
=
= - =
åò
-0 ) ( ) ( 2 1 2 = -= ¶ 
ò
+ dx x f y x y x b bi i i q i s 0 ) ( ) ( ) ( )( 2 2
1 2 = -= ¶ 
- f x b y f x
y b
b i i x i i x
i q s 2 1 i i
i y y
b = - +
1 1 ( ) ( ) i i i i b x b i b x b
xf x dx y
f x dx +
+
=
ò
received index value. In order to improve the transmission efficiency, the codebook needs to be generated through a large number of training sequences before transmit-ting the actual data so that the quantization and de-quantization become the table lookup mode when the data are compressed and decompressed.
In this scheme, the quantization is conducted in blocks. The DST coefficients of the high energy block and the low energy block are quantized respectively by Lloyd-Max, and allocated with different bits so that the best EVM parameter is maintained on the basis of the fewest transmitted bits.
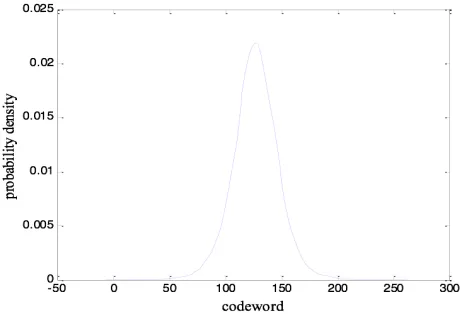
Coding module. Since the codeword corresponding to the high energy block or the low energy block coefficient of the DST transform is not uniformly distributed, the codeword obtained after quantization can be further compressed by Huffman coding with high coding efficiency, fast arithmetic speed and low complexity.
After the high energy coefficient shown in Figure 7 (a) is quantized by 8-bit, prob-ability statistics is performed on the output codeword to obtain a probprob-ability density distribution, as shown in Figure 8. As can be seen from the figure, the range of code-word is 0-255, and the occurrence probability is very different. Therefore, higher coding efficiency can be obtained by Huffman coding. After Huffman coding, the average code length is 6.4175 that is less than 8, thus achieving further compression. The low energy coefficient case is similar to this.
When one frame of data is input during encoding, the encoder looks up the diction-ary according to the symbols to be encoded, determines the corresponding codeword and outputs the corresponding codeword to the buffer until the end of the frame, and outputs the encoding result.
When Huffman coding in performed on a specific signal source, there is a process of forming a dictionary. If coding is conducted when the signal source changes, a large coding delay will be brought. The actual method is to first determine a set of training data set with abundant data, then Huffman coding is performed on it to gen-erate corresponding Huffman dictionary which is taken as Huffman coding dictionary for actual transmission. Thus, Huffman coding becomes a simple look-up table pro-cess.
The Huffman decoding module performs the inverse process of the Huffman en-coding module, and the dictionary used for deen-coding is the same as that for the encod-ing. The selection information of the dictionary is also included in the frame header information. Huffman decoding process is as follows:
The decoder reads one bit at a time to compare with the codeword in the diction-ary, and outputs a corresponding symbol if a fully matched set of codeword is searched. Otherwise, the decoder continues to read the next bit and searches until a fully matched set of codeword is searched, thereby achieving lossless data recovery.
In addition, in the decoding process, it is necessary to judge whether the number of decoded codeword obtained after Huffman decoding matches the encoding length according to the received frame header information. If it matches, it means that all Huffman codeword of the frame is solved and decoding of the next frame goes on.
3
Simulation and Analysis
3.1 Performance evaluation parameter
When lossy compression is performed, the compression ratio can be increased as much as possible if the degree of distortion is within the acceptable range to the user, which requires the introduction of a performance evaluation parameter of compres-sion. At present, CR and EVM are performance evaluation parameteres for the com-pression coding scheme [19].
CR reflects the reduction degree of the data scale by the compression scheme, which is defined as the ratio of the data size before compression to the data size after compression, as shown in Formula (8). The larger the CR is, the larger the baseband data size that the fronthaul network can carry per unit time.
(8)
Where, S expresses the original data size and D is the data size after compression. EVM is the ratio of the average power between the actual measurement signal and the ideal error-free signal, which is defined as the ratio of the mean square root value of the average power of the error vector signal to the mean square root value of the ideal error-free signal, as shown in Formula (9).
(9)
Where, R represents the ideal error-free reference signal and Z represents the actual measurement signal. The smaller the EVM is, the better the signal recovery is, vice versa.
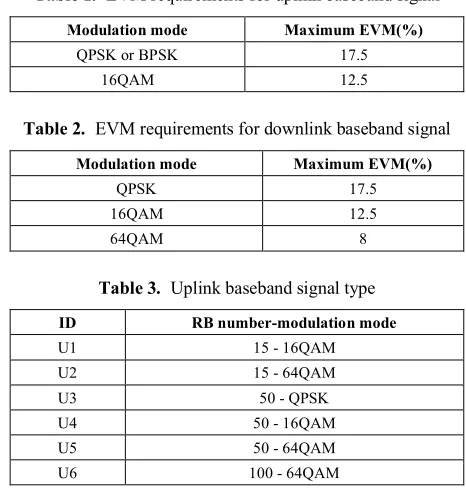
3GPP specifications have uniform requirements for EVM of uplink and downlink LTE signals by using different modulation modes, as shown in Table 1 and Table 2 [20].
S CR
D
=
( )
100% ( )
RMS Z R EVM
RMS R
Table 1. EVM requirements for uplink baseband signal
Modulation mode Maximum EVM(%)
QPSK or BPSK 17.5
16QAM 12.5
Table 2. EVM requirements for downlink baseband signal
Modulation mode Maximum EVM(%)
QPSK 17.5
16QAM 12.5
64QAM 8
Table 3. Uplink baseband signal type
ID RB number-modulation mode
U1 15 - 16QAM
U2 15 - 64QAM
U3 50 - QPSK
U4 50 - 16QAM
U5 50 - 64QAM
U6 100 - 64QAM
3.2 Performance analysis
The LTE uplink / downlink baseband signal used in the simulation is generated by the LTE System Toolbox of Matlab. According to the adopted uplink-downlink mode, the number of resource blocks (RBs) and the subcarrier modulation mode, several groups of baseband signals are selected as test signals, as shown in Table 3 and Table 4.
First, in order to verify the benefits of block processing, D1 file is selected as the test signal. In block quantization, the quantization bit number allocated to the high energy block is a and that of the low energy block is b. The test results shown are obtained in Table 5 by allocating different values to a and b.
The D1 file is simulated and tested in block-free mode. Then combined with the statistical results in Table 5, three sets of performance comparisons of block-free
Table 4. Downlink baseband signal type
ID RB number- modulation mode
D1 15 - 16QAM
D2 15 - 64QAM
D3 50 - QPSK
D4 50 - 16QAM
D5 50 - 64QAM
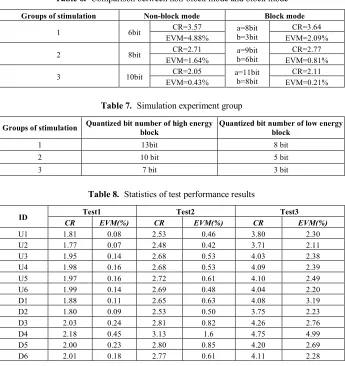
mode and block mode are obtained, as shown in Table 6. Under block-free mode, if the quantization bit number is 6 bit, 8 bit and 10 bit respectively, we can obtain the corresponding CR and EVM. It can be seen that CR = 3.57 and EVM = 4.88% when the quantizer in block-free mode allocates 6 bits for quantization; When a = 8 bit, b = 3 bit in block mode, CR = 3.64 is slightly higher than that in block-free mode, and EVM = 2.09%, which is more than half less than that in block-free mode. Therefore, the performance after block is greatly improved.
Similarly, from the comparison between the second group and the third group, it is found that performance also gets improved. Therefore, after block, more quantization bits are allocated to the high energy block and fewer quantization bits are allocated to the low energy block, and its performance will be better than that before block.
For the different types of test signals in Table 3 and Table 4, statistical result simi-lar to that shown in Table 5 can be obtained. In actual transmission, the lowest EVM quantization bit allocation scheme can be selected according to the CR required by the system, or the highest CR quantization bit allocation scheme may be selected accord-ing to EVM allowed by the system so that the overall performance is optimal.
In order to explore the compression performance of different types of signals, three sets of simulation experiments are performed on the test signals shown in Table 3 and Table 4, and each set of simulation experiment uses different quantization bits for the block data, as shown in Table 7.
After the simulation test, three sets of statistical results are obtained, as shown in Table 8. As can be seen from Table 8, as the compression ratio increases, EVM in-creases. The greater the compression of the test file is, the greater the distortion and the greater the error is. Although the compression scheme causes different degrees of
Table 5. Test results of allocation of different quantization bits between high energy block and low energy block
CR a EVM (%) b
5bit 6bit 7bit 8bit 9bit 10bit 11bit 12bit 13bit 14bit
1bit 6.19, 8.40 5.54, 6.20 4.99, 4.98 4.34, 4.36 3.83, 4.17 3.43, 4.12 3.10, 4.11 2.84, 4.11 2.62, 4.11 2.44, 4.11
2bit 5.50, 7.80 4.98, 5.35 4.53, 3.88 3.99, 3.04 3.55, 2.76 3.20, 2.69 2.92, 2.67 2.68, 2.66 2.49, 2.66 2.32, 2.66
3bit 4.86, 7.48 4.44, 4.87 4.08, 3.19 3.64, 2.09 3.27, 1.66 2.97, 1.53 2.73, 1.50 2.52, 1.49 2.35, 1.49 2.20, 1.49
4bit 4.34, 7.37 4.01, 4.71 3.71, 2.94 3.34, 1.67 3.03, 1.10 2.77, 0.89 2.55, 0.84 2.37, 0.82 2.22, 0.82 2.09, 0.82
5bit 4.06, 7.35 3.76, 4.67 3.50, 2.87 3.17, 1.55 2.89, 0.90 2.65, 0.63 2.45, 0.55 2.28, 0.52 2.14, 0.52 2.02, 0.52
6bit 3.83, 7.34 3.57, 4.65 3.33, 2.84 3.03, 1.50 2.77, 0.81 2.55, 0.50 2.37, 0.39 2.21, 0.35 2.08, 0.35 1.96, 0.34
7bit 3.54, 7.33 3.31, 4.65 3.11, 2.83 2.84, 1.48 2.61, 0.76 2.42, 0.42 2.25, 0.27 2.11, 0.22 1.99, 0.21 1.88, 0.21
loss to the original signal, when CR is less than 4, EVM can be controlled within 3%, which is far lower than the requirement of 3GPP.
In addition, as shown in Table 8, when the quantization bits of the high energy block and the low energy block are 13 and 8 respectively, CR for all test files is be-tween 1.77 and 2.18, and EVM is bebe-tween 0.07% and 0.45%; when the quantization bits of the high energy block and the low energy block are 10 and 5, CR for all test files is between 2.48 and 3.13, and EVM is between 0.42% and 1.6%; when the quan-tization bits of the high energy block and the low energy block are 7 and 3, CR for all test files is between 3.71 and 4.75, and EVM is between 2.11% and 4.99%. Therefore, it can be found that when the quantization bits of the high energy block and the low energy block are determined, the compression ratio for all test files is basically the same, and their EVM is also basically the same. Thus, the scheme is universal and consistent for all types of baseband signals.
Table 6. Comparison between non-block mode and block mode
Groups of stimulation Non-block mode Block mode
1 6bit EVM=4.88% CR=3.57 b=3bit a=8bit EVM=2.09% CR=3.64
2 8bit EVM=1.64% CR=2.71 b=6bit a=9bit EVM=0.81% CR=2.77
3 10bit CR=2.05 a=11bit b=8bit CR=2.11
EVM=0.43% EVM=0.21%
Table 7. Simulation experiment group
Groups of stimulation Quantized bit number of high energy block Quantized bit number of low energy block
1 13bit 8 bit
2 10 bit 5 bit
3 7 bit 3 bit
Table 8. Statistics of test performance results
ID CR Test1 EVM(%) CR Test2 EVM(%) CR Test3 EVM(%)
U1 1.81 0.08 2.53 0.46 3.80 2.30
U2 1.77 0.07 2.48 0.42 3.71 2.11
U3 1.95 0.14 2.68 0.53 4.03 2.38
U4 1.98 0.16 2.68 0.53 4.09 2.39
U5 1.97 0.16 2.72 0.61 4.10 2.49
U6 1.99 0.14 2.69 0.48 4.04 2.20
D1 1.88 0.11 2.65 0.63 4.08 3.19
D2 1.80 0.09 2.53 0.50 3.75 2.23
D3 2.03 0.24 2.81 0.82 4.26 2.76
D4 2.18 0.45 3.13 1.6 4.75 4.99
D5 2.00 0.23 2.80 0.85 4.20 2.69
4
Conclusions
In this paper, a fronthaul network data compression scheme based on LTE is pro-posed according to the data characteristics of the fronthaul network. According to the characteristics of LTE baseband signal, DST transform in performed on the time do-main signal and the time dodo-main data is transformed into the transform dodo-main for processing. The transformed coefficients are partitioned by the transformed energy concentration characteristic, and bit allocation is performed between different blocks. The coefficients of the low energy block are represented by fewer bits whole those of the high energy block are expressed by more bits. The coefficients of each block are quantized by Lloyd-Max quantizer, and then are encoded by Huffman coding, which achieves compression within the allowable range of the error. Finally, CR and EVM of the data compression scheme are tested and analyzed, which can realize high com-pression ratio and low error. In addition, the system has low complexity and its hard-ware is easy for implementation.
5
Acknowledgements
This work was supported by High-level Talent Project of Xiamen University of Technolgy under Grant No. YKJ17021R and Natural Science Foundation of Fujian under Grant No. 2016J01323 and Grant No. 2015J01670 and Education and Scientific Research of Young Teacher of Fujian under Grant No. JAT170406.
6
References
[1]Pfeiffer, T. (2015). Next Generation Mobile Fronthaul Architectures. Optical Fiber Com-munications Conference and Exhibition. IEEE, pp 1-3. https://doi.org/10.1364/OFC.201 5.M2J.7
[2]Guo, B., Cao, W., Tao, A., Samardzija, D. (2012). CPRI Compression Transport for LTE and LTE-A Signal in C-RAN. International ICST Conference on Communications and Networking in China. pp 843-849. https://doi.org/10.1109/ChinaCom.2012.6417602
[3]Feng, C. (2012). Compression and Coding Algorithms for OFDM Baseband Modulat-ed Signals. Xidian University.
[4]Chen, J. (2014). Research on Time Domain Compression Algorithm for LTE Base-band Signals. Xidian University.
[5]Samardzija, D., Pastalan, J., Macdonald, M., Walker, S., Valenzuela, R. (2012). Com-pressed Transport of Baseband Signals in Radio Access Networks. IEEE Transactions on Wireless Communications, 11(11): 3216-3225. https://doi.org/10.1109/TWC.2012. 062012.111359
[6]Yu, W., Zhou, L., Sun, H. (2013). BAQ Algorithm in Base Station Data compression. Journal of Signal Processing, 29(11): 1568-1574.
[7]Song, Y. (2014). Research and Implementation of Backhaul Compression Technology of LTE in C-RAN. University of Electronic Science and Technology of China.
[9]Ramalho, L., Fonseca, M. N., Klautau, A., Lu C. G., Berg M., Trojer E., Höst S. (2017). An LPC-Based Fronthaul Compression Scheme. IEEE Communications Letters, 21(1): 318-321. https://doi.org/10.1109/LCOMM.2016.2624296
[10]Rao, X., Lau, V. K. N. (2014). Distributed Fronthaul Compression and Joint Signal Re-covery in Cloud-RAN. Signal Processing IEEE Transactions on, 63(4): 1056-1065.
https://doi.org/10.1109/TSP.2014.2386290
[11]Choi, J., Evans, B. L., Gatherer, A. (2016). Space-time fronthaul compression of com-plex baseband uplink LTE signals. ICC 2016 - 2016 IEEE International Conference on Com-munications. IEEE, pp 1-6. https://doi.org/10.1109/ICC.2016.7511265
[12]Yao, Q. D. (2006). Fundamentals of Image Coding. Tsinghua University Press.
[13]Cao, X. H., Liu, H. W., Wu, S. J. (2007). The Application of Discrete Consine (Si-ne)Transform in Radar Target Recognition. Journal of Circuits and Systems, 12(5):72-75. [14]Sayood, K. (2017). Introduction to Data Compression. Morgan Kaufmann.
[15]Li, X. J. (1986). Discussion of Data Compression Performance for DST, DST_1 and Other Transform. Telemetry Technology, 1: 16-21. Elbeltagy, A. E. H. M., Youssef, A. M., Bay-oumy, A. M., Elhalwagyet Y. Z. (2018). Fixed Ground-target Tracking Control of Satel-lites Using a Nonlinear Model Predic-tive Control. Mathematical Modelling of Engineer-ing Problems, 5(1): 11-20. https://doi.org/10.18280/mmep.050102
[16]Lloyd, S. (1982). Least squares quantization in PCM. IEEE Transactions on Infor-mation Theory, 28(2): 129-137. https://doi.org/10.1109/TIT.1982.1056489
[17]Max, J. (1960). Quantizing for Minimum Distortion. IRE Transactions on Information Theory, 6(1): 7-12. https://doi.org/10.1109/TIT.1960.1057548
[18]Nunna, S., Kousaridas, A., Ibrahim, M., Dillinger M., Thuemmler C., Feussner H., Schneider A. (2015). Enabling Real-Time Context-Aware Collaboration through 5G and Mobile Edge Computing. International Conference on Information Technology - New Generations. IEEE, pp 601-605. https://doi.org/10.1109/ITNG.2015.155
[19]ETSI LTE. Evolved Universal Terrestrial Radio Access (E-UTRA); User Equipment (UE) Radio Transmission and Reception (3GPP TS 36.101 version 10.10.0 Release 10), March 2013. ETSI TS, 136(101): V10.
7
Author
Feng Chenwei is with the School of Opto-electronic and Communication Engi-neering, the Fujian Key Laboratory of Optoelectronic Technology and Devices, and the Fujian Key Laboratory of Communication Network and Information Processing at Xiamen University of Technology, Xiamen 361024, China.
He received the B.S. degree in communication engineering from Fuzhou Universi-ty, Fuzhou, China, in 2004 and the M.S. degree and the Ph.D. degree in communica-tion and informacommunica-tion system from Xiamen University, Xiamen, China, in 2007 and 2017, respectively. He is an Associate Professor of Communication Engineering with Xiamen University of Technology, Xiamen, China. His research interests include wireless communication, wireless network and data compression.