Optimization of tracer coating parameters and their effects on the
mechanical properties and quality of food-grade tracers for
grain traceability
Kun Liang
,
Lingling Zhang
,
Xiaohe Chen
,
Mingxia Shen
*(College of Engineering/Key Laboratory of Intelligent Equipment for Agriculture of Jiangsu Province, Nanjing Agricultural University, Nanjing 210031, China)
Abstract: The purpose of this study was to optimize the coating process of food-grade tracers to manufacture tracers with good physical, mechanical and practical properties and an excellent appearance. The effects of the coating weight gain (1.00%-5.00%), coating solution spray rate (1.50-7.50 g/min) and tablet bed temperature (30°C-40°C) on the coating appearance quality, moisture absorption rate, friction coefficient, peak shear force, breaking rate, barcode recognition rate, transport wear rate and transport recognition rate were analysed using a Box–Behnken design (BBD) of response surface methodology (RSM). The experimental data were fitted to quadratic polynomial models by multiple regression analysis. The mathematical models of the barcode recognition rate, transport wear rate and transport recognition rate exhibited no statistically significant difference in these data. The optimum coating parameters were as follows: a 5.00% coating weight gain, spray rate of 5.47 g/min and tablet bed temperature of 35.42°C. Under the optimized conditions, the tracers had a good appearance (coating appearance quality), moisture resistance (moisture absorption rate), and frictional (friction coefficient), compression (peak shear force), and impact characteristics (breaking rate).
Keywords: grain traceability, food-grade tracer, coating process, optimization, Box-Behnken design DOI: 10.25165/j.ijabe.20191202.4180
Citation: Liang K, Zhang L L, Chen X H, Shen M X. Optimization of tracer coating parameters and their effects on the mechanical properties and quality of food-grade tracers for grain traceability. Int J Agric & Biol Eng, 2019; 12(2): 201–209.
1 Introduction
Grain traceability is required in the grain industry, as concerns about biotechnology products, food safety regulations and bio-security policies have significantly increased[1]. A grain traceability system should be able to trace grain origin to address emerging issues and ensure marketing system competitiveness for producers and handlers[2]. However, tracing grains from their harvest to their final destination is very difficult because grains have small individual sizes and are handled in massive quantities[1,3]. Additionally, grains of various origins are often mixed at multiple points in the supply chain based on their different uses and grades[1]. Therefore, the traditional identification technology and labelling method do not meet the need of precise tracing for grain traceability.
To address the challenge of labelling grains, food-grade tracers were developed at Texas A&M University for local labelling and marketability to preserve the identity of grains and improve their traceability from harvest to final destination[4,5]. The food-grade tracers contained 2D barcodes printed with edible ink and embedded into the grains at harvest, and the barcodes that could be
Received date: 2018-02-14 Accepted date: 2018-11-02
Biographies: Kun Liang, PhD, Associate Professor, research interests: non-detection and traceability of agricultural products, Email: lkbb2006@ 126.com; Lingling Zhang, undergraduate, research interests: non-detection and traceability of agricultural products, Email: [email protected]; Xiaohe Chen, MS, research interests: non-detection and traceability of agricultural products, Email: [email protected].
*Corresponding author: Mingxia Shen, PhD, Professor, research interests: intelligent measurement and control, No. 40, Dianjiangtai Road, Pukou District, Nanjing 210031, China. Tel: +86-25-58606502, Email: mingxia@ njau.edu.cn.
traced after blending events occurred at grain-handling facilities. The advantages of using food-grade tracers for grain traceability are that they are safe, do not have to be removed from the grain prior to consumption and are low cost compared with conventional labelling techniques, e.g., RFID-based technology[6].
the tracers and printed codes. Optimization of the coating process conditions enables improvement of the performance of grain tracers. Therefore, the objective of this study was to determine the effects of the coating process parameters (coating weight gain, spray rate and tablet bed temperature) on the mechanical characteristics of food-grade grain tracers using the Box–Behnken design (BBD) of response surface methodology (RSM).
2 Materials and methods
2.1 Materials
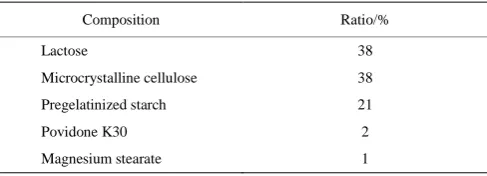
The tracers were produced by wet granulation. The granules used to create the compact tracer were composed of lactose, microcrystalline cellulose, pregelatinized starch, povidone K30 and magnesium stearate. Hydroxypropyl methyl cellulose (HPMC) was used as the coating material. All of the powders were obtained from Anhui Sunhere Pharmaceutical Excipients Co. Ltd. 2.2 Tracer production
The lactose, microcrystalline cellulose and pregelatinized starch were added to a mixer (GSH-250, Jiangyin Hongda Powder Equipment Co. Ltd., Wuxi, China) using the ratios presented in Table 1, thoroughly mixed for 30 min. A swing granulator (YK-90B, Tiantai Pharmaceutical Machinery Factory, Taizhou, China) with a 20-mesh sieve was used for the wet granulation after the addition of 7% povidone K30 aqueous solution. The wet granules were collected and dried for 30 min at 80°C in a high-efficiency fluid bed dryer (GFG-120, Changzhou Fanqun Drying Equipment Co. Ltd., Changzhou, China), and the dried masses were mixed with magnesium stearate for 3 min and forced through a 18-mesh vibrating sieve (S49-1000, Xinxiang Gaofu Sieving Machinery Co. Ltd., Xinxiang, China). The moisture content of the granules was controlled in the range of 3%-5%.
Table 1 Equationtion of the tracer granules
Composition Ratio/%
Lactose 38
Microcrystalline cellulose 38
Pregelatinized starch 21
Povidone K30 2
Magnesium stearate 1
Tracer compaction was performed using a rotary tablet press (ZP-5B, Shanghai Tianfan Machinery Factory, Shanghai, China). To maintain similar pressure values, a tablet hardness tester (YD-1, Jingtuo Instrument Science and Technology Ltd., Tianjin, China) was used to test the hardness of the tracers, and an electronic balance (LQ-A 6002, Ruian Ante Weighing Equipment Co. Ltd., Wenzhou, China) was used to weigh the tracers every 5 min. According to a previous tracer production study, the tracer hardness should be in the range of 10.5-11.5 kgf to ensure good performance. The tracers were pressed into round particles with a diameter of 11 mm and thickness of 5 mm. The tracer quantity was approximately 0.45 g.
2.3 Tracer coating
The aqueous coating solution was freshly prepared by mixing HPMC powder with distilled water at ambient temperature for 45 min. The solid concentration of the coating solution was fixed at 8%, and the applied amount of HPMC was 1.5 times greater than the theoretical coating weight gain due to equipment loss.
The tracers were film-coated using a high-efficiency coater (Labcoating III, Shenzhen Xinyite Science and Technology Co. Ltd., Shenzhen, China). Each coating batch consisted of 1000 g
of tracers. The gun-to-table distance was 15 cm, and the coating pot and horizontal inclination angle was 45°. The spray gun was a general pin type. The pan speed was 1200 r/min, the atomising air pressure was 100 kPa, air flow rate was 55 L/s and inlet air temperature was 60°C. After coating, the coating pan speed was adjusted to 2 r/min and hot air was applied for drying for 20 min. Then, the coated grain tracers were cooled for 10 min prior to removal.
2.4 Tracer characterization test after coating 2.4.1 Coating appearance quality
The coating quality was visually inspected based on the appearance of the coated tracers. For each batch, 100 tracer samples were examined for coating defects such as picking, sticking, core exposure, edge chipping or twinning. The percentage of tracers without visible coating defects was used to assess the quality of the coating appearance.
2.4.2 Moisture absorption rate
The moisture resistance was tested by measuring the weight gain of the coated tracer due to moisture absorption using an electronic balance (BT125D, Sartorius Group, Germany). Ten tracers were stored at 25°C, 60% RH for 24 h in a humidity chamber (HWS-100, Ningbo Jiangnan Instrument Factory, Ningbo, China). The moisture absorption rate was calculated by Equation (1):
2 1
2 1
100%
W W
Y W
(1)
where, Y2 is the moisture absorption rate and W1 and W2 are the
weights before and after moisture absorption, respectively. 2.4.3 Friction coefficient
To study the effect of the coating process on the frictional characteristics of the tracers, a coefficient of friction tester (MXD-01, Labthink Instruments Co. Ltd., Jinan, China) was used to measure the dynamic friction coefficients between the tracers and wheat based on the study of Yang et al., on the frictional characteristics of millet grain[11,12]. A single wheat grain layer was uniformly fixed on one side of a double-sided foam adhesive and the other side was fixed on the test bench of the friction coefficient meter. Three tracers were placed in the grooves of a custom slider, which was placed on the test bench. During the test, the wheat grain layer was in contact with the tracers for 15 s, and a traction device was used to uniformly slide the slider over the wheat layer at 100 mm/min.
2.4.4 Peak shear force
To determine the compression characteristics, shear measurements were performed using a texture analyser (TMS-PRO, Food Technology Corporation, USA) with a 1000 N load cell. A single-blade shear cell was used to evaluate the shear force of the samples. The tracer was sheared at a speed of 30 mm/min after reaching a trigger force of 0.5 N. Using the obtained force-distance curves, the peak shear force was expressed as the shear force of the peak point. For each treatment, twenty tracers were randomly selected, and the average values are reported according to the American Society of Agricultural Engineers (ASAE) standard (2008)[13].
2.4.5 Breaking rate
2.4.6 Barcode recognition rate
The tracers were marked with a barcode for traceability in practical applications. The QR code contained information about the wheat variety, wheat grade, production date and origin and was printed on the surface of 100 tracer samples by an inkjet printer (TN-600, Beijing Tainuo Hengchuang Technology Development Co. Ltd., Beijing, China) with a green, edible ink (TJHL, EightDegree Chemical Co., Ltd., Shanghai, China) (Figure 1). A barcode scanner (M210-235, Shanghai Chinyan Automation Technology Co. Ltd., Shanghai, China) was used to scan and identify the barcodes on the tracers. The percentage of successfully identified tracers was used as the barcode recognition rate.
Figure 1 Example of a barcode printed on the tracer surface 2.4.7 Transport wear rate and recognition rate
A mechanical spring fatigue testing machine (TPJ-20T1, Jinan Shidai Shijin Testing Machine Group Co. Ltd., Jinan, China) was used as a test bench to simulate transport of the tracers in a grain truck. Ten tracer samples were mixed with 3 kg of wheat and vibrated in a box on the test bench for 30 min. Since the actual frequency experienced in a truck generally ranges from 7.5 to 13 Hz[14], the vibration frequency was set at 8 Hz. After the vibration period, the tracers were separated from the wheat and identified by a barcode scanner. The percentage of successfully identified tracers was used as the transport recognition rate, and the transport wear rate was calculated by Equation (2).
1 2
7 1
100%
M M
Y M
(2)
where, Y7 is the transport wear rate, and M1 and M2 are the weights
of the tracers before and after vibration in the mechanical spring fatigue testing machine, respectively.
2.5 Experimental design
Tracers can be damaged during practical applications. The film-coating process affects the tracer performance. The process can improve the visual appearance of tracers, enhance their stability against moisture[15,16], maintain the shape and protect the codes on the surfaces of tracers[5]. The coating quality and performance are
sensitive to the process conditions such as the coating weight gain, coating solution spray rate and tablet bed temperature[17,18]. Optimizing the coating process parameters could result in tracers with good physical and mechanical properties.
The effects of three independent variables (the coating weight gain, spray rate and tablet bed temperature) on the characteristics of
the tracers were studied as variables coded as X1, X2 and X3,
respectively. The response variables determined for process optimization included the coating appearance quality (Y1), moisture
absorption rate (Y2), friction coefficient (Y3), peak shear force (Y4),
breaking rate (Y5), barcode recognition rate (Y6), transport wear rate
(Y7) and transport recognition rate (Y8).
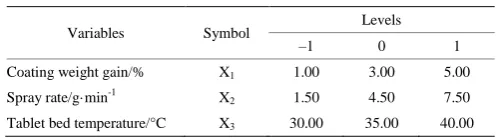
Response surface methodology (RSM) with a Box-Behnken design (BBD) was used to design the experimental trials. Design-Expert package version 8.0.6 (Stat-Ease Inc., Minneapolis, MN, USA) was used to conduct the experimental design and optimization. Seventeen experiments were performed. The range and levels of the coded and actual values of the independent variables are listed in Table 2. The BBD data were modelled by multiple regressions and fit with the following second-order polynomial equation:
1 2
0 1 1 1 1
k j k k
i i ij i j ii i
i i j i
Yβ
β X
β X X
β X ε (3) where, Y is the response, β0, βi, βii and βij are constant, linear term,quadratic term and interaction term, respectively; is random error, and Xiand Xj are the coded independent variables.
Table 2 Experimental codes and levels of the independent variables
Variables Symbol Levels
–1 0 1
Coating weight gain/% X1 1.00 3.00 5.00
Spray rate/g·min-1 X2 1.50 4.50 7.50
Tablet bed temperature/°C X3 30.00 35.00 40.00
3 Results and discussion
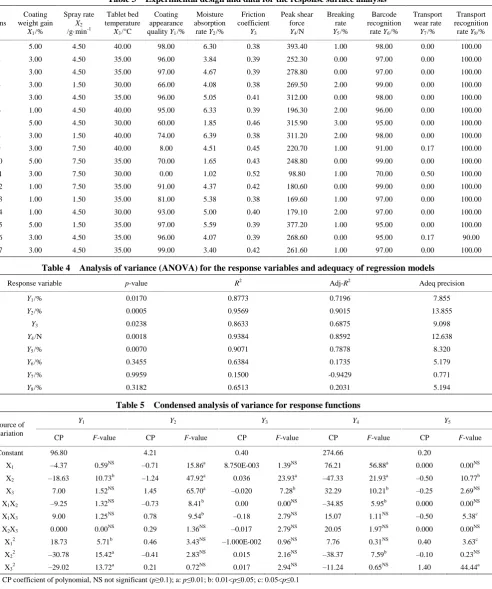
The coating process parameters were optimized based on a BBD design and 17 experimental runs were performed with different combinations of different levels of the 3 variables. The results of the experimental runs are shown in Table 3. Using the experimental data, the quadratic polynomial models of various responses were fitted (Table 4), and a regression analysis was conducted using the Design-Expert software. The p-values, coefficients of determination (R2), adjusted R2 values and adequate
precisions of the various response values are shown in Table 5. The results show that all the models were significant, with p-values less than 0.05, except for the Y6, Y7 and Y8 models. As a statistical
parameter, the R2 value is used to measure how well the regression approximates the real data points and, hence, is a strong indication of how well the model fits. The R2 values for the first five prediction models were greater than 0.8, which indicated that more than 80% of the variation in the output response could be successfully interpreted by the second order quadratic model. Therefore, the experimental values could be represented by the prediction models. Adeq precision is the ratio of signal to noise, which should be greater than 4. The adequate precisions of these models were greater than 4, except for the Y7 model, as shown in
the table, indicating that all the models were adequate except for model Y7. The models for the barcode recognition rate (Y6),
transport wear rate (Y7) and transport recognition rate (Y8) were not
significant and had p-values greater than 0.05 and R2 values less
than 0.7. The value for the Y6, Y7 and Y8 models indicated that the
Table 3 Experimental design and data for the response surface analysis
Runs
Coating weight gain
X1/%
Spray rate X2
/g·min-1
Tablet bed temperature
X3/°C
Coating appearance quality Y1/%
Moisture absorption
rate Y2/%
Friction coefficient
Y3
Peak shear force Y4/N
Breaking rate Y5/%
Barcode recognition
rate Y6/%
Transport wear rate
Y7/%
Transport recognition
rate Y8/%
1 5.00 4.50 40.00 98.00 6.30 0.38 393.40 1.00 98.00 0.00 100.00
2 3.00 4.50 35.00 96.00 3.84 0.39 252.30 0.00 97.00 0.00 100.00
3 3.00 4.50 35.00 97.00 4.67 0.39 278.80 0.00 97.00 0.00 100.00
4 3.00 1.50 30.00 66.00 4.08 0.38 269.50 2.00 99.00 0.00 100.00
5 3.00 4.50 35.00 96.00 5.05 0.41 312.00 0.00 98.00 0.00 100.00
6 1.00 4.50 40.00 95.00 6.33 0.39 196.30 2.00 96.00 0.00 100.00
7 5.00 4.50 30.00 60.00 1.85 0.46 315.90 3.00 95.00 0.00 100.00
8 3.00 1.50 40.00 74.00 6.39 0.38 311.20 2.00 98.00 0.00 100.00
9 3.00 7.50 40.00 8.00 4.51 0.45 220.70 1.00 91.00 0.17 100.00
10 5.00 7.50 35.00 70.00 1.65 0.43 248.80 0.00 99.00 0.00 100.00
11 3.00 7.50 30.00 0.00 1.02 0.52 98.80 1.00 70.00 0.50 100.00
12 1.00 7.50 35.00 91.00 4.37 0.42 180.60 0.00 99.00 0.00 100.00
13 1.00 1.50 35.00 81.00 5.38 0.38 169.60 1.00 97.00 0.00 100.00
14 1.00 4.50 30.00 93.00 5.00 0.40 179.10 2.00 97.00 0.00 100.00
15 5.00 1.50 35.00 97.00 5.59 0.39 377.20 1.00 95.00 0.00 100.00
16 3.00 4.50 35.00 96.00 4.07 0.39 268.60 0.00 95.00 0.17 90.00
17 3.00 4.50 35.00 99.00 3.40 0.42 261.60 1.00 97.00 0.00 100.00
Table 4 Analysis of variance (ANOVA) for the response variables and adequacy of regression models
Response variable p-value R2 Adj-R2 Adeq precision
Y1/% 0.0170 0.8773 0.7196 7.855
Y2/% 0.0005 0.9569 0.9015 13.855
Y3 0.0238 0.8633 0.6875 9.098
Y4/N 0.0018 0.9384 0.8592 12.638
Y5/% 0.0070 0.9071 0.7878 8.320
Y6/% 0.3455 0.6384 0.1735 5.179
Y7/% 0.9959 0.1500 -0.9429 0.771
Y8/% 0.3182 0.6513 0.2031 5.194
Table 5 Condensed analysis of variance for response functions
Source of variation
Y1 Y2 Y3 Y4 Y5
CP F-value CP F-value CP F-value CP F-value CP F-value
Constant 96.80 4.21 0.40 274.66 0.20
X1 –4.37 0.59NS –0.71 15.86a 8.750E-003 1.39NS 76.21 56.88a 0.000 0.00NS
X2 –18.63 10.73b –1.24 47.92a 0.036 23.93a –47.33 21.93a –0.50 10.77b
X3 7.00 1.52NS 1.45 65.70a –0.020 7.28b 32.29 10.21b –0.25 2.69NS
X1X2 –9.25 1.32NS –0.73 8.41b 0.00 0.00NS –34.85 5.95b 0.000 0.00NS
X1X3 9.00 1.25NS 0.78 9.54b –0.18 2.79NS 15.07 1.11NS –0.50 5.38c
X2X3 0.000 0.00NS 0.29 1.36NS –0.017 2.79NS 20.05 1.97NS 0.000 0.00NS
X12 18.73 5.71b 0.46 3.43NS –1.000E-002 0.96NS 7.76 0.31NS 0.40 3.63c
X22 –30.78 15.42a –0.41 2.83NS 0.015 2.16NS –38.37 7.59b –0.10 0.23NS
X32 –29.02 13.72a 0.21 0.72NS 0.017 2.94NS –11.24 0.65NS 1.40 44.44a
Note: CP coefficient of polynomial, NS not significant (p≥0.1); a: p≤0.01; b: 0.01<p≤0.05; c: 0.05<p≤0.1 3.1 Coating appearance quality
The regression equation obtained for coating appearance quality (Y1) was as follows:
1 1 2 3
-16
1 2 1 3 2 3
2 2 2
1 2 3
1293.35000 54.83750 29.19167 79.97000
1.54167 0.90000 8.28967 10
4.68125 3.41944 1.16100
Y X X X
X X X X X X
X X X
(4)
The fit model of the coating appearance quality was significant (p<0.05) (Table 3). The adequate precision of the model was greater than 4, indicating that the model was adequate. The significance of the coefficients of the fitted model (Equation (4))
was evaluated, as shown in Table 4. The coating appearance quality was significantly dependent on the quadratic effect of the spray rate (X2) and the quadratic effect of the tablet bed
temperature (X3). The linear effect of the coating weight gain (X1)
was slightly significant, as well as the quadratic effect of the coating weight gain (X1).
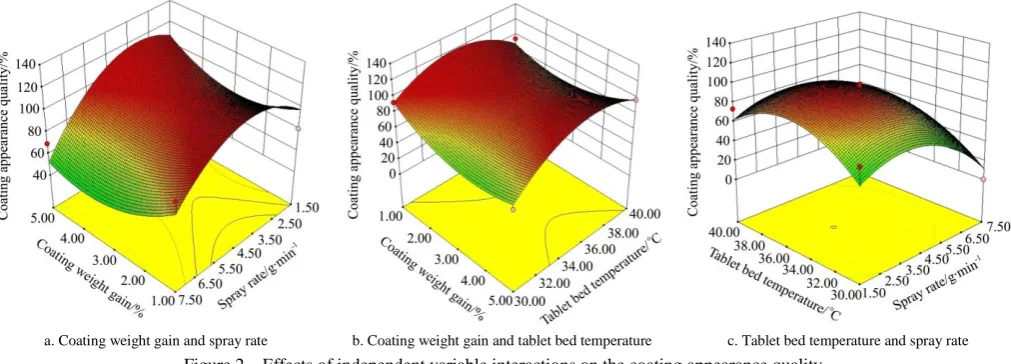
while maintaining the tablet bed temperature at its central value (35°C) is represented in Figure 2a. The figure shows that as the coating weight gain increased, the coating appearance quality initially decreased and then tended to increase. In contrast, the coating appearance quality increased during the initial period and then decreased as the spray rate increased. This may occur because a higher spray rate results in larger droplet sizes[19], therefore, the tablet film is more complete and the coating appearance quality increases. However, an excessive spray rate can result in coating defects such as sticking[18] and reduction of the coating appearance quality of tracers. The interaction of the coating weight gain (range of 1.00%-5.00%) and the tablet bed temperature (30°C-40°C) while maintaining the spray rate at its central value (4.5 g/min) is represented in Figure 2b. Figure 2b shows that as the coating weight gain increased, the coating appearance quality gradually decreased before increasing. Figure 2b also shows that as the tablet bed temperature increased,
the coating appearance quality gradually increased and then decreased. This may occur because a higher temperature causes the tablets to dry more quickly[20], which can avoid manufacturing problems such as sticking and picking[21].
However, too rapid drying causes other defects such as a heterogeneous tablet filmand reduction of the coating appearance quality[21]. The interaction of the tablet bed temperature (30°C- 40°C) and the spray rate (1.5-7.5 g/min) while maintaining the coating weight gain at its central value (3%) is presented in Figure 2c. Figure 2c shows that the interaction effect was not significant and the optimum tablet bed temperature and spray rate were 35°C and 5.5 g/min, respectively. The coating appearance quality initially increased as the spray rate and tablet bed temperature increased and then began to decrease. A spray rate of 5.5 g/min yielded slightly more homogeneous results and the grain tracers tended to dry more quickly and avoid sticking and picking at the tablet bed temperature of 35°C.
a. Coating weight gain and spray rate b. Coating weight gain and tablet bed temperature c. Tablet bed temperature and spray rate Figure 2 Effects of independent variable interactions on the coating appearance quality
3.2 Moisture absorption rate
The regression equation for the moisture absorption rate (Y2)
was as follows:
2 1 2 3
1 2 1 3 2 3
2 2 3 2
1 2 3
16 93175 3 21987 0 31992 0 61610
0 12208 0 078000 0 019667
0 11394 0 046028 8 33000 10
Y + . . X . X . X
. X X + . X X . X X
+ . X . X . X
(5)
As shown in Table 4, the p-value of the quadratic polynomial model for the moisture absorption rate was 0.005 (p<0.01), implying a very significant result. The R2 (0.9569) was in close agreement with the adjusted R2 (0.9015), which suggested that the experimental results were in reasonable agreement with the theoretical values predicted by the proposed model. The coating weight gain (X1), spray rate (X2) and tablet bed temperature (X3)
exerted significantly linear effects on the moisture absorption rate (p<0.01). The interaction term between the coating weight gain (X1) and spray rate (X2) was significant (p<0.05), as well as the
interaction term between the coating weight gain (X1) and tablet
bed temperature (X3).
The response surface 3D plots shown in Figure 3 illustrate the effects of interactions between two factors on the moisture absorption rate when the other parameters were held constant at their central levels. Figure 3a shows the combined effect of coating weight gain (range of 1.00%-5.00%) and spray rate (1.5- 7.5 g/min) on the moisture absorption rate of grain tracers at a constant tablet bed temperature (35°C). The interaction effect of the coating weight gain and spray rate on the moisture absorption rate was significant. The moisture absorption rate firstly
was below 3%, the moisture absorption rate increased slowly as the tablet bed temperature increased. The lowest moisture absorption rate was obtained at the coating weight gain of 5% and tablet bed temperature of 30°C, and grain tracers showed good moisture-proof performance under these conditions. Figure 3c shows the combined effect of tablet bed temperature (30°C-40°C) and spray rate (1.5-7.5 g/min) on the moisture absorption rate of grain tracers at a constant coating weight gain (3%). Figure 3c
shows that the moisture absorption rate decreased as the spray rate increased and the tablet bed temperature decreased. Dohi et al.[23] observed that tablet films tend to thicken with a low inlet temperature and high spray rate, decreasing the moisture absorption rate. The lowest moisture absorption rate was obtained at the spray rate of 7.5 g/min and tablet bed temperature of 30°C, and grain tracers showed a good moisture-proof performance under these conditions.
a. Spray rate and coating weight gain b. Coating weight gain and tablet bed temperature c. Spray rate and tablet bed temperature Figure 3 Effects of independent variable interactions on the moisture absorption rate
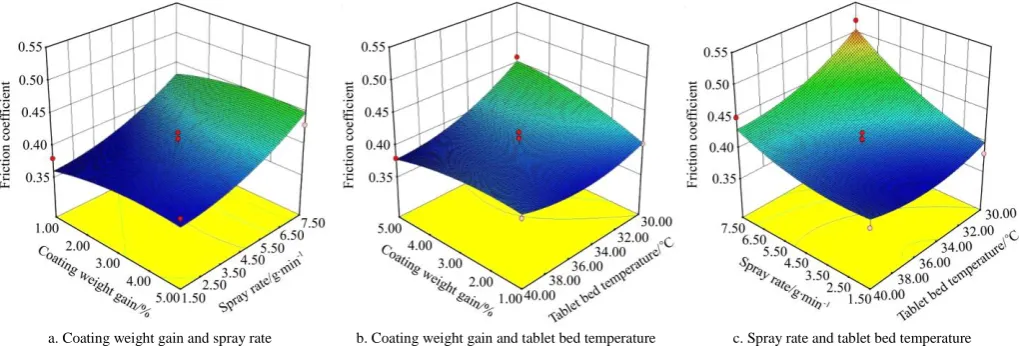
3.3 Friction coefficient
The regression equation was generated to relate the friction coefficient to actual levels of the independent variables:
3 1 2 3
18 3 3
1 2 1 3 2 3
3 2 3 2 4 2
1 2 3
0 97375 0 080625 0 037917 0 042500
7 51714 10 1 75000 10 1 16667 10
2 50000 10 1 66667 10 7 00000 10
Y + . + . X + . X . X
. X X . X X . X X
. X + . X + . X
(6) The fitted model of the friction coefficient was significant (p<0.05). The adequate precision of the model was also greater than 4, indicating that the model was adequate. The significance of coefficients of the fitted model (Equation (6)) was evaluated, as shown in Table 4. The friction coefficient was significantly dependent on the linear terms of the spray rate (X2) and tablet bed
temperature (X3), with coefficients of 23.93 and 7.28, respectively.
The response surface 3D plots shown in Figure 4 illustrate the effects of the interactions between two factors on the friction coefficient when the other parameters were held constant at their central levels. Figure 4a shows the effects of the spray rate and coating weight gain on the friction coefficient. The coating weight gain did not significantly influence the friction coefficient.
The friction coefficient slightly increased as the coating weight gain increased. One explanation is that the surface roughness of the tablets increased as the coating weight gain increased, as observed in other studies on tablet film coatings[24,25]. The friction coefficient increased as the spray rate increased because the droplet sizes increase as the spray rate increases, and the drops cannot fully dry in a short time, leading to high surface roughness and a large friction coefficient[26]. Figure 4b shows the effects of the tablet bed temperature and coating weight gain on the friction coefficient. Figure 4b shows that as the coating weight gain increased, the friction coefficient gradually increased when the tablet bed temperature varied from 30.00°C to 35.00°C. But the friction coefficient tended to decrease when the temperature was higher than 35.00°C. In addition, the friction coefficient had a significant negative correlation with the tablet bed temperature and decreased as the tablet bed temperature increased, especially for high coating weight gain. Figure 4c shows the effects of the tablet bed temperature and spray rate on the friction coefficient. The friction coefficient increased as the spray rate increased and the tablet bed temperature decreased, as shown in Figure 4c. The friction coefficient increased sharply as the tablet bed temperature
increased when the spray rate ranged from 4.5 to 7.5 g/min. In addition, the tablet bed temperature did not affect the friction coefficient significantly at spray rates of 1.5-4.5 g/min. However, when the spray rate exceeded 4.5 g/min, the friction coefficient increased as the tablet bed temperature decreased. A low spray rate and high tablet bed temperature are beneficial for a low friction coefficient.
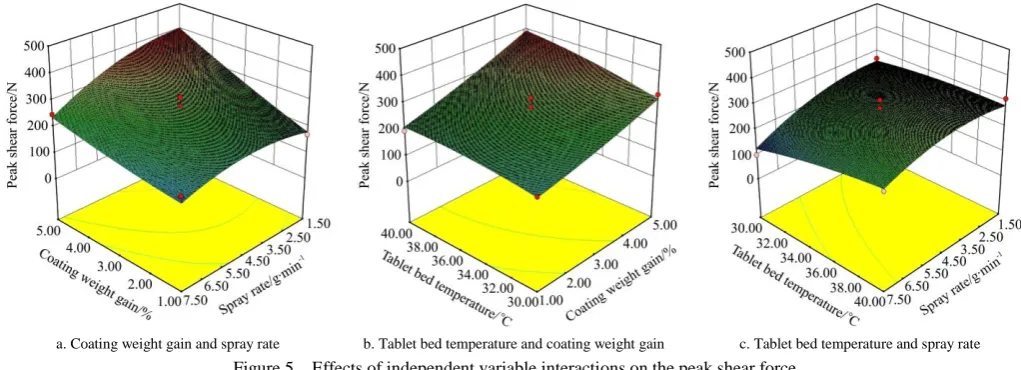
3.4 Peak shear force
The regression equation fitted for the peak shear force (Y4) was
as follows:
4 1 2 3
1 2 1 3 2 3
2 2 2
1 2 3
324 03875 0 15500 6 76583 27 39900
5 80833 1 50750 1 33667
1 93938 4 26306 0 44970
Y . . X . X + . X
. X X + . X X + . X X
+ . X . X . X
(7)
The model p-value of 0.0018 implies that the model is significant. The regression model for the peak shear force showed a high coefficient of determination (R2=0.9384). In this case, the coating weight gain (X1), spray rate (X2) are significant model
terms (p<0.01), and the tablet bed temperature (X3), the interaction
term between the coating weight gain (X1) and spray rate (X2), and
the quadratic effect of the spray rate (X22) were significant
(p<0.05).
The response surface 3D plots shown in Figure 5 illustrate the effects of interactions between any two factors on the peak shear force when the other parameters were held constant at their central levels. Figure 5a shows the effects of the coating weight gain and spray rate on the peak shear force. The figure shows that the effect of the coating weight gain and spray rate on the peak shear
force was significant. An increase in the coating weight gain generally resulted in an increase in the peak shear force, perhaps because increased coating material and coating thickness result in greater shear strength. As the spray rate increased, the peak shear force increased and then decreased when the coating weight gain was less than 3.00% and decreased when the coating weight gain exceeded 3.00%, perhaps due to increased coating material by increasing the spray rate within a certain range. However, the peak shear force decreased, possibly due to uneven distribution of the coating materials on the grain tracer surface when the spray rate exceeded a certain range. Figure 5b illustrates the effects of the coating weight gain and tablet bed temperature on the peak shear force. The figure shows that the peak shear force increased as the coating weight gain and tablet bed temperature increased. The highest peak shear force was obtained with the highest coating weight gain (5.00%) and tablet bed temperature (40.00°C). One explanation is that the higher coating weight gain and tablet bed temperature could result in higher grain tracer hardness. The effects of the tablet bed temperature and spray rate on the peak shear force are presented in Figure 5c. Figure 5c shows that the peak shear force decreased as the spray rate increased and increased slowly as the tablet bed temperature increased. When the spray rate was increased from 4.5 g/min to 7.5 g/min, the peak shear force decreased. However, when the spray rate was below 4.5 g/min, the peak shear force exhibited no obvious change as the spray rate increased. The results show that a spray rate greater than 4.5 g/min results in good mechanical properties of the grain tracers.
a. Coating weight gain and spray rate b. Tablet bed temperature and coating weight gain c. Tablet bed temperature and spray rate Figure 5 Effects of independent variable interactions on the peak shear force
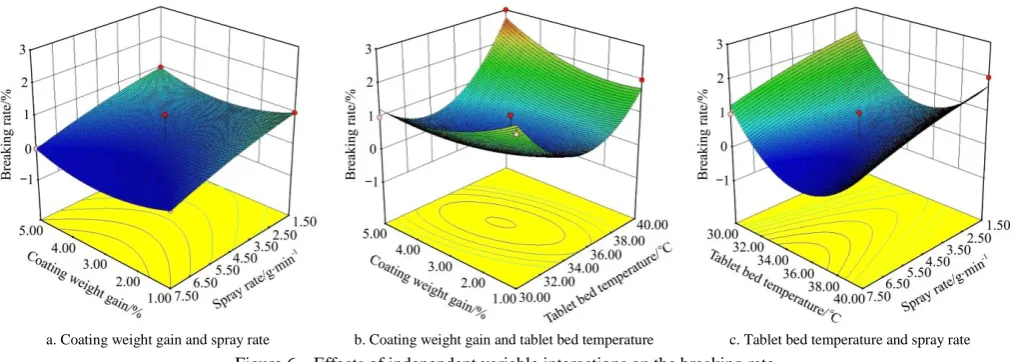
3.5 Breaking rate
The regression equation fitted for the breaking rate (Y5) was as
follows:
5 1 2 3
17 16
1 2 1 3 2 3
2 2 2
1 2 3
66 72500 1 15000 0 066667 3 82000
8 32667 10 0 050000 2 14643 10
0 100000 0 011111 0 056000
-
-Y + . + . X . X . X
. X X - . X X . X X
+ . X . X + . X
(8) The model p-value of 0.007 implies that the model is significant. The regression model for the breaking rate showed a high coefficient of determination (R2=0.9071). The breaking rate was significantly dependent on the quadratic effect of the tablet bed temperature (X3
2
) (p<0.01). The linear effect of the spray rate (X2)
was significant (p<0.05).
The response surface 3D plots shown in Figure 6 illustrate the effects of interactions between two factors on the breaking rate
rate initially decreased with increasing tablet bed temperature because the increase in the tablet bed temperature results in effective coating material film formation. However, when the tablet bed temperature increased above 35.00°C, the breaking rate increased, which may be due to evaporative loss of the coating material. Figure 6c shows the effects of the spray rate and tablet bed temperature on the breaking rate. The breaking rate was negatively correlated with the spray rate and decreased as the spray
rate increased, as shown in Figure 6c. A decrease in the breaking rate was observed for tablet bed temperatures up to approximately 35.00°C, but the rate increased as the tablet bed temperature increased above 35.00°C. The reason is similar to that for the results in Figure 6a and Figure 6b. The breaking rate deceased as the spray rate increased. The increased coating material by increasing the spray rate can improve the physical strength of grain tracers, thus decrease the breaking rate.
a. Coating weight gain and spray rate b. Coating weight gain and tablet bed temperature c. Tablet bed temperature and spray rate Figure 6 Effects of independent variable interactions on the breaking rate
3.6 Optimization and validation of the models
The optimum conditions for the coating process were determined to obtain the maximum coating appearance quality and peak shear force and the minimum moisture absorption rate, friction coefficient and breaking rate. The quadratic polynomial models obtained in this study for each response were utilized to determine the optimal conditions. The Design-Expert software indicated that the optimized parameters were a coating weight gain of 5.00%, spray rate of 5.47 g/min and tablet bed temperature of 35.42°C. Under this condition, a coating appearance quality of 100.00%, moisture absorption rate of 3.46%, friction coefficient of 0.41, peak shear force of 332.36 N and breaking rate of 0.37% were obtained.
Three replicate experiments were performed under the optimal conditions to confirm the prediction. The predicted and experimental values are presented in Table 6. The results show that the experimental values were close to the predicted values, which indicates the adequacy of the models. These models can be used as references for future tracer production studies and applications.
Table 6 Predicted and experimental values for the response variables under the optimum conditions
Response variable Predicted value Experimental value Coating appearance quality/% 100.00 97.333.77 Moisture absorption rate/% 3.46 3.380.19 Friction coefficient 0.41 0.400.02 Peak shear force/N 332.36 405.1760.70
Breaking rate/% 0.37 0.000.00
4 Conclusions
In this study, the relationship between the coating process parameters (coating weight gain, spray rate and tablet bed temperature) and the physical, mechanical and practical characteristics of food-grade tracers was investigated using a Box–Behnken (BB) design. Eight regression models were
established for the coating appearance quality, moisture absorption rate, friction coefficient, peak shear force, breaking rate, barcode recognition rate, transport wear rate and transport recognition rate responses. The ANOVA results revealed that the models were significant except for the barcode recognition rate, transport wear rate and transport recognition rate models. The barcode recognition and transport recognition rates were extremely high and the transport wear rate was very low after a qualified coating process. The comprehensive optimum conditions obtained from the five well-fitted second-order polynomial models were a coating weight gain of 5.00%, spray rate of 5.47 g/min and tablet bed temperature of 35.42°C. The experimental values for the coating appearance quality, moisture absorption rate, friction coefficient, peak shear force and breaking rate under the optimized conditions were close to the predicted values, confirmed the validity of the models. These models may provide a basis for further research on food-grade tracers and their applications. As an information identification technology, grain tracers are low-cost, environmentally adaptable and easily applied in grain supply chains. Optimization of tracer coating processing processes can enhance the physical and mechanical properties to avoid damage to the tracers and printed codes and maximize readability and ruggedness.
Acknowledgements
The authors gratefully acknowledge the support of the National Natural Science Foundation of China (31401610), the Fundamental Research Funds for the Central Universities of China (KJON201557), the Outstanding Youth Foundation Science and Technology Fund of College of Engineering at Nanjing Agricultural University (YQ201603), and the Jiangsu Agriculture Science and Technology Innovation Fund (CX(17)1103).
[References]
[1] Thakur M, Hurburgh C R. Framework for implementing traceability system in the bulk grain supply chain. Journal of Food Engineering, 2009; 95(4): 617–626
in the U.S. Food supply: Economic theory and industry studies. Agricultural Economics Reports, USDA/Economic Research Service/AER-830, 2004. http://agris.fao.org/agris-search/search.do? recordID=US2015201182
[3] Comba L, Belforte G, Dabbene F, Gay P. Methods for traceability in food production processes involving bulk products. Biosystems Engineering, 2013; 116(1): 51–63.
[4] Sui R X, Thomasson J A, Herrman T. Development of tracers for grain tracing system. ASABE Annual International Meeting, 2007.
[5] Lee K M, Armstrong P R, Thomasson J A, Sui R X, Casada M, Herrman T J. Application of binomial and multinomial probability statistics to the sampling design process of a global grain tracing and recall system. Food Control, 2011; 22(7): 1085–1094.
[6] Liang K, Zhang L L, Lu W, Cedric S O, Shen M X. Optimization of compression equation and load of food-grade tracers for grain traceability using central composite design. Int J Agric & Biol Eng, 2017; 10(6): 221–230.
[7] Sui R, Thomasson J A, Herrman T. Development of tracers for grain tracing system. ASABE Annual International Meeting, Minneapolis, Minnesota, 2007. http://elibrary.asabe.org/ abstract.asp?aid=23405 [8] Lee K M, Armstrong P R, Thomasson J A, Sui R X, Casada M, Herrman T
J. Development and characterization of food-grade tracers for the global grain tracing and recall system. Journal of Agricultural and Food Chemistry, 2010; 58(20): 10945–10957.
[9] Liang K, Thomasson J A, Lee K M, Shen M X, Ge Y, Herrman T J. Printing data matrix code on food-grade tracers for grain traceability. Biosystems Engineering, 2012; 113(4): 395–401.
[10] Liang K, Thomasson J A, Shen M X, Armstrong P R, Ge Y, Lee K M, Herrman T J. Ruggedness of 2D code printed on grain tracers for implementing a prospective grain traceability system to the bulk grain delivery system. Food Control, 2013; 33(2): 359–365.
[11] Yang Z M, Sun J X, Guo Y M. Effect of moisture content on compression mechanical properties and frictional characteristics of millet grain. Transactions of the CSAE, 2015; 31(23): 253–260.
[12] Yang Z M, Guo Y M, Cui Q L, Li H B. Test and influence factors analysis of friction characteristics of millet. Transactions of the CSAE, 2016; 32(16): 258–264. (in Chinese)
[13] ASAE Standard. Compression test of food materials of Convex Shape. ASAE S368.4 DEC2000, 2008. http://mireei.iut.ac.ir/sites/ mireei.iut.ac.ir/files/files_course/asae_standard.pdf
[14] Tabatabaekoloor R, Hashemi S J, Taghizade G. Vibration damage to kiwifruits during road transportation. International Journal of Agriculture
and Food Science Technology, 2013; 4(5): 467–474.
[15] Rohera B D, Parikh N H. Influence of plasticizer type and coat level on Surelease film properties. Pharmaceutical Development and Technology, 2002; 7(4): 407–420.
[16] Pearnchob N, Siepmann J, Bodmeier R. Pharmaceutical applications of shellac: moisture-protective and taste-masking coatings and extended-release matrix tablets. Drug Development and Industrial Pharmacy, 2003; 29(8): 925–938.
[17] Heinämäki J, Ruotsalainen M, Lehtola V M, Antikainen O, Yliruusi J. Optimization of aqueous-based film coating of tablets performed by a side-vented pan-coating system. Pharmaceutical Development and Technology, 1997; 2(4): 357–364.
[18] Pandey P, Bindra D S, Felton L A. Influence of process parameters on tablet bed microenvironmental factors during pan coating. Aaps Pharmscitech, 2014; 15(2): 296–305.
[19] Wang J, Hemenway J, Chen W, Desai D, Early W, Paruchuri S, et al. An evaluation of process parameters to improve coating efficiency of an active tablet film-coating process. International Journal of Pharmaceutics, 2012; 427(2): 163–169.
[20] Christodoulou C, Sorensen E, Mazzei L. Mathematical modelling of water absorption and evaporation in a pharmaceutical tablet during film coating. Chemical Engineering Science, 2017; 175: 40–55.
[21] Suzzi D, Radl S, Khinast J G. Local analysis of the tablet coating process: Impact of operation conditions on film quality. Chemical Engineering Science, 2010; 65(21): 5699–5715.
[22] Teckoe J, Mascaro T, Farrell T P, Rajabisiahboomi A R. Process Optimization of a Novel Immediate Release Film Coating System using QbD Principles. Aaps Pharmscitech, 2013; 14(2): 531–540.
[23] Dohi M, Momose W, Yoshino H, Hara Y, Yamashita K, Hakomori T, et al. Application of terahertz pulse imaging as PAT tool for non-destructive evaluation of film-coated tablets under different manufacturing conditions. Journal of Pharmaceutical and Biomedical Analysis, 2016; 119: 104–113. [24] Prater D A, Meakin B J, Rowe R C, Wilde J S. A technique for
investigating changes in the surface roughness of tablets during film coating. Journal of Pharmacy and Pharmacology, 1981; 33(10): 666–668. [25] Cahyadi C, Heng P W S, Lai W C. Optimization of process parameters for a quasi-continuous tablet coating system using design of experiments. Aaps Pharmscitech, 2011; 12(1): 119–131.