Biogeosciences, 7, 4059–4082, 2010 www.biogeosciences.net/7/4059/2010/ doi:10.5194/bg-7-4059-2010
© Author(s) 2010. CC Attribution 3.0 License.
Biogeosciences
A seasonal study of dissolved cobalt in the Ross Sea, Antarctica:
micronutrient behavior, absence of scavenging, and relationships
with Zn, Cd, and P
M. A. Saito1, T. J. Goepfert1, A. E. Noble1, E. M. Bertrand1, P. N. Sedwick2, and G. R. DiTullio3
1Marine Chemistry and Geochemistry Department, Woods Hole Oceanographic Institution, Woods Hole, MA 02543, USA 2Old Dominion University, Department of Ocean, Earth and Atmospheric Sciences, Norfolk, VA 23529, USA
3College of Charleston, Hollings Marine Laboratory, 331 Fort Johnson, Charleston, SC 29412, USA Received: 30 July 2010 – Published in Biogeosciences Discuss.: 25 August 2010
Revised: 1 December 2010 – Accepted: 9 December 2010 – Published: 22 December 2010
Abstract. We report the distribution of cobalt (Co) in the Ross Sea polynya during austral summer 2005–2006 and the following austral spring 2006. The vertical distribution of to-tal dissolved Co (dCo) was similar to soluble reactive phos-phate (PO3−4 ), with dCo and PO3−4 showing a significant cor-relation throughout the water column (r2= 0.87, 164 sam-ples). A strong seasonal signal for dCo was observed, with most spring samples having concentrations ranging from
∼45–85 pM, whereas summer dCo values were depleted be-low these levels by biological activity. Surface transect data from the summer cruise revealed concentrations at the low range of this seasonal variability (∼30 pM dCo), with con-centrations as low as 20 pM observed in some regions where PO3−4 was depleted to∼0.1 µM. Both complexed Co, defined as the fraction of dCo bound by strong organic ligands, and labile Co, defined as the fraction of dCo not bound by these ligands, were typically observed in significant concentrations throughout the water column. This contrasts the depletion of labile Co observed in the euphotic zone of other ocean regions, suggesting a much higher bioavailability for Co in the Ross Sea. An ecological stoichiometry of 37.6 µmol Co: mol−1 PO3−4 calculated from dissolved concentrations was similar to values observed in the subarctic Pacific, but ap-proximately tenfold lower than values in the Eastern Tropical Pacific and Equatorial Atlantic. The ecological stoichiome-tries for dissolved Co and Zn suggest a greater overall use of Zn relative to Co in the shallow waters of the Ross Sea, with a Co:PO3−4 /Zn:PO3−4 ratio of 1:17. Comparison of these
ob-Correspondence to: M. A. Saito
(msaito@whoi.edu)
1 Introduction
The Ross Sea is a region of considerable biological and geo-chemical interest due to its intense annual phytoplankton bloom and associated carbon export (Arrigo et al., 1998; Di-Tullio et al., 2000). The sea overlies a continental shelf adja-cent to the Antarctic continent and is mostly covered by sea ice in the austral winter. Seasonal melting forms the Ross Sea Polynya, which typically opens to the Southern Ocean in late summer. The seasonal phytoplankton bloom in the Ross Sea Polynya is the largest such feature in the Southern Ocean, and typically consists of an initial Phaeocystis antarctica bloom followed by mixed assemblages dominated by diatoms (DiT-ullio and Smith, 1996; Arrigo et al., 1999). This intense phy-toplankton bloom results in a substantial seasonal drawdown of macronutrients and CO2 within the polynya (Gordon et al., 2000; Smith et al., 2006). With the Antarctic continen-tal shelves being an important source of oceanic deep water formation (Orsi et al., 2002; Orsi and Wiederwohl, 2009), nutritional controls on primary productivity in the Ross Sea are an important influence on the Southern Ocean CO2sink (Marinov et al., 2006; Arrigo et al., 2008).
There have been a number of trace metal-phytoplankton studies in the Ross Sea (Martin et al., 1990; Capodaglio et al., 1998; Fitzwater et al., 2000; Sedwick et al., 2000; Coale et al., 2005; Corami et al., 2005; Grotti et al., 2005; Bertrand et al., 2007). The Ross Sea Polynya exhibits nutrient-like depletion of dissolved iron to low concentrations (∼0.1 nM) that has been shown to limit algal growth rates (Martin et al., 1990; Sedwick et al., 2000; Cochlan et al., 2002; Coale et al., 2003; Bertrand et al., 2007). Enhanced iron concentrations have been observed in proximity to melting sea ice and the sea floor, implicating these as important regional sources of dissolved iron (Sedwick and DiTullio, 1997; Fitzwater et al., 2000; Sedwick et al., 2000, 2011; Coale et al., 2005; Grotti et al., 2005). Zinc in the Ross Sea shows a seasonal drawdown, with a significant labile particulate fraction that allows recy-cling of Zn in the upper water column (Fitzwater et al., 2000; Coale et al., 2005). Two bottle incubation experiments in the Ross Sea have observed stimulatory zinc effects: in one instance a combined treatment of zinc and iron resulted in an increase of both chlorophyll and nitrate utilization rela-tive to the iron-only treatment, suggesrela-tive of secondary zinc limitation within phytoplankton communities (Cochlan et al., 2002). In another experiment, a zinc-only addition caused an increase in chlorophyll relative to the control treatment (Coale et al., 2003), suggestive of independent colimitation (Saito et al., 2008).
Cobalt measurements were included in a previous geo-chemical study of the Ross Sea (Fitzwater et al., 2000), yet there was little discussion of its geochemistry in that study. We recently documented colimitation of phytoplank-ton growth by iron and the cobalt-containing vitamin B12 biomolecule in the Ross Sea during early austral summer 2005 (Bertrand et al., 2007), similar to reports of B12
col-imitation of phytoplankton in other high latitude and coastal regions (Panzeca et al., 2006; Sa˜nudo-Wilhelmy et al., 2006; Gobler et al., 2007). The mechanism for this colimitation in the Ross Sea appears to be related to the source of B12: the capacity for B12biosynthesis is only present in some bacte-ria and archaea and is absent in all eukaryotic phytoplankton, while this vitamin is required by a majority of phytoplank-ton (Droop, 1974, 2007). The extent of the phytoplankphytoplank-ton iron-B12colimitation response was observed to be inversely related to bacterial abundances (Bertrand et al., 2007), con-sistent with the notion that the B12biosynthesizing commu-nity is at times inadequate to supply iron replete phytoplank-ton in these experiments. The Ross Sea may be particu-larly prone to B12 colimitation due to the absence of B12-producing cyanobacterial populations in polar waters and the low heterotrophic bacterial abundances in the Ross Sea dur-ing austral sprdur-ing (Ducklow et al., 2001), creatdur-ing a temporal lag between B12production and phytoplankton demand. Ad-ditions of inorganic cobalt did not stimulate growth in ship-board bioassay experiments (Bertrand et al., 2007), in con-trast to other tropical regions where iron-cobalt colimitation (or secondary limitation) has been observed (Martin et al., 1989; Saito et al., 2005, 2008). In addition, cobalt has been suggested to limit B12 biosynthesis and community growth in sea ice phytoplankton and microbial communities in the southern Ross Sea (Gordon and Sullivan, 2008).
Recent studies have found that micronutrient drawdown can be an important process in controlling the distribution of Co in ocean surface waters (Ellwood and van den Berg, 2001; Saito and Moffett, 2002; Saito et al., 2004, 2005; Ellwood et al., 2005; Noble et al., 2008). This contrasts with earlier views that characterized Co as controlled by scavenging re-moval processes (Whitfield and Turner, 1987; Nozaki, 1997). Elements such as Co, Fe, Cu, and (at high latitudes) Mn are considered hybrid-type metals, due to their oceanic distribu-tions being strongly affected by both micronutrient uptake and scavenging processes (Bruland and Lohan, 2003; Noble et al., 2008). In addition, organic ligands have been shown to bind Co very strongly and are believed to provide an im-portant control on Co biological availability as well as poten-tially protecting Co from scavenging in the ocean (Ellwood and van den Berg, 2001; Saito and Moffett, 2001; Saito et al., 2002, 2005, 2008; Ellwood et al., 2005). An experiment that compared Co enrichment incubations with and without the natural phytoplankton and microbial community demon-strated a biological origin of these cobalt ligands in the Costa Rica Dome region (Saito et al., 2005).
M. A. Saito et al.: A study of dissolved cobalt in the Ross Sea, Antarctica 4061 Such biochemical substitution, known as cambialism,
ap-pears to be an important adaptation to life in ocean surface waters where these micronutrients are often depleted (Saito et al., 2008). Physiological evidence of this Co-Zn substi-tution has been demonstrated in the Ross Sea phytoplankter
Phaeocystis antarctica (Saito and Goepfert, 2008). In
addi-tion, lowpCO2is known to cause several fold increases in the Cd:P ratio of particulate material in field experiments off the coast of California, likely due to upregulation of carbonic anhydrase enzymes (Lane and Morel, 2000; Cullen and Sher-rell, 2005). Co geochemistry is also tied to that of Mn, where it has been shown that Co can be co-oxidized by manganese-oxidizing bacteria, and this is likely a critical pathway for the scavenging removal of Co from seawater (Tebo et al., 1984; Moffett and Ho, 1996).
Here we report measurements of total dissolved cobalt and cobalt speciation from two cruises in the Ross Sea, in austral spring of 2006 and austral summer of 2005. Together these data provide information on the seasonal influences of sea-ice retreat and phytoplankton succession on the distribution and cycling of cobalt in these Antarctic shelf waters. This first detailed examination of cobalt biogeochemistry in the Ross Sea serves as a companion study to our previous work on iron-B12colimitation in this region (Bertrand et al., 2007).
2 Materials and methods
2.1 Cruise track
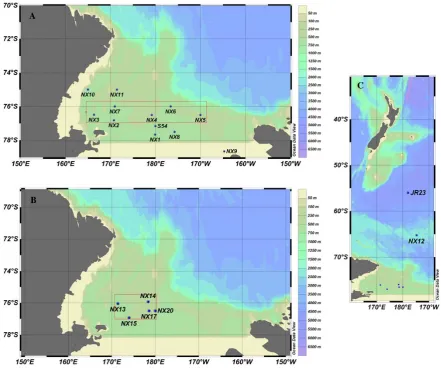
Samples were collected on two cruises aboard the icebreaker RVIB Nathaniel B. Palmer in the Ross Sea as part of the CORSACS program (Controls on Ross Sea Algal Commu-nity Structure; see www.whoi.edu/sites/corsacs). The first cruise (NBP0601, CORSACS-1) occurred in austral summer 2005–2006, sampling the Ross Sea from 27 December 2005 to 23 January 2006 (Fig. 1a); the second cruise (NBP0608, CORSACS-2) occurred in austral spring-early summer 2006, sampling the Ross Sea from 8 November 2006 to 3 Decem-ber 2006 (Fig. 1b), as well as in the Southern Ocean en route to and returning from the Ross Sea (Fig. 1c). The southern transect of CORSACS-1 entered the Bay of Whales (Station NX9), a natural indentation in the Ross Ice Shelf created by Roosevelt Island, which was the southernmost point reached by any ship at the time of our expedition.
2.2 Sampling methodologies
Seawater samples for trace metals analysis were collected us-ing either 5 L Teflon-coated external sprus-ing Niskin-X sam-plers (General Oceanics Inc., described as NX samples) or 2.5 L and 10 L Go-Flo samplers (General Oceanics Inc.). The Niskin-X and 10 L Go-Flo bottles were deployed on a non-metallic line (Spectra) and closed using solid PVC messen-gers, whereas the 2.5 L Go-Flo samplers were mounted on an 11-position rosette unit modified for trace metal sampling,
which was deployed on the Spectra line. The rosette unit was programmed to close the samplers at pre-determined times on the upcast, with the precise depth of sampler clo-sure determined using an integrated presclo-sure sensor. The NX vertical profiles typically consisted of samples obtained from 9 Niskin-X samplers and two additional 10 L Go-Flo samplers; two vertical profiles (Station 54 and JR23) were obtained using only the Go-Flo samplers. Upon recovery, seawater samples were filtered through either 0.2 µm Supor Acropak filter cartridges (Pall Corp., for NX samples) pre-rinsed with filtered surface seawater, or 0.4 µm 144 mm poly-carbonate membrane filters (GE, Osmonics, for Go-Flo sam-ples) pre-cleaned with hydrochloric acid and Milli-Q deion-ized water. Cobalt was also measured in samples from three surface transects during CORSACS-1, collected using a trace-metal clean towed fish sampler deployed at ∼3 m depth while underway at∼5 knots, with samples filtered us-ing in-line 0.2 µm Supor Acropak filters (Bruland, 2005). All sample bottles were washed by soaking in 1% citranox overnight, rinsing thoroughly with Milli-Q, soaking in 10% Instra-analyzed HCl (Baker, Inc.) for two weeks, followed by thorough Milli-Q rinsing and soaking with dilute (pH 2) Instra-analyzed HCl overnight. Bottles were rinsed with sea-water prior to filling, and samples were refrigerated in dark-ness until analysis.
2.3 Total dissolved cobalt analyses
1
B
[image:4.595.76.518.63.433.2]C A
Fig. 1. Geographic locations of trace metal sampling sites in the Ross Sea of Antarctica and the Southern Ocean. (A) Locations of
CORSACS-1 stations NXCORSACS-1-CORSACS-1CORSACS-1 sampled during the austral summer (27 December 2005–22 January 2006). (B) Locations of CORSACS-2 stations NXCORSACS-13- NX13-20 sampled in the spring-early summer (16 November NX13-2006–3 December NX13-2006). (C) Locations of stations NX12 and JR23 in the Southern Ocean during 2. The polynya was smaller during 2 as shown by the smaller sampling area compared to CORSACS-1. Station NX9 was in the Bay of Whales area, the southernmost point reached by any ship at the time. Areas enclosed in the red boxes are presented as vertical sections in Fig. 4.
was quantified by standard additions with a Metrohm Dosi-mat, using a 5×10⁻⁹M CoCl2 standard solution prepared from a 1000 ppm Co atomic absorption standard (Fisher Sci-entific). A GPES script was programmed for three replicate scans of the sample prior to adding Co, followed by a scan after each of four automated 25 pM Co additions. Cobalt concentrations were calculated by dividing the mean of the triplicate sample scans by the standard addition slope de-termined by linear regression analysis, followed by reagent dilution and the following blank corrections for each set of reagents: 5.5±1.0 pM for the CORSACS-1 dCo profiles (sample set analyst M.A.S.), 13.4 pM for the CORSACS-1 dCo surface transects and labile Co measurements (sample set analyst A.E.N.), and 8.3±1.3 pM for the CORSACS-2 dCo and labile Co measurements, (sample set analyst T.J.G.) as determined by running blank seawater as previously
de-scribed (Saito and Moffett, 2001). Triplicate analysis of a surface sample from the Ross Sea using this automated method yielded 27.8 pM±0.7 pM (2.6% RSD). Linear re-gressions of the standard additions data typically yieldedr2
values of 0.99 or greater, with samples being reanalyzed if
M. A. Saito et al.: A study of dissolved cobalt in the Ross Sea, Antarctica 4063 2.4 Cobalt chemical speciation: labile cobalt
The chemical speciation of dissolved cobalt was determined using a high-throughput labile Co method as previously de-scribed (Saito et al., 2004, 2005). Briefly this approach in-volves the analytical system described above for total dis-solved cobalt, now with overnight equilibration (>8 h) of fil-tered seawater with 3×10⁻⁴M DMG at room temperature, which allows for quantification of ligand within the detec-tion window for KCoLof 1013.7to 1015.7, calculated using an estimated 50 pM natural organic cobalt ligand concentration and 10-fold range above and below a side reaction coeffi-cient ofαCoHDMG2of 28 460 (Saito et al., 2005). Conditional stability constants are not calculated in this high-throughput method. After equilibration, EPPS and nitrite are added and the sample is titrated with a Co standard as described for the dCo determinations above, but without the UV-irradiation treatment. The result is an estimation of what we refer to as labile cobalt, which is the dissolved cobalt that is not bound by the natural strong organic ligands following equilibration. 2.5 Cobalt uptake rates
Addition of the radiotracer 57Co to natural seawater sam-ples was used to measure the rate of cobalt uptake by phytoplankton (>2 µm) communities. 57CoCl
2 (Isotope Products Laboratories, Valencia, CA; 99% radionuclide pu-rity in 0.1 M HCl) was diluted in pH 2 Milli-Q water to 1.7 µCi mL−1(4.3 nM), and then again diluted to ∼0.1 nM 57Co in 0.4 µm-filtered seawater. An equilibrated seawater stock solution was prepared once for each cruise and used throughout for uniformity, allowing 24 h equilibration before the first rate measurements and storing at 4◦C in darkness be-tween uses. For these measurements, 60 or 150 mL polycar-bonate bottles were filled with unfiltered seawater collected in the trace-metal clean Niskin-X or Go-Flo bottles, deployed as described above. The polycarbonate bottles were initially cleaned as described above, and then re-used for additional measurements after successive rinses with 10% HCl, pH 2 Milli-Q water, and seawater. Within half an hour of the seawater collection, approximately 0.5 pmol L−1of57CoCl
2 was added to each bottle, then bottles were placed in a deck-board incubator shaded to∼20% ambient surface irradiance with neutral density screening material. Ambient tempera-ture (−1±1◦C) was maintained by a constant flow of surface seawater through the incubators. After 24 h, the incubations were filtered through 2 µm polycarbonate filter membranes and rinsed with 1–2 mL of 0.4 µm-filtered seawater. The fil-ter was cenfil-tered in a a tight-lid Petri dish (Fisher Scientific) sealed with Parafilm.
The57Co radioactivity on each filter was determined using a Canberra Germanium Gamma detector within 20 months of sample collection. Counts per minute at 122 keV were cor-rected for decay and normalized to % uptake per day, calcu-lated by dividing the activity on each filter by the total
activ-ity added to each incubation bottle. Samples were counted long enough to achieve a counting error <5%. Cobalt concentrations were determined at each sampling depth for which a Co uptake rate measurement was made. Cobalt take rates were then calculated by multiplying the percent up-take per day by the total dissolved cobalt concentration. Con-trol studies were conducted by killing the biological commu-nity with gluteraldehyde (1% final concentration; Co added 3 h after gluteraldehyde added) or heat (180 mL sample mi-crowave heated for 3×5 min; Co added 3 h after heat killed). Killed control treatments were filtered after 24 h incubation at 0◦C in the dark.
2.6 Pigment and nutrient analyses
Phytoplankton pigment samples (0.5–2 L) were filtered (Whatman GF/F filters), flash frozen in liquid nitrogen, and stored at −80◦C prior to analysis by HPLC as previously described (DiTullio and Geesey, 2002), with a slight modifi-cation using the Zapata method (Zapata et al., 2000). Water column samples for pigments were collected using a standard CTD rosette system at the same locations as trace-metal wa-ter sample collections. Filwa-tered samples for macronutrients were taken from the Niskin-X and Go-Flo trace metal sam-plers and analyzed at sea using an autoanalyzer method mod-ified from standard WOCE protocols (Gordon et al., 1993). 2.7 Data analysis and repository
Dissolved ecological stoichiometries were obtained from the slope of linear regressions. One-way and two-way least squares regressions were used for the vertical profile dCo dataset, with the former assuming one dependent and one independent variable, and the latter assuming two depen-dent variables and performed in MATLAB using the script lsqfitma.m. Previous studies used here for comparisons used one-way linear regressions, but the differences be-tween slopes are small relative to the environmental vari-ability discussed. The cobalt and nutrient data presented in this manuscript (a total of 463 dCo and labile cobalt values) have been deposited into the US Biological and Chemical Oceanography Data Management Office database under the CORSACS program (BCO-DMO http://bcodmo.org/).
3 Results and discussion
3 NX4
0 20 40 60 80
NX1
0 20 40 60 80
Dep
th (m)
0
50
100
150
200
250
300
NX2
0 20 40 60 80
NX3
0 20 40 60 80
NX5
0 20 40 60 80
Phosphate (M)
0.0 0.5 1.0 1.5 2.0 2.5 NX6
Dissolved Cobalt (pM)
0 20 40 60 80
Depth
(m)
0
50
100
150
200
250
300
Phosphate (M)
0.0 0.5 1.0 1.5 2.0 2.5 NX7
Dissolved Cobalt (pM)
0 20 40 60 80
Phosphate (M)
0.0 0.5 1.0 1.5 2.0 2.5 3.0 NX8
Dissolved Cobalt (pM)
0 20 40 60 80
Phosphate (M)
0.0 0.5 1.0 1.5 2.0 2.5 NX9
Dissolved Cobalt (pM)
0 20 40 60 80
Phosphate (M)
0.0 0.5 1.0 1.5 2.0 2.5 Phosphate
NX10
Dissolved Cobalt (pM)
0 20 40 60 80
De
pth (m)
0
50
100
150
200
250
300
350
400
450
500
550
600
650
700
750
800 dCo
Phosphate (M)
0.0 0.5 1.0 1.5 2.0 2.5 Stn54
Dissolved Cobalt (pM)
0 20 40 60 80
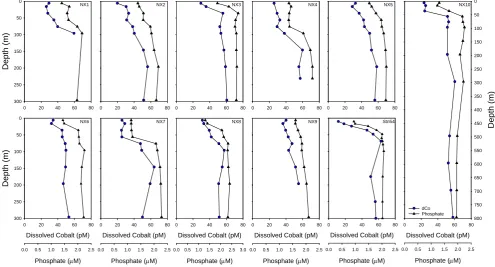
Fig. 2. Vertical profiles of total dissolved cobalt (dCo, circles) and soluble reactive phosphate (triangles) from austral summer in the Ross
Sea (CORSACS-1). Note the similarity in vertical structure for both nutrients throughout the water column.
element. The Ross Sea Polynya was almost completely open during the summer 2005–2006 cruise, but was only in the early stages of formation during the spring 2006 cruise, as revealed by the geographic distribution of stations occupied during the cruises (Fig. 1a, b) and estimated sea ice cover-age shown by Sedwick et al. (2011). In this study we ob-served four salient features with regard to the geochemistry of cobalt: (1) nutrient-like vertical profiles, (2) correlations between cobalt and soluble reactive phosphorus, (3) no ev-idence of scavenging removal in intermediate waters, and (4) non-saturating concentrations of strong cobalt-binding ligands resulting in the presence of significant concentrations of labile cobalt.
3.1 Dissolved cobalt: vertical profiles and surface transects
Total dissolved cobalt profiles from 11 stations in austral summer 2005–2006 (CORSACS-1 cruise) and 7 stations in austral spring 2006 (CORSACS-2 cruise) are presented in Figs. 2 and 3. All profiles from the summer cruise (Fig. 2) reveal surface depletion that likely reflects biological uptake and export. The Bay of Whales station NX9 showed the least surface depletion, likely due to lower productivity and recent retreat of sea-ice cover. Surface depletion was also evident in most profiles from the austral spring cruise (Fig. 3), but to a lesser extent than observed in the preceding summer. Almost all dCo profiles showed strong similarity in
verti-cal structure to soluble reactive phosphate, consistent with biological uptake and vertical export of dCo due to phyto-plankton. The dCo profiles from each cruise were used to create quasi-zonal sections that clearly reveal the surface de-pletion of dCo across the Ross Sea region (Fig. 4, top pan-els). The phytoplankton assemblage present when dCo and PO3−4 were both drawn down included Phaeocystis
antarc-tica and diatoms, as determined by pigment analyses (Fig. 4,
[image:6.595.48.544.65.332.2]M. A. Saito et al.: A study of dissolved cobalt in the Ross Sea, Antarctica 4065
Phosphate (M)
0.0 0.5 1.0 1.5 2.0 2.5 3.0
NX12
Cobalt (pM)
0 20 40 60 80 100 120 0
200
400
600
800
1000
1200
Phosphate (M)
0.0 0.5 1.0 1.5 2.0 2.5
NX13
Cobalt (pM)
0 20 40 60 80
De
pt
h
(
m
)
0
100
200
300
400
500
NX14
0 20 40 60 80 0
100
200
300
400
500
Phosphate (M)
0.0 0.5 1.0 1.5 2.0 2.5
NX17
Cobalt (pM)
0 20 40 60 80 100
De
pt
h
(
m
)
0
50
100
150
200
250
300
NX15
0 20 40 60 80 100 0
100
200
300
400
Phosphate (M)
0.0 0.5 1.0 1.5 2.0 2.5
NX20
Cobalt (pM)
0 20 40 60 80 100 0
100
200
300
Phosphate (M)
0.0 0.5 1.0 1.5 2.0 2.5
Phosphate JR23
Cobalt (pM)
0 20 40 60 80 100 120 0
200
400
600
800
1000
[image:7.595.49.545.65.372.2]1200 dCo Labile Co
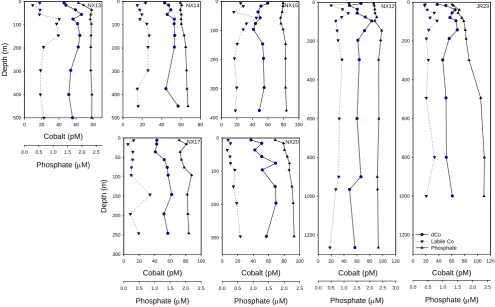
Fig. 3. Vertical profiles of total dissolved cobalt (dCo, circles), labile cobalt (downward triangles, dashed line) and soluble reactive phosphate
(upward triangles, solid line) from late spring/early summer in the Ross Sea (CORSACS-2). The abundance of both nutrients is higher than in late summer. Southern Ocean stations NX12 and JR23 showed the effects of scavenging of cobalt below the euphotic zone.
be as important here. However, our sampling strategy did not include samples in close proximity to the sea floor that might reveal concentration anomalies associated with small input fluxes. Also, given the low Co:Fe ratio (∼1:2600) of crustal material (Taylor and McLennan, 1985), the accumu-lation and release of terrigenous material from sea ice would likely have a more subtle effect on the distribution of cobalt relative to iron, depending on relative solubilities of these two elements in lithogenic particles (Sedwick et al., 2007; Thur´oczy et al., 2010).
Four surface-water transects of cobalt from the austral summer cruise were obtained using the underway towed fish. Trends in surface dCo (∼3 m depth) were broadly similar to the macronutrients, as shown in Fig. 5. In transect 2, for example, dCo concentrations varied between 17 and 59 pM, but were typically between 20–40 pM, with an average of 33±7.2 pM. The very western edge of the transect was near the seasonal ice edge, and showed lower salinity, nutrients, and dCo, particularly along 76◦S and 76.5◦S. The west-ern portion of the surface transects also coincided with ele-vated primary productivity, particularly along the 75◦S tran-sect near Terra Nova Bay. Station NX10 within this bay was observed to have characteristics of High Salinity Shelf
Wa-ter (HSSW) below 300 m (Corami et al., 2005; hydrographic data not shown), and although having elevated iron concen-trations (0.5–0.7 nM; Sedwick et al., 2011), did not show elevated cobalt relative to the rest of our Ross Sea stations (∼65 pM; Fig. 2).
3.2 Evidence for micronutrient behavior: correlation of cobalt with phosphate
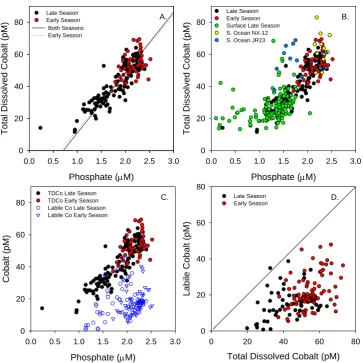
The similarities in the vertical and horizontal distributions of cobalt and phosphate were statistically significant based on a two-way linear regression of 164 vertical profile sam-ples from CORSACS-1 and 2 (Table 1 and Fig. 6a, both seasons together r2=0.87; CORSACS-1 data only r2=
NX2
ng / L 0 1000 2000 3000 0
50
100
150
200 NX3
ng / L
0 500 1000 1500 2000
D
epth (m)
0
50
100
150
200
Fuco 19-Hex
NX4
ng / L
0 500 1000 1500 2000 0
50
100
150
200
NX5
ng / L
0 500 1000 1500 2000 0
50
100
150
200
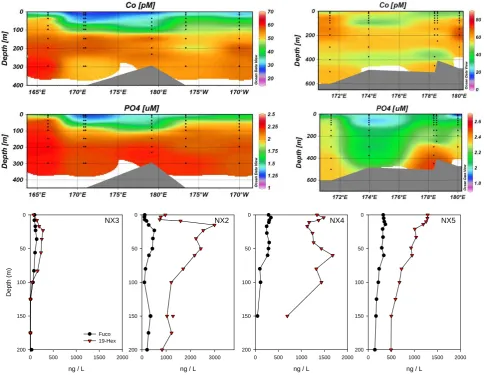
Fig. 4. Zonal sections of total dissolved cobalt and phosphate during summer (CORSACS-1; top left panel) and spring/early summer
(CORSACS-2; top right panels). Stations enclosed within the red line in Fig. 1a and b are included in the zonal sections. Summer shows the cumulative effects of cobalt and phosphate removal by phytoplankton uptake and export. Representative vertical phytoplankton pigment distributions during the summer CORSACS-1 cruise across the section showed large haptophytes populations (19-Hexanolyoxyfucoxanthin, primarily Phaeocystis antarctica) and smaller diatom populations (Fucoxanthin) within the center of the region of nutrient drawdown.
(∼30 pM dCo, ∼1.5 µM PO3−4 , Fig. 6b), with a thread of data plateauing at∼20 pM dCo while phosphate continues to be depleted to ∼0.1 µM, perhaps due to a residual amount of complexed cobalt with low resultant bioavailability. A number of samples from surface transects yield data that lie off the linear dCo vs. PO3−4 trend, suggesting an ex-ternal input such as melting sea ice. Input from sea ice melt might be expected to cause deviations from the lin-ear dCo:PO3−4 relationship, since accumulated lithogenic ae-olian material should have an elevated Co:P ratio relative to biogenic matter. In addition, seawater metal:PO3−4 rela-tionships (Cd:PO3−4 in particular) do not appear to be pre-served within sea ice (Hendry et al., 2009), and sea ice can be quite depleted in phosphorus (McMinn et al., 1999). In general, deviation from the seawater metal:P relationship is expected to result from processes other than biological
[image:8.595.56.541.63.438.2]M. A. Saito et al.: A study of dissolved cobalt in the Ross Sea, Antarctica 4067
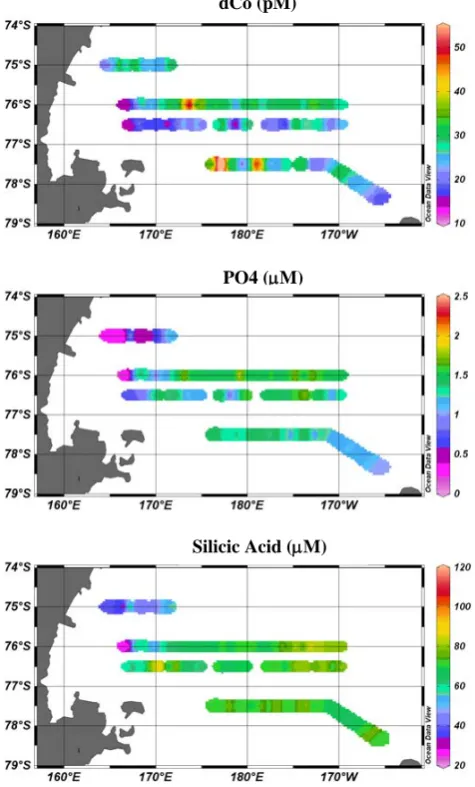
dCo (pM) [image:9.595.48.286.66.460.2]
Silicic Acid (M) PO4 (M)
Fig. 5. Surface transects for total dissolved Co (dCo, top),
sol-uble reactive phosphate (middle) and silicic acid (bottom) from CORSACS-1 1–22 January 2006. Total dissolved cobalt showed a general similarity to macronutrients throughout the transect. The very western edge of the transect was near the ice edge and showed a decrease in salinity, nutrients, and cobalt, particularly along 76◦S and 76.5◦S. The western portion of the transects also had high pri-mary productivity, particularly along the western edge of the 75◦S transect near Terra Nova Bay.
3.3 Chemical speciation of cobalt
Cobalt speciation measurements revealed that while strong cobalt-binding ligands were present in all of the samples, a significant fraction of the total dissolved cobalt was not com-plexed by these ligands (Figs. 3 and 6c). We have previously described this unbound fraction as “labile” cobalt, with the assumption that it is bound by inorganic ligands or weak or-ganic ligands (Saito et al., 2005, 2004). Comparison of total dissolved Co and labile Co in the Ross Sea shows that
la-bile Co was usually detectable in significant concentrations (Fig. 6d). These cobalt-binding ligands were strong enough to be measured within our conditional stability constant de-tection window of 1013.7to 1015.7, with experiments suggest-ing that the ligand strength exceeded our detection window (Kcond≥1015.7, data not shown), as we have observed else-where (Saito et al., 2005). This abundance of labile cobalt is likely important in providing a bioavailable form of Co to eukaryotic phytoplankton (Saito et al., 2002, 2004). More-over, the presence of measurable labile cobalt throughout the water column of the Ross Sea contrasts with observations in tropical and subtropical regions, where cobalt is often com-pletely bound by strong ligands in the upper euphotic zone (Saito and Moffett, 2001; Saito et al., 2004, 2005; Noble et al., 2008). Exceptions to this appear to be related to signifi-cant sources of cobalt, such as in the Peru Upwelling Region, where a large flux of cobalt is thought to enter the system as labile cobalt, and where large phytoplankton community shifts occurred concurrently with changes in cobalt specia-tion (Saito et al., 2004).
It seems likely that cobalt-binding ligands are produced as a by-product of vitamin B12biosynthesis and perhaps subse-quent photochemical alteration. By this logic, the presence of microbes capable of producing the cobalt-containing vitamin B12should be important to the generation of cobalt-binding ligands. Of the microbes potentially present in seawater, all publicly available marine cyanobacteria with genomes se-quenced thus far appear to have components of the biosyn-thetic pathway (30 genomes as of July 2010, including
Cro-cosphaera, Trichodesmium, Synechococcus, Prochlorococ-cus, and UCYN-A; M. A. Saito, personal observation, 2010,
Table 1. Relationship between cobalt and phosphate in the Ross Sea and elsewhere.
Geographic Location Depth range Co (pM) 1Co:1P r2
(m) µmol mol−1
Ross Sea, Antarctica (this study) 5–500 19–71 37.6 0.87
NE Pacific (Martin et al., 1989) 50–150 7.9–32 39.8 0.98
NE Pacific (Martin et al., 1989) 50–150 28–40 35.5 0.99
NE Pacific (Martin et al., 1989) 8–50 25–55 38.4 0.97
Peru Upwelling Region (Saito et al., 2004) 8 21–315 248 0.83
Equatorial Atlantic (Saito and Moffett, 2002) 5 5–87 560 0.63
A.
Phosphate (M)
0.0 0.5 1.0 1.5 2.0 2.5 3.0
Total Diss
olved Cob
a
lt (pM)
0 20 40 60 80
Late Season Early Season
C.
Phosphate (M)
0.0 0.5 1.0 1.5 2.0 2.5 3.0
C
obalt (pM)
0 20 40 60 80
TDCo Late Season TDCo Early Season Labile Co Late Season Labile Co Early Season
B.
Phosphate (M)
0.0 0.5 1.0 1.5 2.0 2.5 3.0
Total Diss
olved Cob
a
lt (pM)
0 20 40 60 80
Late Season Early Season Surface Late Season S. Ocean NX-12 S. Ocean JR23
D.
Total Dissolved Cobalt (pM)
0 20 40 60 80
Labile Co
balt (pM)
0 20 40 60 80
Late Season Early Season Both Seasons
Early Season
Fig. 6. (A) Total dissolved cobalt and phosphate were correlated throughout the water column of the Ross Sea. Both were noticeably higher
[image:10.595.116.480.248.612.2]M. A. Saito et al.: A study of dissolved cobalt in the Ross Sea, Antarctica 4069
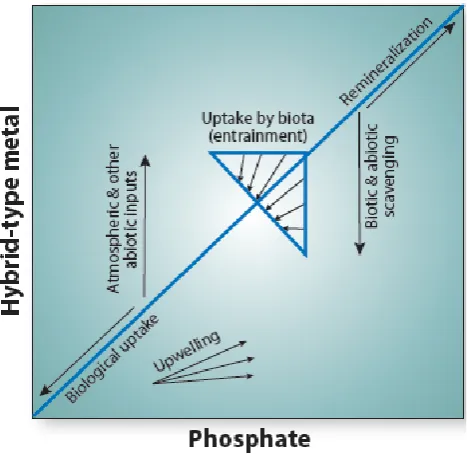
Fig. 7. A schematic showing vectors for processes influencing
hybrid-type metals relative to phosphate, where hybrid-type metals refers to those that have the combination of micronutrient uptake and scavenging processes influencing vertical structure. Biologi-cally influenced processes such as phytoplankton uptake and rem-ineralization of particles create diagonal vectors (variable individual species metal quotas are aggregated for a community quota). Abi-otic processes (or non-nutritive processes in the case of microbial manganese oxidation) such as aeolian deposition and scavenging result in near vertical vectors (Fig. 9d). Upwelling should result in a diagonal vector with a lower slope than the biotic vectors due to the effect of scavenging on removal of hybrid-type metal relative to phosphate. After Noble et al. (2008).
2010), suggesting they are not identical, but rather are linked via chemical transformation. If cobalt ligands are indeed a degradation product of vitamin B12, we hypothesize that the lack of cyanobacteria and low abundance of heterotrophic bacteria in the Ross Sea in the austral spring results in a low production rate of vitamin B12and perhaps a commensurate low cobalt ligand production rate in the Ross Sea relative to temperate and tropical oceans. As mentioned above, we and others have observed phytoplankton colimitation by iron and vitamin B12 in the Ross Sea, Southern Ocean, and coastal environments (Panzeca et al., 2006; Sa˜nudo-Wilhelmy et al., 2006; Bertrand et al., 2007; Gobler et al., 2007). Yet the heterotrophic bacteria cell numbers do increase by the end of austral summer in the Ross Sea (Ducklow et al., 2001; Bertrand et al., 2007): the presence of labile cobalt in the Ross Sea water column suggests that either the population of microbes present does not have comparable B12 produc-tion rates relative to the high summer phytoplankton B12 de-mand, and/or that the Ross Sea microbial community is not being lysed and grazed as rapidly as in low-latitude micro-bial loop environments to allow the saturation of cobalt by
ligands that we observe in regions such as the Costa Rica Dome and Sargasso Sea (Saito and Moffett, 2001; Saito et al., 2005). Thus, the distinctiveness of the polar bacterial community of the Ross Sea provides a likely explanation for both the lack of saturating concentrations of cobalt-binding ligands and the colimitation of phytoplankton growth by vi-tamin B12in these waters.
4070 M. A. Saito et al.: A study of dissolved cobalt in the Ross Sea, Antarctica
A.
Fucoxanthin concentration (ng L-1)
0 200 400 600 800 1000 1200 1400 1600 1800
C
o
up
ta
k
e
(p
m
o
l L
-1
da
y
-1)
0.0 0.5 1.0 1.5 2.0 2.5 3.0
10-20 m 30-40 m >50 m
B.
19- Hex concentration (ng L-1)
0 500 1000 1500 2000 2500 3000
Co upt
ake (pmol
L
-1 day -1)
0.0 0.5 1.0 1.5 2.0 2.5 3.0
Stn 97
D
e
pt
h (m)
0
20
40
60
80
100
NX 20
Co uptake (pmol L-1 day-1)
0.0 0.5 1.0 1.5 2.0 2.5 0
20
40
60
80
100
NX 1
0
20
40
60
80
100
Pigment concentration (ng L-1)
0 500 1000 1500 2000 2500
Co Fuco 19-Hex C.
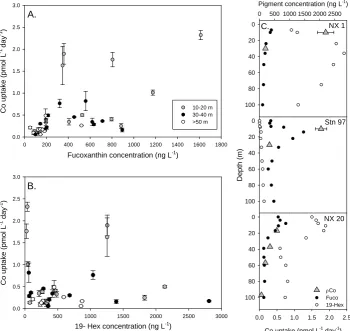
Fig. 8. Cobalt uptake rates and phytoplankton pigment concentrations from CORSACS-1 and 2. (A) Means of triplicate cobalt uptake rate
measurements at three depth intervals (error bars are one standard deviation) versus the diatom indicator pigment fucoxanthin (Fuco) from the nearest depth. (B) Cobalt uptake versus the haptophyte indicator pigment 19-hexanolyoxyfucoxanthin (19-Hex). (C) Three representative profiles of Co uptake rates, Fuco and 19-Hex concentrations from NX1 and station 97 from CORSACS-1 and NX20 from CORSACS-2. Cobalt uptake rates show weak correlation with fucoxanthin (A,r2=0.35) and no correlation with 19-Hex (B,r2=0.003); although some high cobalt uptake rates co-occur with high 19-Hex abundance (C, NX1).
near the APF would then represent a situation intermediate between the Ross Sea and the tropics.
3.4 Cobalt uptake rates
Measurements of cobalt uptake from the dissolved phase to the >2µm size fraction particulate phase approached 2.5 pmol L−1day−1(Table 3, Fig. 8). Glutaraldehyde-killed control treatments showed little abiotic uptake (∼2–4% of live uptake, Table 3). The observed biological uptake could be due to assimilation into cellular material and/or biologically-mediated co-oxidation with manganese into ox-ide minerals (Moffett and Ho, 1996). However, given the ap-parent lack of scavenging removal of dissolved Co from the mesopelagic zone (see Sect. 3.6) and low Mn euphotic zone abundances (Sedwick et al., 2000), it seems likely that bio-logical oxide mineral formation was not an important process for Co removal in the Ross Sea surface waters. If so, these
uptake rate measurements can be interpreted as approxima-tions of the rate of assimilation of dissolved Co by the phy-toplankton community and any particle-associated bacterial communities. In addition, we observed a near linear relation-ship between Co uptake and time over 24 h, suggesting that uptake rates are relatively constant over a diel cycle in this region (Station NX7, 30 m seawater: % uptake at 1, 3, 5.2, 15.5 h timepoints was 0.12, 0.25, 0.48, and 1.18%, respec-tively). Overall, these Ross Sea cobalt uptake rates are more than 6-fold higher than cobalt uptake rates measured in the Peru Upwelling region, which also has relatively abundant and labile cobalt and high productivity (Saito et al., 2004). Hence while we argue below that ecological stoichiometries suggest Zn may dominate cambialistic nutrition, cobalt up-take is still quite pronounced in the Ross Sea.
[image:12.595.122.473.65.396.2]M. A. Saito et al.: A study of dissolved cobalt in the Ross Sea, Antarctica 4071 It should be noted that uptake rates discussed here were
calculated assuming that the radiotracer had equilibrated with the entire dissolved Co pool on the timescale of days to weeks. However, it is likely that there are Co(III) com-plexes in seawater (e.g., vitamin B12) for which dissociation is extremely slow such that their equilibration with the radio-tracer was incomplete. As a result, the rate measurements discussed here are likely upper limits. If uptake rates are cal-culated assuming that the radiotracer equilibrated only with the measured labile cobalt fraction, the relative trends ob-served with depth and between stations are broadly similar.
Figure 8 shows that high Co uptake rates were generally found at depths shallower than 20 m (gray dots, Fig. 8a and b). Since the uptake rate incubations were all conducted at the same irradiance (∼20% surface), it is possible that up-take rates in deeper samples may reflect some photoinhi-bition. However, higher biological algal pigment concen-trations in the Ross Sea are generally found in shallower depths, (Figs. 4, 8), hence higher Co uptake rates in near-surface waters are not unexpected. As shown in Fig. 8, higher Co uptake rate was generally correlated with elevated pig-ment concentrations. There were some areas where high 19-hexanolyoxyfucoxanthin (19-Hex), a haptophyte indicator pigment that is strongly correlated with Phaeocystis
antarc-tica in the Ross Sea (DiTullio et al., 2003), coincided with
high Co uptake rates (e.g., Fig. 8c, NX1), but generally, Co uptake rates appeared to correlate most strongly with fucox-anthin concentrations (fuco, a proxy for diatom biomass in the Ross Sea, Fig. 8a). This might suggest that diatoms are responsible for more uptake of Co than Phaeocystis
antarc-tica and that on balance, Co uptake by diatoms may be more
efficient than uptake by Phaeocystis. As discussed above,
P. antarctica and several diatom species have been shown to
use Co in place of Zn, although the degree to which Co can replace Zn varies among diatom species (Sunda and Hunts-man, 1995; Saito and Goepfert, 2008). However, even those diatoms that do not substitute Co for Zn still actively assim-ilate dissolved Co (Timmermans et al., 2001). Also, the Co requirements of P. antarctica are satisfied at lower concen-trations relative to some diatoms (Saito and Goepfert, 2008), supporting the idea that diatoms may be responsible for more cobalt uptake than P. antarctica. Due to the interrelated bio-chemistries and transporter affinities for Co and Zn, it is likely that Co uptake rates may also be driven in part by Zn concentrations. Since biological uptake and utilization of Co and Zn are so closely tied, future research on Zn abun-dances, uptake rates, and the proteins responsible for biolog-ical substitution between these micronutrients in polar envi-ronments would improve our understanding of cobalt uptake in the Ross Sea.
3.5 Ecological stoichiometry of cobalt inferred from correlation with phosphate, and comparison with Cd and Zn stoichiometries
Phytoplankton uptake and subsequent remineralization of biomass result in the removal and addition of bioactive met-als and phosphorus at ratios reflective of the aggregrate sto-ichiometry of the phytoplankton and microbial community. The sinking of organic material creates a biochemical lation of elements that is superimposed upon physical circu-lation processes (Redfield et al., 1963). Based on the extent to which this biochemical circulation modifies the composi-tion of seawater, the slope of the dissolved nutrient to phos-phate relationship can reflect the aggregate stoichiometry of biological processes. For example, Redfield et al. (1963) ob-served similarities between the ratios of seawater NO−3:PO3−4 distributions and the elemental N:P composition of marine plankton (Redfield et al., 1963), and more recently the cel-lular metal contents of phytoplankton have been compared with trace metal abundances in seawater (e.g., Sunda and Huntsman, 1995, 2000; Fitzwater et al., 2000; Saito and Moffett, 2002; Ho et al., 2003; Saito et al., 2004; Noble et al., 2008; Lane et al., 2009). This characterization of elemental stoichiometries in nature has been termed “eco-logical stoichiometry”, defined broadly as “the balance of multiple chemical substances in ecological interactions and processes” (Sterner and Elser, 2002). Correlations between dissolved Cd and PO3−4 or between dissolved Zn and silicic acid, have long been recognized as oceanographically impor-tant relationships (Boyle et al., 1976; Bruland, 1980), leading to the application of Cd as a paleoproxy for seawater phos-phate (Boyle, 1988).
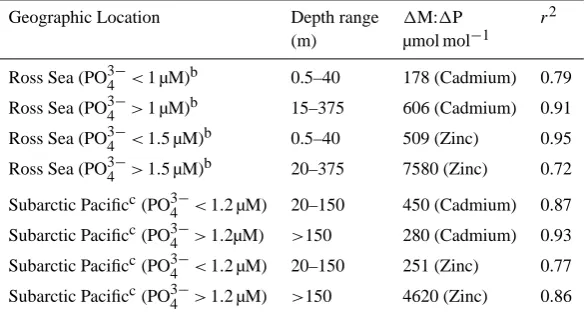
Table 2. Relationship between cadmium and zinc versus phosphate in the Ross Seaa.
Geographic Location Depth range 1M:1P r2
(m) µmol mol−1
Ross Sea (PO3−4 <1 µM)b 0.5–40 178 (Cadmium) 0.79
Ross Sea (PO3−4 >1 µM)b 15–375 606 (Cadmium) 0.91
Ross Sea (PO3−4 <1.5 µM)b 0.5–40 509 (Zinc) 0.95
Ross Sea (PO3−4 >1.5 µM)b 20–375 7580 (Zinc) 0.72
Subarctic Pacificc(PO3−4 <1.2 µM) 20–150 450 (Cadmium) 0.87 Subarctic Pacificc(PO3−4 >1.2µM) >150 280 (Cadmium) 0.93 Subarctic Pacificc(PO3−4 <1.2 µM) 20–150 251 (Zinc) 0.77 Subarctic Pacificc(PO3−4 >1.2 µM) >150 4620 (Zinc) 0.86
aRelationships shown in Fig. 9. bData from Fitzwater et al. (2000).
cData from Martin et al. (1989); inclusive of T5, T6, T8; based on Sunda and Huntsman (1995).
al., 2008); and (4) the role of organic ligands in controlling metal bioavailability (Bruland and Lohan, 2003). These is-sues will be discussed below in the context of our Ross Sea data.
In the Ross Sea we estimate a seawater Co:PO3−4 ecolog-ical stoichiometry of 37.6 µmol mol−1 based on a two-way linear regression of the dissolved species concentrations us-ing the vertical profile datasets inclusive of all depths and both sampling seasons (Fig. 6a, Table 1; a one-way regres-sion yields a similar value of 28.3 µmol mol−1 with r2 of 0.75). This value is quite similar to the dissolved Co:PO3−4 ratios of 35–40 µmol mol−1observed in the upper 150 m of the subarctic Pacific (Martin et al., 1989; Sunda and Hunts-man, 1995). However, other regions such as the Eastern Tropical Pacific and Equatorial Atlantic display Co:PO3−4 stoichiometries that are approximately an order of magni-tude higher than the Ross Sea and subarctic Pacific ratios (248 and 560 µmol mol−1; Saito and Moffett, 2002; Saito et al., 2004). The juxtaposition of an inter-seasonal coherence for seawater Co:PO3−4 ecological stoichiometry (where both seasons data falls along a single line) in the Ross Sea relative to the large geographic variability in Co:PO3−4 stoichiome-tries described above (Table 1) implies that the organization of dissolved cobalt in the water column occurs on timescales that are longer than seasonal processes, but shorter than that of large-scale circulation processes. This rough timescale is also consistent with the observations of lack of scavenging and uptake rates described in Sects. 3.6 and 3.4, respectively. The ecological stoichiometry of Co needs to be consid-ered in conjunction with those of Zn and Cd because of the biochemical substitution within enzymes as described in the Introduction. The presence of correlations of both dissolved Co and Zn with phosphate have been described by Sunda and Huntsman in shallow waters of the subarctic Pacific as
evi-dence for biological uptake and remineralization (Martin et al., 1989; Sunda and Huntsman, 1995). In that region the dissolved Zn and PO3−4 relationship showed a distinct kink causing two stoichiometries: a dissolved Zn:PO3−4 ratio of
∼4600 µmol mol−1 below∼150 m depth (where PO3−4 >∼
1.2 µM), and a much lower Zn:PO3−4 ratio of∼250 in shallow waters (see Fig. 9 and Table 2; data from Martin et al., 1989). Interestingly, dissolved Co was correlated with PO3−4 only in the shallow waters, which Sunda and Huntsman (1995) attributed to the biochemical substitution of Co for some of the biological Zn demand in the euphotic zone. These authors estimated a larger nutritional role of Zn relative to Co in shallow waters, based on ecological stoichiometry ra-tios for dissolved Zn:PO3−4 /Co:PO3−4 of 6:1–10:1. However, they also pointed out that the>100-fold increase in dissolved Co:Zn concentrations between the nutricline and surface wa-ters could also contribute to growth of phytoplankton with distinct Co requirements, such as the coccolithophore E.
hux-leyi and cyanobacteria (Sunda and Huntsman, 1995; Saito et
al., 2002). No linear relationship between Co:PO3−4 was ob-served in deeper waters of the subarctic Pacific, likely due to the influence of scavenging (see below).
M. A. Saito et al.: A study of dissolved cobalt in the Ross Sea, Antarctica 4073
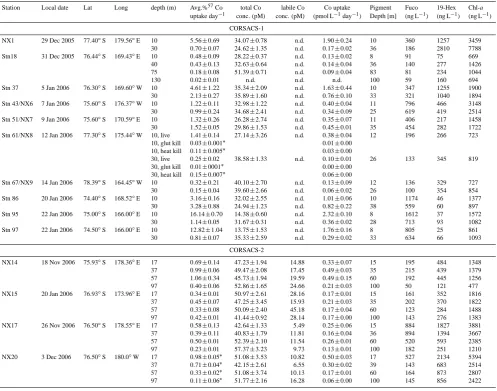
Table 3. Cobalt uptake rates and associated parameters. Errors given are one standard deviation unless noted.
Station Local date Lat Long depth (m) Avg.%57Co total Co labile Co Co uptake Pigment Fuco 19-Hex Chl-a
uptake day−1 conc. (pM) conc. (pM) (pmol L−1day−1) Depth [m] (ng L−1) (ng L−1) (ng L−1)
CORSACS-1
NX1 29 Dec 2005 77.40◦S 179.56◦E 10 5.56±0.69 34.07±0.78 n.d. 1.90±0.24 10 360 1257 3459 30 0.70±0.07 24.62±1.35 n.d. 0.17±0.02 36 186 2810 7788 Stn18 31 Dec 2005 76.44◦S 169.43◦E 10 0
.48±0.09 28.22±0.37 n.d. 0.13±0.02 8 91 75 669
40 0.43±0.13 32.63±0.64 n.d. 0.14±0.04 36 140 277 1426 75 0.18±0.08 51.39±0.71 n.d. 0.09±0.04 83 81 234 1044
130 0.02±0.01 n.d. n.d. n.d. 100 59 160 694
Stn 37 5 Jan 2006 76.30◦S 169.60◦W 10 4.61±1.22 35.34±2.09 n.d. 1.63±0.44 10 347 1255 1900 30 2.13±0.27 35.89±1.60 n.d. 0.76±0.10 33 321 1040 1894 Stn 43/NX6 7 Jan 2006 75.60◦S 176.37◦W 10 1
.22±0.11 32.98±1.22 n.d. 0.40±0.04 11 796 466 3148
30 0.99±0.24 34.68±2.41 n.d. 0.34±0.09 25 619 419 2514 Stn 51/NX7 9 Jan 2006 75.60◦S 170.59◦E 10 1.32±0.26 26.28±2.74 n.d. 0.35±0.07 11 406 217 1458 30 1.52±0.05 29.86±1.53 n.d. 0.45±0.01 35 454 282 1722 Stn 61/NX8 12 Jan 2006 77.30◦S 175.44◦W 10, live 1.41±0.14 27.14±3.26 n.d. 0.38±0.04 12 196 266 723
10, glut kill 0.03±0.001∗ 0.01±0.00 10, heat kill 0.11±0.005∗ 0
.03±0.00
30, live 0.25±0.02 38.58±1.33 n.d. 0.10±0.01 26 133 345 819 30, glut kill 0.01±0001∗ 0.00±0.00
30, heat kill 0.15±0.007∗ 0.06±0.00
Stn 67/NX9 14 Jan 2006 78.39◦S 164.45◦W 10 0.32±0.21 40.10±2.70 n.d. 0.13±0.09 12 136 329 727 30 0.15±0.04 39.60±2.66 n.d. 0.06±0.02 26 100 354 854 Stn 86 20 Jan 2006 74.40◦S 168.52◦E 10 3
.16±0.16 32.02±2.55 n.d. 1.01±0.06 10 1174 46 1377
30 3.28±0.88 24.94±1.23 n.d. 0.82±0.22 38 559 60 897 Stn 95 22 Jan 2006 75.00◦S 166.00◦E 10 16.14±0.70 14.38±0.60 n.d. 2.32±0.10 8 1612 37 1572
30 1.14±0.05 31.67±0.31 n.d. 0.36±0.02 28 713 93 1082 Stn 97 22 Jan 2006 74.50◦S 166.00◦E 10 12.82±1.04 13.75±1.53 n.d. 1.76±0.16 8 805 25 861
30 0.81±0.07 35.33±2.59 n.d. 0.29±0.02 33 634 66 1093
CORSACS-2
NX14 18 Nov 2006 75.93◦S 178.36◦E 17 0
.69±0.14 47.23±1.94 14.88 0.33±0.07 15 195 484 1348 37 0.99±0.06 49.47±2.08 17.45 0.49±0.03 35 215 439 1379 57 1.06±0.34 45.73±1.94 19.59 0.49±0.15 60 192 445 1256 97 0.40±0.06 52.86±1.65 24.66 0.21±0.03 100 50 121 477 NX15 20 Jan 2006 76.93◦S 173.96◦E 17 0.34±0.01 50.97±2.61 28.16 0.17±0.01 15 161 352 1816
37 0.45±0.07 47.25±3.45 15.93 0.21±0.03 35 202 370 1822 57 0.33±0.08 50.09±2.40 45.18 0.17±0.04 60 123 284 1488 97 0.42±0.01 41.44±0.92 28.14 0.17±0.00 100 143 276 1383 NX17 26 Nov 2006 76.50◦S 178.55◦E 17 0.58±0.13 42.64±1.33 5.49 0.25±0.06 15 884 1827 3881 37 0.39±0.11 40.83±1.79 11.81 0.16±0.04 36 894 1394 3667 57 0.50±0.01 52.39±2.10 11.54 0.26±0.01 60 520 593 2385 97 0.23±0.01 57.37±3.23 9.73 0.13±0.01 100 182 251 1210 NX20 3 Dec 2006 76.50◦S 180.0◦W 17 0
.98±0.05∗ 51
.08±3.53 10.82 0.50±0.03 17 527 2134 5394 37 0.71±0.04∗ 42.15±2.61 6.55 0.30±0.02 39 143 683 2514 57 0.33±0.02∗ 51.08±3.74 10.13 0.17±0.01 60 164 873 2807 97 0.11±0.06∗ 51.77±2.16 16.28 0.06±0.00 100 145 856 2422
∗denotes where only single incubations were conducted. Error given is 5% counting error rather than standard deviation.
n.d. denotes no data available.
and of 509 µmol mol−1 (Zn:PO3−4 ) and 178 µmol mol−1 (Cd:PO3−4 )in shallow waters (≤40 m; Table 2). Cobalt anal-yses were also included in the Fitzwater et al. (2000) study; however, no clear relationship between Co and P was ob-served. This may reflect limited analytical precision for Co or the recently documented artifact arising from cobalt-binding ligands, which necessitate UV-irradiation of sam-ples prior to dissolved Co determination since the complexes do not dissociate at pH 2 (Saito and Schneider, 2006; Bru-land, 2010), although this analytical issue would presum-ably apply to the subarctic Pacific dataset used here as well, which does not appear to have any precision issues (Ta-ble 1; Martin et al.,1989). While dissolved Zn:PO3−4 and Cd:PO3−4 ratios are much lower in shallow waters relative to depth, the dissolved Co:PO3−4 stoichiometry is relatively low
(37.6 µmol mol−1) and constant throughout the water column based on our 2005/2006 data, in contrast to the subarctic Pa-cific data where the Co:PO3−4 relationship breaks down be-low shalbe-low waters (Figs. 9d and 10b). While the Fitzwater et al. (2000) data are from an earlier expedition (summer 1990), we assume some consistency of the Ross Sea phytoplankton stoichiometry for the purpose of our comparisons.
G. Ross Sea
Phosphate (mol kg-1)
0.0 0.5 1.0 1.5 2.0 2.5
T
o
tal Dissolv
ed Zn (
n
mol kg
-1)
0 2 4 6 8
H. Ross Sea
Phosphate (mol kg-1)
0.0 0.5 1.0 1.5 2.0 2.5
T
o
tal Dissol
v
ed Cd (nmol kg
-1)
0.0 0.2 0.4 0.6 0.8 1.0
D. North Pacific
Phosphate (mol kg-1)
0.0 0.5 1.0 1.5 2.0 2.5 3.0 3.5
Total Dissolved Co (pmol
kg
-1)
0 10 20 30 40 50 60 A.
Cobalt (pmol kg-1) 0 20 40 60
De
pth (m)
0
200
400
600
800
1000
1200
1400
1600
B.
Zinc (nmol kg-1) 0 2 4 6 8 10
C.
Cadmium (nmol kg-1) 0.0 0.5 1.0
E. North Pacific
Phosphate (mol kg-1)
0.0 0.5 1.0 1.5 2.0 2.5 3.0 3.5
Total Dissolved Zn (nmol kg
-1 )
0 2 4 6 8
10 F. North Pacific
Phosphate (mol kg-1)
0.0 0.5 1.0 1.5 2.0 2.5 3.0 3.5
T
o
tal Dissolv
ed Cd (
n
mol kg
-1 )
[image:16.595.151.445.61.489.2]0.0 0.2 0.4 0.6 0.8 1.0
Fig. 9. Examination of relationships between Co, Cd, and Zn and phosphate in the subarctic Pacific and Ross Sea in previous studies (Martin
et al., 1989; Fitzwater et al., 2000). (A–C) Vertical profiles of Co, Zn, and Cd in the subarctic Pacific/Gulf of Alaska (Station T8) from Martin et al. (1989), with Co showing the influence of scavenging at intermediate depths. (D) A correlation of subarctic Pacific cobalt with phosphate was present in the upper 100 m of several vertical profiles (red outline), whereas Co from below the euphotic zone to 4000 m depth showed the influence of scavenging with a downward curl relative to phosphate (see scavenging vector in Fig. 7). (E–F) The subarctic Pacific Zn vs. PO3−4 and Cd vs. PO3−4 showed a concave and convex kink respectively, where the datasets were separated into shallow (red outline) and deep (black) and the estimated stoichiometries are shown in Table 2. (G–H) Shallow (red outline) and deep (black) Zn vs. PO3−4 and Cd vs. PO3−4 relationships in the Ross Sea using data from Fitzwater et al. (1990), with linear regressions shown.
huxleyi, Thalassiosira oceanica, and Thalassiosira pseudo-nana), while the shallow Zn:P ratio was in excess of the
re-quirements of the small diatom T. oceanica but not those of the larger diatom T. pseudonana. These variations in dis-solved Zn requirements have been shown to be related to the higher surface area to volume ratio that accompanies smaller cell size, where uptake rates approach diffusion lim-itation at low Zn2+ concentrations (Sunda and Huntsman,
M. A. Saito et al.: A study of dissolved cobalt in the Ross Sea, Antarctica 4075
Ecological Stoichiometry (mol metal mol-1 P)
10 100 1000 10000 Zn Deep
Cd Deep Co Deep Zn Shallow Cd Shallow Co Shallow
10 100 1000 10000
[image:17.595.51.285.63.232.2]T. oceanica T. pseudonana E. huxleyi
Fig. 10. Ecological stoichiometries from dissolved Zn, Cd, and Co
in shallow water (<40 m) and intermediate depths (50 m–500 m) in the Ross Sea (horizontal bars, Tables 1 and 2; Co data from this study, Zn and Cd data from Fitzwater et al., 2000) compared to lab-oratory estimates of cellular stoichiometries of Zn:P below which phytoplankton growth limitation is observed (vertical lines, when no cobalt is added; data from Sunda and Huntsman, 1995). Co:P growth limiting stoichiometries (when no zinc is added) are quite similar to the Zn:P stoichiometries shown, with the exception that both diatoms (T. oceanica and T. pseudonana) do not reach the max-imal growth rates with no zinc added (Sunda and Huntsman, 1995). These results imply that low Zn:PO3−4 stoichiometries in shallow waters could phytoplankton community composition in the Ross Sea.
observations imply the need for Zn nutrition in the Zn/Co cambialistic enzymes due to low Co abundance in the Ross Sea. Similarly, Zn and Co physiological studies with a cul-ture of Phaeocystis antarctica showed optimal growth rates and cell yields with Zn rather than Co (Saito and Goepfert, 2008). Together these calculations provide evidence for a greater overall use of zinc relative to cobalt in the shallow waters of the Ross Sea, with a ratio of dissolved Zn:Co sto-ichiometries of 17:1 (Zn:PO3−4 /Co:PO3−4 ). This ratio sug-gests that Ross Sea phytoplankton have an even greater nu-tritional reliance on Zn versus Co, relative to the subarctic Pacific (Zn:Co ∼6:1–10:1, see above). However, the par-ticularly intense primary productivity of the Ross Sea likely maintains selection pressure for biochemical substitution of Co, Cd and Zn. For example, Capodaglio et al. (1998) report significant drawdown of Cd (>5 fold) during the seasonal progression in Terra Nova Bay of the Ross Sea, likely caused by the tremendous diatom blooms and resultant CO2 draw-down observed there (Arrigo et al., 1999). It seems likely that under these highly productive and lowered CO2conditions, cambialistic carbonic anhdyrase enzymes have an important ecological and biogeochemical function.
An intriguing aspect of the Co and PO3−4 relationship in the Ross Sea is the lack of an obvious kink in the vertical profile dataset (Fig. 6a), in contrast to Cd and Zn which both showed clear kinks in the Ross Sea (Fig. 9g and h; Fitzwa-ter et al., 2000). The causes of the kink in the relationship between Cd and phosphate has been the subject of signifi-cant discussion in recent years (Boyle, 1988; de Baar, 1994; Elderfield and Rickaby, 2000; Sunda and Huntsman, 2000; Cullen et al., 2003; Cullen, 2006; Ellwood, 2008; Hendry et al., 2008), and we argue here that comparing the rela-tionships of Co, Cd, or Zn with phosphate should provide useful insights into the causes behind these kinks. Two pre-vious compelling mechanistic explanations for the Cd kink involve the influence of either Zn or Fe on Cd uptake by phytoplankton. The Zn mechanism involves depletion of Zn by phytoplankton uptake, resulting in an increase in Cd up-take through induction of phytoplankton Cd/Co transporters and replacement of Cd or Co for Zn within enzymes (Sunda and Huntsman, 2000). Zn binding ligands also likely con-tribute to this effect: as dissolved Zn falls below the Zn-binding ligand concentration, the free zinc concentrations will decrease precipitously. The alternative (or additional) Fe mechanism involves decreases in the uptake of major cel-lular elements (e.g., C or P) due to iron growth rate limita-tion, while maintaining (or increasing) Cd uptake rates, to create the enhanced cellular Cd:P ratios (Sunda and Hunts-man, 2000; Cullen et al., 2003; Cullen, 2006). This process is described as a growth rate dilution effect, where phosphate uptake is more sensitive to growth rate than metal uptake. A recent study provided an additional biochemical mechanism for this phenomenon where iron limitation of a diatom was found to cause an upregulation of ferrous iron transporters, which concurrently resulted in increased transport of other divalent cations such as cadmium (Lane et al., 2008). Both the Zn depletion and Fe limitation mechanisms result in in-creased Cd:P ratios in phytoplankton that in turn should de-plete dissolved Cd relative to P in the upper water column with export and remineralization of particulate material be-low the euphotic zone. These mechanisms are not necessar-ily mutually exclusive: while the Zn mechanism may occur in non-iron limited oceanic areas, both could exist in iron limited regions. These mechanisms are also broadly con-sistent with Elderfield and Rickaby’s “fractionation” concept for the global dissolved Cd:PO3−4 relationship (2000). Those workers suggested that a preferential incorporation of Cd relative to P into the particulate organic matter (POM) oc-curs ((Cd:P)POM/(Cd:P)Seawater=α,∼2.5), admittedly with-out invoking a specific mechanism. Elderfield and Rickaby further argue that the kinks are actually better described as curves that can be fit by a modified version of the Rayleigh isotope fraction model.
A.
NO3:PO4 (M:M)
0 5 10 15 20 25
D
e
pth (m)
0
200
400
600
800
1000
CORSACS 1
B.
Co:P (M:M)
0 10 20 30 40 50 60 70
0
200
400
600
800
1000
CORSACS 1 CORSACS 2 Subarctic Pacific
D.
Cd:P (M:M)
0 100 200 300 400 500
0
1000
2000
3000
4000
5000
Subarctic Pacific Ross Sea 1990
Sub. Pacific Cd:PO4 maximum
C.
Zn:P (M:M)
0 1000 2000 3000 4000 5000
De
pth
(m)
0
1000
2000
3000
4000
5000
Subarctic Pacific Ross Sea 1990
Sub. Pacific Cd:PO4 maximum
Fig. 11. (A) Comparison of NO−3:PO3−4 and (B) Co:PO3−4 ratios with respect to depth from this study (vertical profiles of CORSACS-1 and 2 for Co:PO3−4 ) show relatively modest variability, with some dissolved Co:PO3−4 decreases in surface waters. The slope of NO−3 plotted against PO3−4 here was 13.4, lower than Redfield ratio consistent with previous Ross Sea findings (Arrigo et al., 1999). Co:PO3−4 ratios from the subarctic Pacific show the influence of scavenging removal at below the euphotic zone. (C–D) In contrast, dissolved Zn:PO3−4 and Cd:PO3−4 ratios in the subarctic Pacific (Martin et al., 1989) and Ross Sea (Fitzwater et al., 2000) show large decreases in surface waters, consistent with our argument for a higher Zn:P phytoplankton stoichiometry at the base of the euphotic zone contributing to the formation of the Zn and Cd kinks. Note the elevated Cd:PO3−4 ratios at∼100 m and corresponding small maximum in Zn:PO3−4 values in the subarctic Pacific shown in green, the former of which we attribute to a biological concentrating mechanism (Noble et al., 2008).
phytoplankton similar to that of Cd:P. Although the inclu-sion of the surface transect dCo (Fig. 6b) suggests a plateau of∼20 pM, perhaps due to depletion of labile Co and a resid-ual of complexed cobalt that is less bioavailable (Fig. 6c and d). There are potentially three explanations for this lack of kink observation in the vertical profile dCo datasets. First, perhaps it is an artifact of temporal variability where a Co kink might have occurred during the 1990 expedition, but was not analytically resolvable at the time. We think this scenario is unlikely given the general similarity of Co, Cd, and Zn abundances between these two expeditions. Second, perhaps it is an artifact of comparing a regional Co:PO3−4 relationship to the global Cd:PO3−4 relationship, and that a kink might be observed within a larger Co dataset. We also do not think this is the case: while the Co:PO3−4
relation-ship is clearly much more variable (Table 1) than Cd:PO3−4 , the Cd:PO3−4 kinks are evident in numerous individual site-specific studies. Third, the most likely explanation is that there is an accumulation of Zn and Cd by phytoplankton in excess of their biochemical requirements (at either optimal growth rate or iron-limited growth rate) near the base of the euphotic zone, while cobalt is too scarce to allow excess up-take, as shown in the previous comparison to culture studies (Fig. 10). This is consistent with the observation that the Ross Sea dissolved Zn:PO3−4 ecological stoichiometry below
the nutricline was in great excess of phytoplankton
[image:18.595.135.460.64.391.2]M. A. Saito et al.: A study of dissolved cobalt in the Ross Sea, Antarctica 4077 by phytoplankton at the base of the euphotic zone and/or near
the chlorophyll maximum followed by sinking and reminer-alization of high Zn:P particulate material out of the euphotic zone would result in eventual surface waters with a lower dissolved Zn:PO3−4 ratio, and resultant lower phytoplankton cellular Zn:P. Because phytoplankton cellular metal quotas are highly plastic relative to P quotas, varying by four orders of magnitude for Zn versus one order or less for P (Droop, 1974; Sunda and Huntsman, 1992; Bertilsson et al., 2003), this mechanism of excess Zn uptake seems a plausible expla-nation for depleting surface waters in Zn relative to PO3−4 . Evidence for excess Zn uptake in the Ross Sea is shown in Fig. 1c and d, where both dissolved Zn:PO3−4 and Cd:PO3−4 stoichiometries decrease by ∼30-fold in the subarctic Pa-cific and ∼3-fold in the Ross Sea towards surface waters. In contrast, dissolved Co:PO3−4 and NO−3:PO3−4 ratios do not change appreciably throughout the water column, although there is some decrease in Co:PO3−4 ratios in the shallowest samples (Fig. 1a and b). We suggest two interrelated reasons for this: first, the high ratio of dissolved Zn:Co in the Ross Sea described above likely results in high Zn uptake and re-sultant minor Co uptake and use in the cambialistic enzymes within the phytoplankton community, as observed in labora-tory culture studies (Sunda and Huntsman, 1995; Lane and Morel, 2000). Second, as mentioned above, these low dis-solved Co:PO3−4 ratios are less than that required for opti-mal phytoplankton growth without supplementation with Zn (Sunda and Huntsman, 1995). The result of these two factors is a lack of excess Co uptake relative to PO3−4 at the base of the euphotic zone resulting in the relatively uniform dis-solved Co:PO3−4 ratio throughout the water column (Fig. 11), and hence no clear Co:PO3−4 kink in the vertical profile data (Fig. 6a).
This excess stoichiometry mechanism for Zn:P and Cd:P kink formation is not mutually exclusive to the previous Fe-limitation and Zn-depletion mechanisms suggested for Cd:P kink formation described above. Iron limitation was observed in the Ross Sea during both CORSACS cruises (Bertrand et al., 2007, 2011) and the 1990 expedition (Coale et al., 2003), consistent with the iron-induced Cd:PO3−4 growth rate dilution kink formation mechanism. Moreover, we measured Zn speciation in the Ross Sea and found that, in contrast to the North Pacific (Bruland, 1989; Jakuba et al., 2011), Zn-binding ligands were not present in excess of total dissolved Zn (M. A. Saito, personal communica-tion, 2010). Lack of excess strong ligand has also been ob-served for Cd in Terra Nova Bay of the Ross Sea (Capodaglio et al., 1998) and Zn in the Atlantic sector of the Southern Ocean (Baars et al., 2010; Croot et al., 2010). This results in higher concentrations of bioavailable Zn in shallow waters and with that a lessened contribution to Cd:PO3−4 kink for-mation by the Zn mechanism. This speciation effect is also consistent with dissolved Zn:PO3−4 ecological stoichiome-tries found in the Ross Sea as well as the Southern Ocean
(Sunda and Huntsman, 2000) being higher than the subarc-tic Pacific (Table 2). In addition, the observation of grad-ually decreasing metal:phosphate ratios higher in the water column (Fig. 11c and d) is more compatible with Elderfield and Rickaby’s (2000) assertion for a Rayleigh-type fraction model than the simplistic two-slope kink model. Together these observations, in particular our analysis of Co:PO3−4 ratios, suggest that the excess metal:P stoichiometry mech-anism may be an important contributor in metal:phosphate kink formation in the oceans.