www.biogeosciences.net/14/1021/2017/ doi:10.5194/bg-14-1021-2017
© Author(s) 2017. CC Attribution 3.0 License.
Quantification of multiple simultaneously occurring
nitrogen flows in the euphotic ocean
Min Nina Xu1, Yanhua Wu2, Li Wei Zheng1, Zhenzhen Zheng1, Huade Zhao3, Edward A. Laws4, and Shuh-Ji Kao1
1State Key Laboratory of Marine Environmental Science, Xiamen University, Xiamen, China
2Shenzhen Marine Environment Monitoring Center Station, State Oceanic Administration, Shenzhen, China 3National Marine Environmental Monitoring Center, Dalian, China
4Environmental Sciences Department, School of the Coast & Environment, Louisiana State University, Baton Rouge, USA
Correspondence to:Shuh-Ji Kao ([email protected]) Received: 17 July 2016 – Discussion started: 2 August 2016
Revised: 13 February 2017 – Accepted: 14 February 2017 – Published: 3 March 2017
Abstract. The general features of the N cycle in the sunlit region of the ocean are well known, but methodological diffi-culties have previously confounded simultaneous quantifica-tion of transformaquantifica-tion rates among the many different forms of N, e.g., ammonium (NH+4), nitrite (NO−2), nitrate (NO−3), and particulate/dissolved organic nitrogen (PN/DON). How-ever, recent advances in analytical methodology have made it possible to employ a convenient isotope labeling technique to quantify in situ fluxes among oft-measured nitrogen species within the euphotic zone. Addition of a single 15N-labeled NH+4 tracer and monitoring of the changes in the concentra-tions and isotopic composiconcentra-tions of the total dissolved nitro-gen (TDN), PN, NH+4, NO−2, and NO−3 pools allowed us to quantify the15N and14N fluxes simultaneously. Constraints expressing the balance of 15N and 14N fluxes between the different N pools were expressed in the form of simultane-ous equations, the unique solution of which via matrix inver-sion yielded the relevant N fluxes, including rates of NH+4, NO−2, and NO−3 uptake; ammonia oxidation; nitrite oxida-tion; DON release; and NH+4 uptake by bacteria. The matrix inversion methodology that we used was designed specifi-cally to analyze the results of incubations under simulated in situ conditions in the euphotic zone. By taking into consider-ation simultaneous fluxes among multiple N pools, we min-imized potential artifacts caused by non-targeted processes in traditional source–product methods. The proposed isotope matrix method facilitates post hoc analysis of data from on-deck incubation experiments and can be used to probe effects of environmental factors (e.g., pH, temperature, and light) on multiple processes under controlled conditions.
1 Introduction
Nitrogen (N), which is an essential element for all organ-isms, regulates productivity in the surface waters of many parts of the ocean (Falkowski, 1997; Zehr and Kudela, 2011; Casciotti, 2016). As a limiting nutrient in the euphotic zone, nitrogen rapidly interconverts among five major N compart-ments: particulate organic nitrogen (PN), dissolved organic nitrogen (DON), ammonium (NH+4), nitrite (NO−2), and ni-trate (NO−3)(Fig. 1). Studies of the rates of transformation of N in the marine N cycle have had a major impact on our current understanding of the coupling of autotrophic and het-erotrophic processes involving carbon and nitrogen as well as the efficiency of the biological pump (Dugdale and Goering, 1967; Caperon et al., 1979; Harrison et al., 1992; Bronk and Glibert, 1994; Dore and Karl, 1996; Laws et al., 2000; Yool et al., 2007). Such information has also facilitated evaluation of ecosystem functions. However, those studies have typically involved inventory and isotope tracer methods that quantified the rates of only one or a few fluxes (Ward, 2008, 2011; Lip-schultz, 2008, and references therein). The dynamic nature and complexity of the N cycle make simultaneous resolution of the rates of more than a few of the important fluxes a chal-lenging task.
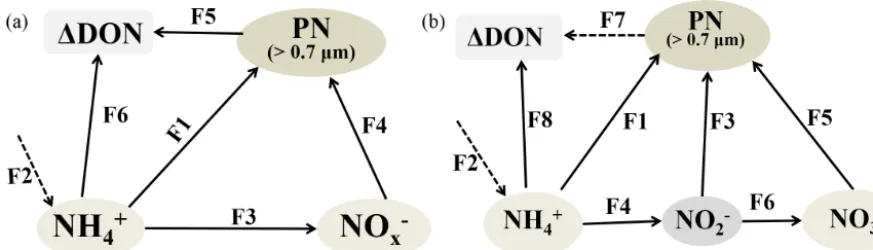
Figure 1.Model schemes with the most fundamental nitrogen transformation processes in(a)low- and(b)high-nutrient aquatic environ-ments. Arrows represent the transfer flux/rate from the reactant to product pool. The structure and inter-exchanges in the high-nutrient case(b)are the same as in(a), except that NO−x is divided into NO−2 and NO−3.
Hatton, 1971; Pakulski et al., 1995; Ward, 2011). However, failure to account for other processes may bias the results. For example, the concentration of ammonium is controlled simultaneously by removal via phytoplankton uptake (PN as the product), nitrification (nitrite/nitrate as the product), and bacterial metabolism (operationally defined DON as prod-uct) and by additions via remineralization from heterotrophic bacterial metabolism, zooplankton excretion, and viral lysis. Similarly, the products of nitrification (NO−x)may be simul-taneously consumed by phytoplankton.
The 15N-labeled tracer technique has been widely used as an assay for specific nitrogen processes since the emer-gence of isotope ratio mass spectrometry (IRMS). For exam-ple, the addition of 15N-labeled nitrate has been applied to estimate new production (Dugdale and Goering, 1967; Chen, 2005; Painter et al., 2014). Likewise, by incubating water to which15NH+4 has been added, the nitrification rate (15NO−3 as product; e.g., Newell et al., 2013; Hsiao et al., 2014; Peng et al., 2016) and ammonium uptake rate (15NPNas product;
e.g., Dugdale and Goering, 1967; Dugdale and Wilkerson, 1986; Bronk et al., 1994, 2014) can be measured via incu-bations in the dark and light, respectively. However, the in-terpretation of isotope labeling experiments is confounded by the same problems as the inventory method, i.e., multi-ple processes that occur simultaneously impact the concen-trations of substrates and products in the incubation bottle. In fact, those transformations among pools have significant implications for biogeochemical cycles. For instance, Yool et al. (2007) synthesized available global data and concluded that the fractional contribution of nitrate derived from nitrifi-cation to nitrate uptake can be as high as 19–33 % in the eu-photic zone. However, integration of the relevant rates over a light–dark cycle has been confounded by the fact that ni-trate uptake rates have typically been determined during the photoperiod, whereas nitrification rates have been measured under dark conditions (e.g., Grundle et al., 2013). Nitrate up-take may occur in the dark, but not necessarily at the same rate as in the light (Laws and Wong, 1978), and nitrification
is inhibited by light (Dore and Karl, 1996). To integrate rates over the light–dark cycle, 24 h incubations have been used to compensate for the diel cycle of light-sensitive processes (Beman et al., 2012). Yet, interpretation of the results of 24 h incubations may be confounded by artifacts due to transfers of 15N and14N among pools. A new method is needed to overcome these problems.
Marchant et al. (2016) have reviewed recent methodolog-ical advances using15N-labeling substrates combined with nanoSIMS, FISH, or HISH in marine N-cycle studies. These methods provide qualitative information about N transfers at the cellular and molecular level but do not quantify rates at the community level. Elskens et al. (2005) conducted a com-prehensive review of oft-used models for rate derivation and concluded that oversimplified models may lead to biased re-sults if their underlying assumptions are violated. However, overly complex models risk misinterpreting random noise as relevant processes. To address this concern, De Brauwere et al. (2005) proposed a model selection procedure. More re-cently, Pfister et al. (2016) applied an isotope tracer tech-nique and mass conservation model to explore nitrogen flows among dissolved nitrogen pools (NH+4, NO−2, and NO−3)in tidal pools and found that benthic macrobiota played an im-portant role in regulating remineralization rates. They also found that dilution effects significantly biased the results ob-tained with source–product models. For the euphotic zone, where competing processes co-occur, an innovative and con-venient method is needed to determine the rates of multiple N fluxes from the results of simulated in situ incubations.
newly proposed method. To demonstrate the applicability of the method, we conducted incubation experiments with low-nutrient water from the western North Pacific and with high-nutrient coastal water off the southeastern China coast. As a result of recent advances in the analytical methods for mea-suring the concentrations and isotopic compositions of vari-ous nitrogen species, we were able to use this isotope matrix method to quantify the in situ fluxes of N in the euphotic zone.
2 Isotope matrix method
2.1 Framework of the interconnections among nitrogen pools
Figure 1 shows the transformations of N among NH+4, NO−2, NO−3, PN, and DON in an aerobic euphotic zone. The PN was operationally defined as the particulate organic nitrogen trapped on a GF/F filter (> 0.7 µm). Dissolved inorganic ni-trogen (DIN) and DON were equated to the inorganic and organic nitrogen, respectively, in the dissolved fraction that passed through a polycarbonate membrane with a 0.22 µm pore size. Because DON includes the N in numerous dis-solved organic N compounds, including unidentified organ-ics, urea, amino acids, amines, and amides, it represents the “bulk” DON and was calculated by subtracting the concen-trations of NH+4, NO−2, and NO−3 (DIN) from the total dis-solved N (TDN).
We used two different models to analyze our data: a low-nutrient model to represent the open ocean and a high-nutrient model to represent estuarine and coastal environ-ments (Fig. 1a and b). In the high-nutrient model, NH+4, NO−2, and NO−3 were assumed to co-exist. The rationale for the two model structures is as follows.
The consumption of reactive inorganic nitrogen (NH+4, NO−2, and NO−3)is dominated by photosynthetic uptake by phytoplankton (F1 and F4 in Fig. 1a; F1, F3, and F5 in
Fig. 1b). Heterotrophic bacteria may also play an impor-tant role in NH+4 assimilation (Laws, 1985; Middelburg and Nieuwenhuize, 2000; Veuger et al., 2004). We took het-erotrophic bacterial assimilation of NH+4 into account as well (F6in Fig. 1a andF8in Fig. 1b) to explore its importance.
Though NO−2 may be released during NO−3 uptake (Lomas and Lipschultz, 2006), little NO−2 production from NO−3 was detected by Santoro et al. (2013). Nitrate assimilation may be inhibited in aerobic water, especially in estuaries and coastal seas where the NH+4 concentration is high, and in the absence of nitrate uptake, there is no release of nitrite. Thus, nitrite re-lease was ignored in our model. Due to DIN assimilation by phytoplankton, the PN pool may increase, but DON may be released during assimilation (F5in Fig. 1a andF7in Fig. 1b)
as noted by Bronk et al. (1994), Bronk and Ward (2000), and Varela et al. (2005). The size of the NH+4 pool is in-creased by remineralization (F2 in both Fig. 1a and b) and
decreased by nitrification. The latter consists of two basic steps: ammonium oxidation by archaea/bacteria (AOA/AOB) to nitrite (F4 in Fig. 1b) and nitrite oxidation to nitrate by
nitrite-oxidizing bacteria (NOB) (F6 in Fig. 1b). Although
recent studies have revealed a single microorganism that can completely oxidize NH+4 to NO−3 (comammox) (Daims et al., 2015; van Kessel et al., 2015), the importance of comammox in the marine environment remains unclear.
Specific mechanisms or processes such as grazing and vi-ral lysis may alter the concentrations of NH+4, nitrite, and DON. However, the scope of this study is to determine the nitrogen fluxes among the often-measured and operationally defined nitrogen pools. The organisms that mediate the rele-vant fluxes are not specifically included in the model. Thus, the results of specific processes such as grazing and viral lysis have been incorporated into the paradigm depicted in Fig. 1.
2.2 Analytical methods to determine the amounts of
15N/14N in various pools
To trace the15N movement among pools, our isotope ma-trix method couples the15N-labeling and inventory methods by considering changes in both concentrations and isotopic compositions. Analytical methods to determine the concen-trations and isotopic compositions of both high and low lev-els of inorganic/organic nitrogen are in most cases well estab-lished and have been reported elsewhere. We determined all the relevant concentrations and isotopic compositions with the exception of the isotopic composition of NH+4.
Concentrations of NH+4 higher than 0.5 µM were measured manually by using the colorimetric phenol hypochlorite technique (Koroleff, 1983). Nanomolar NH+4 concentrations were measured by using the fluorometrico-phthaldialdehyde (OPA) method (Zhu et al., 2013). Concentrations of NO−2 and of NO−x (NO−2+NO−3)were determined with the chemi-luminescence method following the protocol of Braman and Hendrix (1989). The detection limits of NO−2 and NO−x were both∼10 nmol L−1, and the corresponding relative precision was better than 5 % within the range of concentrations that we measured. By using persulfate as an oxidizing reagent, we oxidized TDN and PN separately to nitrate (Knapp et al., 2005) and then measured the nitrate by using the analytical method for NO−x described above.
We determined theδ15N of NO−2 with the azide method by following the detailed procedures in McIlvin and Alta-bet (2005). Theδ15N of NO−x was determined by using a distinct strain of bacteria that lacked N2O reductase
activ-ity to quantitatively convert NO−x to nitrous oxide (N2O),
which we then analyzed by IRMS (denitrifier method; Sig-man et al., 2001; Casciotti et al., 2002). The isotopic com-position of NO−3 was determined from isotope mass balance (NO−
x −NO
−
2)or measured by the denitrifier method after
and Sigman, 2009). To determine theδ15N of TDN and PN, both species were first converted to NO−3 with the denitri-fier method, and then theδ15N of the NO−3 was determined as described above. The detection limit of δ15NPN can be
reduced to the nanomolar level (absolute amount of nitro-gen), which is significantly lower than the detection limit us-ing high-temperature combustion with an elemental analyzer connected to an IRMS.
The most popular way to determine the N isotopic com-position of NH+4 is the “diffusion method”, which involves conversion of dissolved NH+4 to NH3gas by raising the
sam-ple pH to above 9 with magnesium oxide (MgO) and sub-sequently trapping the gas quantitatively as (NH4)2SO4 on
a glass fiber (GF) filter; the isotope ratios of the 15N/14N are then measured using an elemental analyzer coupled with an IRMS (Holmes et al., 1998; Hannon and Böhlke, 2008). Alternatively, after removing the preexisting NO−2 from the seawater samples using sulfamic acid, NH+4 is first quan-titatively oxidized to NO−2 by hypobromite (BrO−) at pH
∼12 (BrO−oxidation method), and the protocol of McIlvin
and Altabet (2005) is then used to reduce the NO−2 to N2O
(Zhang et al., 2007). Unfortunately, neither of these meth-ods has been established in our lab yet. The isotope matrix method requires the isotopic composition of NH+4 as well, but this requirement can be circumvented by making certain assumptions, as illustrated in our case studies below.
We estimated the amount of14N and15N atoms in every individual pool for which we knew the concentration and δ15N (δ15N ‰= [(Rsample−Ratm N2) / Ratm N2]×1000). By
assuming the15N content of standard atmospheric nitrogen to be 0.365 % (Coplen et al., 1992), we calculated Rsample
(15N/14N). By definingrsample as15N/(14N+15N), we
di-rectly derived the15N and14N concentrations of all forms of N, with the exception of NH+4 and DON. Thervalue of the NH+4 was assumed to equal either its initial value or an arbi-trarily chosen fraction thereof, and the15N and14N content of the NH+4 was then determined.
2.3 Formation of matrix equations
In this isotope matrix method, we added a limited amount of
15NH+
4 into incubation bottles at the very beginning and then
monitored the changes in15N and14N in the measured pools every few hours. We assumed isotopic mass balance at every time point in the incubation bottle. In other words, the sum of the variations in the total N,15N, and14N concentrations was zero for any time interval. The fluxes of 15N and14N were therefore equal to the total flux multiplied byrsubstrate
and (1−rsubstrate), respectively. Although we did not consider
isotope fractionation, it could have been introduced into the equations by dividing the14N flux by the ratio of the specific rate constants of14N and15N to obtain the flux of15N.
According to mass balance, the net changes in the 15N (or14N) concentration of an individual N pool in a time
in-terval are determined by the inflow and outflow of15N (or
14N) (see Fig. 1 and Eqs. 1–14 below). In the low-nitrogen
case, the changes in the 15N concentrations of the NH+4, NO−x, and PN pools were expressed by Eqs. (1), (2), and (3), respectively. Similarly, the temporal dependence of14 N-NH+4,14N-NO−x, and 14N-PN were expressed by Eqs. (4), (5), and (6), respectively. The mean rate of change in the nitrogen pool, i.e., the left side of each equation, was de-termined from the data at time zero (t0) and the first time
point (t1). For example, when the sampling time interval was
short, 1[14NH+4]/ 1t at the first time point was approxi-mately {[14NH+4]t1−[14NH+4]t0}/(t1−t0), where the
sub-scripts indicate the times at which the concentrations were measured. Thervalue in each equation was the average of thervalues for the pool at time zero and the first time point. 115NH+4
1T =F2×0.00366−F1×rNH+4 (1) −F3×rNH+
4
−F6×rNH+
4
115NO−
x
1T =F3×rNH+4
−F4×rNO−x (2)
115PN
1T =F1×rNH+4
+F4×rNO−
x −F5×rPN (3) 114NH+
4
1T =F2×(1−0.00366)−F1×(1−rNH+4) (4) −F3×(1−rNH+
4)
−F6×(1−rNH+
4)
114NO−x
1T =F3×(1−rNH+4)
−F4×(1−rNO−
x) (5) 114PN
1T =F1×(1−rNH+4)
+F4×(1−rNO−
x) (6)
−F5×(1−rPN)
The time series in this study lasted for 24 h. However, we used only the first two time points for the rate calculations because we felt those rates would be closest to the instan-taneous in situ rates of the original samples. Although the isotope matrix method may be applied to longer time in-tervals, rates may vary as a result of substrate consumption and/or community change. Relatively short-term incubations are therefore advisable (see below).
Because the total number of equations and unknowns is equal, a unique solution can be obtained via matrix inversion for the low-nutrient model.
In high-nutrient cases, analogous equations (Eqs. 7–14) can be constructed to describe the fluxes between NH+4, NO−2, NO−3, and PN (Fig. 1b).
115NH+ 4
1T =F2×0.00366−F1×rNH+4 (7) −F4×rNH+
4
−F8×rNH+
115NO−2
1T =F4×rNH+4
−F3×rNO−2 −F6×rNO2− (8)
115NO−3
1T =F6×rNO−2
−F5×rNO−
3 (9)
115PN
1T =F1×rNH+4
+F3×rNO−
2 (10)
+F5×rNO−
3
−F7×rPN
114NH+4
1T =F2×(1−0.00366)−F1×(1−rNH+4) (11) −F4×(1−rNH+
4)
−F8×(1−rNH+
4)
114NO−2
1T =F4×(1−rNH+4)
−F3×(1−rNO−2) (12)
−F6×(1−rNO−2)
114NO−3
1T =F6×(1−rNO−2)
−F5×(1−rNO−3) (13)
114PN
1T =F1×(1−rNH+4)
+F3×(1−rNO−2) (14)
+F5×(1−rNO−3)−F7×(1−rPN)
A unique solution can again be obtained via matrix inversion because the number of equations and unknowns are equal.
In the above matrix equations, the value ofrNH+
4, which we
did not measure in this study, was needed to obtain a solution. To address this issue, we assumed various degrees of rem-ineralization to test the effect of isotope dilution (NH+4 addi-tion) on our calculated fluxes. We reducedrNH+
4 values of the
24 h incubation. TherNH+
4 for remineralization (F2) was
as-sumed to be constant (0.00366) and equal constant rates that led to total reductions ofrNH+
4 by 0, 1, 10, 20, or 50 % by the
end. The value ofF2coupled with the assumedrNH+4 values
allowed us to resolve rates under different remineralization scenarios, and the derivedF2was introduced into a STELLA
model for extrapolation purposes (see below). We compared the observed and remineralization-associated simulations to elucidate the effect of remineralization on the calculated rates for the time series incubations.
2.4 Validation by STELLA
The initial rates are of particular interest because they are presumably most similar to the in situ rates at the time the sample was collected. The initial rate is here distinguished from rates derived from incubations that extended beyond time point t1. To evaluate the applicability of the
matrix-derived initial rate, we used STELLA 9.1.4 software (Isee systems, Inc.) to construct box models that were consis-tent with the scenarios depicted in Fig. 1. The constructed STELLA model contained two modules (Figs. S1 and S2 in the Supplement), one for15N and the other for 14N. These
two modules were connected through the15N atom % (rN), which was a parameter measured in the incubation experi-ment. A model run was initialized with the measured values of the nitrogen pools at time zero, and the model then pro-jected the values of those pools as a continuous function of time. Because the rates based on the first two time points might not accurately represent the behavior of the system throughout the full time course due, for example, to changes in substrate concentrations and the composition of the mi-crobial community, this extrapolation using the initial rates amounted to a test of the hypothesis that the rates did not change.
We assumed first-order reaction kinetics in both the low-nutrient and high-low-nutrient cases. The initial rate constant “k” could therefore be derived by dividing the matrix-derived fluxF byC, the average substrate concentration during the first two time points. After the concentrations of15N and14N were initialized in every pool, the model ran for 24 h using the matrix-derived short-termkvalues. As depicted in Fig. 1, all the monitored N pools were regulated byF, which was assumed to be concentration dependent (Figs. S1 and S2). The output of the model included the time courses of the15N and14N concentrations and the15N atom % (rN) of each N species. Through this analysis, we could observe the tempo-ral evolution of the isotopic composition of the various N pools.
2.5 Study sites and incubation experiments
The incubation experiments were conducted in two environ-ments with very different nutrient levels. The low-nutrient study was conducted on-deck of the R/VDongfanghong 2
on a cruise to the western North Pacific (WNP) (33.3◦N, 145.9◦E) in the spring of 2015. The site of the high-nutrient study was Wuyuanwan Bay (WYW) (24.5◦N, 118.2◦E) in the southern coast of China.
The water samples at the WNP station were collected using a 24-bottle rosette sampler. The sampling depth was 25 m, at which the light intensity was 12 % of the surface ir-radiance. Two pre-washed 10 L polycarbonate carboys (Nal-gene, USA) were used for the incubation. A total of 1.5 mL of 200 µM15N-labeled NH4Cl tracer containing 98 atom %15N
(Sigma-Aldrich, USA) was injected into each incubation bot-tle separately to achieve a final concentration of 30 nM. The incubation was carried out immediately with a constant sim-ulated light intensity of 35 µmol photons m−2s−1in a
ther-mostatic incubator (GXZ-250A, Ningbo) at the in situ tem-perature.
Figure 2.The observational data in the low-nutrient case for(a)[NH+4],(b)[NO−x],(c)[PN],(d)[TDN],(e)δ15N-NO−x, and(f)δ15N-PN. The regular and inverse open triangles represent the paralleled samples and the analytical errors are shown.
site to study the dynamic transformations that characterize the coastal nitrogen cycle.
The WYW samples were taken on 19 January 2014 from water depths of 0.3 and 2.3 m, where the light intensities were 80 and 2 %, respectively, of the surface water irra-diance. Duplicate water samples were collected from each depth by using submersible pump to fill pre-washed 10 L polycarbonate bottles (Nalgene, USA).15N-labeled NH4Cl
(98 atom %15N, Sigma-Aldrich, USA) was added to the in-cubation bottles to a final concentration of 1 µM (∼4 % of the ambient concentration). The incubations were carried out im-mediately in the field. Neutral density screens that allowed 80 and 2 % light penetration were used to simulate the light in-tensities at 0.3 and 2.3 m, respectively. The temperature was maintained at∼13.7◦C by continuously pumping seawater through the incubators.
The sample at the first time point (t0) was taken
imme-diately after tracer addition. Subsequent samples were taken at approximately 2–4 h intervals for DIN and PN analyses. An aliquot of 200 mL was filtered through a 47 mm poly-carbonate membrane filter with a 0.22 µm pore size (Milli-pore, USA). The filtrates were frozen at−20◦C for chemical analyses in the lab. Particulate matter was collected by filter-ing 500 mL seawater through pre-combusted (450◦C for 4 h) 25 mm GF/F filters (Whatman, GE Healthcare, USA) at a pressure of < 100 mm Hg. The GF/F filters were freeze-dried and stored in a desiccator prior to analysis of PN concentra-tions and15N atom %.
3 Results
3.1 Ambient conditions and initial concentrations The water temperature and salinity at a depth of 25 m in the WNP were 18.4◦C and 34.8, respectively. The dis-solved oxygen (DO) was 7.3 mg L−1. The concentrations of NH+4, NO−x, and phosphate were 113±5, 521±18, and 74±2 nmol L−1, respectively.
The water temperature and salinity throughout the water column of the WYW were 13.5±0.1◦C and 29.5±0.1, re-spectively. The DO saturation fell in the range 135–140 %. The concentrations of nitrogenous species were relatively high. The inorganic nutrient concentrations were 30.9±0.7 for NO−3, 22.3±4.3 for NH+4, 5.4±0.2 for NO−2, and 1.5±0.1 µmol L−1for phosphate. The PN concentration was 9.3±0.7 µmol L−1.
3.2 Time courses of incubations 3.2.1 Low-nutrient case in the WNP
The observed patterns of change in the bulk NH+4, NO−x, PN, and TDN concentrations and theδ15N of NO−
N-Figure 3.The observational data in the high-nutrient case for(a)[NH+4],(b)[NO−2],(c)[NO−3],(d) [PN],(e)[TDN],(f)[PN+TDN], (g)δ15N-NO−2,(h)δ15N-NO−3, and(i)δ15N-PN. The light and dark red diamonds represent the paralleled samples in 80 % sPAR case and the black regular and inverse open triangles represent the paralleled samples in 2 % sPAR case. Bars represent analytical errors.
PN exhibited great changes, increasing from 46.8±0.2 to 6950±314 ‰ (Fig. 2f).
3.2.2 High-nutrient case in the WYW
The time series of observational parameters for samples from depths of 80 and 2 % of surface PAR (sPAR) ex-hibited similar trends during the incubation (Fig. 3). Dur-ing the course of the incubation, NH+4 decreased sig-nificantly and continuously from 26.6±0.1 (initial con-centration) to 17.4±0.1 µmol L−1. The mean reduction
rate was 0.63 µmol L−1h−1 for the 80 % sPAR sample (Fig. 3a). The NH+4 concentration of 2 % sPAR sample decreased more slowly from 24.6±0.1 (initial concentra-tion) to 18.2±1.0 µmol L−1 with a mean reduction rate of 0.47 µmol L−1h−1 (Fig. 3a). NO−3 in 80 and 2 % sPAR samples decreased from 30.1±0.1 to 28.3±0.1 µmol L−1 and from 31.1±0.1 to 29.7±0.1 µmol L−1, respectively (Fig. 3c). Overall, the nitrate reduction rates were much lower than the NH+4 reduction rates. Compared to nitrate, NO−2 displayed even slower rates of decline, yet the rate was significantly higher at 80 % sPAR than at 2 % sPAR (Fig. 3b). Similar to the low-nutrient case, PN increased steadily
from 8.8±0.1 to 17.7±0.9 µmol L−1, with a mean rate of 0.61 µmol L−1h−1 at 80 % sPAR and from 9.9±0.1 to 16.0±2.0 µmol L−1with a mean rate of 0.44 µmol L−1h−1 at 2 % sPAR (Fig. 3d). The rates of increase in the PN con-centration were very close to the rates of decrease in NH+4, the indication being that ammonium was the major nitro-gen source for growth. The TDN concentration decreased from 78.7±1.6 to 68.4±0.1 µmol L−1and from 72.8±2.5 to 67.1±0.8 µmol L−1 at 80 and 2 % sPAR, respectively
(Fig. 3e).
[image:7.612.126.471.66.372.2]3.3 Solutions of the matrix equation and STELLA extrapolation
3.3.1 Low-nutrient case
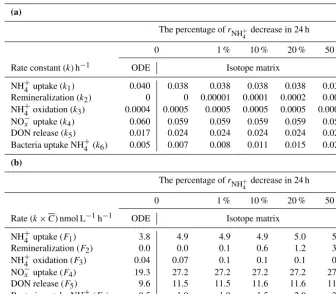
The matrix-derived rate constants (ki) and rates (Fi) are shown in Table 1a and b, respectively. Under the no-remineralization condition (i.e., rNH+
4
de-creased 0 % within 24 h), NO−x uptake (k4=0.059 h−1;
F4=27.2 nmol L−1h−1)was the highest among all forms of
inorganic nitrogen in terms of flux, followed by NH+4 uptake (k1=0.038 h−1; F1=4.9 nmol L−1h−1) and DON release
(k5=0.024 h−1; F5=11.5 nmol L−1h−1). NH+4 uptake by
bacteria (k6=0.007 h−1;F6=1.0 nmol L−1h−1)was much
lower than that by phytoplankton. The rate constant for nitrification (k3=0.0005 h−1) was the lowest among all
fluxes (F3=0.07 nmol L−1h−1).
By introducing the initial 15N and14N concentrations of NH+4, NO−x, PN, and DON and the calculated rate constants (k1tok6) into STELLA (Fig. S1 in the Supplement), we
ob-tained a full time courses for all parameters (Fig. 4). Gener-ally, the model outputs fitted well with the measured values, except for the last time point for PN, the associated15N con-centration,δ15N, andrN (Fig. 4c, k and o). The fact that the rates during the first time interval generally predicted the sub-sequent observations rather well demonstrated a good pre-dictive performance with the matrix method initial rate. Be-cause the concentrations of both ammonium and NO−x were described well during the 24 h experiment, the extra PN that was not well described in observations after 12 h likely re-flected the influence of an additional nitrogen source, i.e., dissolved organic nitrogen that was utilized by phytoplank-ton (see discussion below) when inorganic nitrogen reached threshold levels (Sunda and Ransom, 2007).
In the test runs with rNH+
4 reduction by a total of 1, 10,
20, and 50 %, we found that the NH+4 consumption rates (k1
andk6) increased as the regeneration (k2) increased (Table 1).
As indicated in previous studies, such regeneration-induced isotope dilution indeed altered the original results (Table 1 and Fig. 4). Specifically, greater NH+4 regeneration resulted in larger differences between the three PN-associated val-ues (15N-PN,δ15N-PN, andrPN)and the STELLA-projected
data (Fig. 4c, k, and o). The dilution effect was more signif-icant after 12 h of incubation. In contrast, the effect ofrNH+
4
on parameters associated with NO−x was trivial (Fig. 4b, f, j, n and r). The comparison between the simulation and observa-tion suggested that NH+4 regeneration needs to be considered for PN (i.e., uptake) when the remineralization rate is high and the incubation is longer than 12 h. Besides remineraliza-tion, discrepancies along the time course might possibly be caused by changes in the composition of the microbial com-munity as the incubation continues.
3.3.2 High-nutrient cases
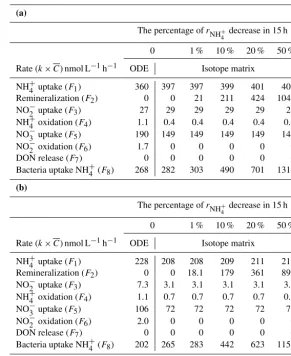
The results at 80 and 2 % sPAR on the assumption of a fixedrNH+
4 are shown in Table 2a and b, respectively. For the
80 % sPAR sample, the NH+4 uptake by phytoplankton (F1,
397 nmol L−1h−1)and by bacteria (F8, 282 nmol L−1h−1)
were much higher than the other rates and were followed by the NO−3 uptake rate (F5, 149 nmol L−1h−1). The NO−2
up-take (F3) rate was 29 nmol L−1h−1, much lower than that
of NH+4 and NO−3. The ammonia oxidation rate (F4) was
0.4 nmol L−1h−1, and the nitrite oxidation rate (F6) was zero
(Table 2a). Because this incubation was conducted in winter with low temperature and at 80 % sPAR, low rates of ammo-nium and nitrite oxidation were reasonable because both ni-trifiers and NOB are sensitive to light (e.g., Olson, 1981a, b; Horrigan et al., 1981; Ward, 2005; Merbt et al., 2012; Smith et al., 2014). The DON release rate by phytoplankton (F7)
was zero in this case.
In comparison, all the rates at 2 % sPAR showed a very similar pattern (Table 2b). The only difference was that all the uptake rates were lower at 2 % sPAR, except for ammonia oxidation, which was higher in the low light.
By introducing initial concentrations and calculated rate constants (k1–k8) into the STELLA model (Fig. S2), we
ob-tained a time series of15N and14N concentrations and therN values for NH+4, NO−2, NO−3, PN, and DON (Fig. 5). In gen-eral, the modeled and measured values remained consistent throughout the 15 h incubation, demonstrating the capability of the isotope matrix method.
Similar to the low-nutrient case, we evaluated the effect of regeneration (see Table 2 and Fig. 5a and b). Because am-monium uptake was the dominant process, changes in the PN pool were more significant in comparison with the other pools (Fig. 5d, n, and s). We found again that asF2increased,
F1andF8increased to maintain a constant reduction of the
measured NH+4 concentration (Table 2). Similar to the low-nutrient case, as regeneration increased, the projected course of 15N-PN deviated more from observations, and the turn-ing point also appeared earlier, resultturn-ing in a larger curvature ofr-PN andδ15N-PN (Fig. 5d and s). This modeling exer-cise confirmed the influence of the isotope dilution effect. However, the effect was insignificant in the early part of the incubation.
4 Discussion
4.1 Method comparisons
4.1.1 Model structure and rate derivation
Dug-Figure 4.The observed and STELLA-derived values in the low-nutrient case for(a)[15NH+4],(b)[15NO−x],(c)[15N-PN],(d)[15N-DON], (e)[14NH+4],(f)[14NO−x],(g)[14N-PN],(h)[14N-DON],(i)rNH+4,(j)rNO−x,(k)rPN,(l)rDON,(m)δ
15N-NH+
4,(n)δ15N-NO −
x,(o)δ15 N-PN,(p)δ15N-DON,(q)[NH+4],(r)[NO−x],(s)[PN], and(t)[DON]. The black regular and inverse open triangles represent the paralleled observed values; the black, green, blue, magenta, and pink solid lines represent the STELLA model simulations whenrNH+
4
[image:9.612.61.542.67.633.2]Table 1.The isotope matrix results for(a)the specific rates and(b)average rates of N processes in the low-nutrient case during the first interval under differentrNH+
4 variation conditions. In addition, all N transformation rates via ODE following Pfister et al. (2016) on the
assumption of no remineralization were estimated for comparison. Note:rNH+
4 variation was manipulated artificially by decreasingrNH
+
4
values at a constant reduction rate and the total reduction ofrNH+
4
was 0, 1, 10, 20, and 50 % of the full time span (24 h) of incubation.
(a)
The percentage ofrNH+
4 decrease in 24 h
0 1 % 10 % 20 % 50 %
Rate constant (k) h−1 ODE Isotope matrix
NH+4 uptake (k1) 0.040 0.038 0.038 0.038 0.038 0.039
Remineralization (k2) 0 0 0.00001 0.0001 0.0002 0.001
NH+4 oxidation (k3) 0.0004 0.0005 0.0005 0.0005 0.0005 0.0005
NO−x uptake (k4) 0.060 0.059 0.059 0.059 0.059 0.059
DON release (k5) 0.017 0.024 0.024 0.024 0.024 0.024
Bacteria uptake NH+4 (k6) 0.005 0.007 0.008 0.011 0.015 0.028
(b)
The percentage ofrNH+
4
decrease in 24 h
0 1 % 10 % 20 % 50 %
Rate (k×C) nmol L−1h−1 ODE Isotope matrix
NH+4 uptake (F1) 3.8 4.9 4.9 4.9 5.0 5.1
Remineralization (F2) 0.0 0.0 0.1 0.6 1.2 3.0
NH+4 oxidation (F3) 0.04 0.07 0.1 0.1 0.1 0.7
NO−x uptake (F4) 19.3 27.2 27.2 27.2 27.2 27.2
DON release (F5) 9.6 11.5 11.5 11.6 11.6 11.8
Bacteria uptake NH+4 (F6) 0.5 1.0 1.0 1.5 2.0 3.7
dale and Wilkerson (1986) modified their rate equations fur-ther and highlighted the importance of short-term incuba-tions. Collos (1987) demonstrated that an equation based on the concentration of particles at the end of the experiment, rather than at the beginning, was more reliable when more than one N source was simultaneously incorporated by the phytoplankton. That is, the equation by Collos (1987) cor-rected for the bias caused by use of unlabeled multiple N sources.
Unlike the abovementioned equations, Blackburn (1979) and Caperon et al. (1979) proposed 15N isotope dilution models based on the substrate rather than the product. By measuring the isotope values and concentrations of the sub-strate (e.g., NH+4), both NH+4 consumption (DON and/or PN as product) and regeneration rates can be obtained. Glibert et al. (1982) further modified the isotope dilution method and calculated the uptake rate into the PN fraction by sub-stituting the exponential average of rNH+
4 at the beginning
and at the end of an incubation to correct for the isotope di-lution in the model of Dugdale and Goering (1967). Despite the methodological improvements, imbalance was often ob-served between the substrate reduction and the increase in the particulate phase in field studies. Laws (1985) introduced
a new model that considered the imbalance and calculated the “net uptake rate” (into PN). Later on, Bronk and Glib-ert (1991) revised Laws’ model on the basis of the model proposed by Glibert et al. (1982) to calculate the “gross up-take rate” (substrate incorporation into particulate organic nitrogen plus DON). None of the above models considered the mass balance at the whole system scale. Although rates were obtained via analytical solutions, the bias potential due to multiple fluxes was not completely resolved.
Table 2.The isotope matrix results for the rates of N processes in the high-nutrient case at the depth of(a)80 % sPAR and(b)2 % sPAR under differentrNH+
4 variation conditions. In addition, all N transformation rates via ODE following Pfister et al. (2016) on the assumption
of no remineralization were estimated for comparison. Note:rNH+
4 variation was manipulated artificially by decreasingrNH
+
4 values at a
constant reduction rate and the total reduction ofrNH+
4
was 0, 1, 10, 20, and 50 % of the full time span (15 h) of incubation.
(a)
The percentage ofrNH+
4 decrease in 15 h
0 1 % 10 % 20 % 50 %
Rate (k×C) nmol L−1h−1 ODE Isotope matrix
NH+4 uptake (F1) 360 397 397 399 401 408
Remineralization (F2) 0 0 21 211 424 1043
NO−2 uptake (F3) 27 29 29 29 29 29
NH+4 oxidation (F4) 1.1 0.4 0.4 0.4 0.4 0.4
NO−3 uptake (F5) 190 149 149 149 149 149
NO−2 oxidation (F6) 1.7 0 0 0 0 0
DON release (F7) 0 0 0 0 0 0
Bacteria uptake NH+4 (F8) 268 282 303 490 701 1314
(b)
The percentage ofrNH+
4
decrease in 15 h
0 1 % 10 % 20 % 50 %
Rate (k×C) nmol L−1h−1 ODE Isotope matrix
NH+4 uptake (F1) 228 208 208 209 211 216
Remineralization (F2) 0 0 18.1 179 361 895 NO−2 uptake (F3) 7.3 3.1 3.1 3.1 3.1 3.1
NH+4 oxidation (F4) 1.1 0.7 0.7 0.7 0.7 0.7
NO−3 uptake (F5) 106 72 72 72 72 72
NO−2 oxidation (F6) 2.0 0 0 0 0 0
DON release (F7) 0 0 0 0 0 0
Bacteria uptake NH+4 (F8) 202 265 283 442 623 1152
conducted by Pfister et al. (2016), who used parallel incuba-tions (15N labeled NH+4 and NO−3)in tidepools to measure multiple flows among benthic N, ammonium, nitrite, and ni-trate. In their experiment, six differential equations were con-structed based on mass and isotope balances and solved by using the ODE function of the R language. Because the N content of benthic algae was not measured due to sampling difficulties and spatial heterogeneity of biomass, a mass bal-ance at the whole system scale could not be achieved. Specif-ically, the rate of DON release could not be determined.
Compared with the methods or models mentioned above, the advantages of the isotope matrix method include (1) the potential biases caused by multiple flows were taken into consideration subject to the constraint that there be a mass balance at the system level; (2) one tracer addition was suffi-cient to quantify multiple in situ flows; parallel incubations, i.e., light and dark or15NH+4 and15NO−x, were not needed; (3) post hoc data processing was simple, and a unique
solu-tion can be obtained via matrix inversion; and (4) no extra laboratory work was necessary (see below).
4.1.2 Rate comparisons
In accord with Pfister et al. (2016), we estimated all N trans-formation rates using ordinary differential equations (ODEs) for the three cases on the assumption thatrNH+
4 was constant
sep-Figure 5.
arated by a few hours may be more convenient and realistic for instantaneous rate estimates.
Below, we present a comparison between our results and conventional source–product rate measurements (Col-los, 1987) of ammonium oxidation and uptake (Table 3). The matrix-derived NH+4 uptake rates for all of the experiments were consistent with the rates (difference < 8 %) from the tra-ditional source–product method when the final PN concen-tration was used in the calculation. The fact that the devia-tions were larger (13–21 %) when the initial PN was used is consistent with the conclusions of previous studies that esti-mates involving the final PN concentration are more reliable. The deviation could obviously be higher if the phytoplankton growth rate were higher.
In contrast, the end products of ammonium oxidation or nitrification are consumed by phytoplankton continuously in
the euphotic zone. In many cases, nitrate uptake has been shown to occur in both the light and dark (e.g., Dugdale and Goering, 1967; Lipschultz, 2001; Mulholland and Lo-mas, 2008). The significant consumption of end products (NO−x and NO−2)violates the assumption that underlies the source–product rate calculation. Therefore, the NH+4 oxida-tion/nitrification rate cannot be determined with a source– product model. Although phytoplankton consumption re-sulted in a net reduction of NO−x in all of our experi-ments, we were nevertheless able to determine NH+4 ox-idation/nitrification rates with the isotope matrix method (Figs. 2b, 3b, and c) (see Table 3).
[image:12.612.73.529.62.492.2]Figure 5.The observed and STELLA-derived values in the high-nutrient case: in the first part 80 % sPAR depth and in the second part 2 % sPAR depth for(a)[15NH+4],(b) [15NO−2],(c)[15NO−3],(d)[15N-PN],(e)[15N-DON],(f)[14NH+4],(g)[14NO−2],(h)[14NO−3], (i)[14N-PN],(j)[14N-DON],(k)rNH+
4
,(l)rNO−
2
,(m)rNO−
3
,(n)rPN,(o)rDON,(p)δ15N-NH+4,(q)δ15N-NO −
2,(r)δ15N-NO −
3,(s)δ15
N-PN,(t)δ15N-DON,(u)[NH+4],(v)[NO−2],(w)[NO−3](x)[PN], and(y)[DON]. The black regular and inverse open triangles represent the duplicate observational values; the black, green, blue, magenta, and pink solid lines represent the STELLA model simulations ofrNH+
4
decreases 0, 1, 10, 20, and 50 % in 15 h, respectively.
of 15NO−x was greater than the inflow. During dark incuba-tions, researchers may also assume insignificant NO−x con-sumption. However, a “net decrease in end product” is almost unavoidable when an incubation is conducted under simu-lated in situ light conditions to estimate ammonium oxida-tion. To address this consumption effect, Santoro et al. (2010, 2013) took NO−x removal into account and formulated a new equation that took account of the nitrification rate (F) and NO−x uptake rate (k). In accord with Santoro et al. (2010), we calculated the nitrification rate for the low-nutrient case via
a nonlinear least-squares curve-fitting routine in MATLAB by using the first three time points of the15N-NO−x /14 N-NO−x measurements. The calculated rate, 0.05 nmol L−1h−1 (Table 3), was∼30 % lower than the matrix-derived rate of 0.07 nmol L−1h−1. In contrast, the nitrate uptake rate
Table 3.Comparison of the NH+4 /NO−x uptake and NH+4 oxidation/nitrification rates derived from different methods.
Process Case Depth Isotope Rates Traditional Rates (m) Matrix based on method followed method Ref A∗ Ref B∗ Ref C∗ (this study)
(nmol L−1h−1)
NH+4 uptake Low nutrient 25 4.9 3.8 4.6
Nitrification Low nutrient 25 0.07 0.04 – 0.05 NO−x uptake Low nutrient 25 27.2 19.3 4.6 NH+4 uptake High−80 %sPAR 0.2 397 360 387
NH+4 oxidation High−80 %sPAR 0.2 0.4 1 – NH+4 uptake High−2 % sPAR 2.3 208 228 192 NH+4 oxidation High−2 % sPAR 2.3 0.7 1 –
∗Ref A represents rate calculation by ODE following Pfister et al. (2016). Ref B represents rate calculation following Collos (1987).
Ref C represents rate calculation following Santoro et al. (2010).
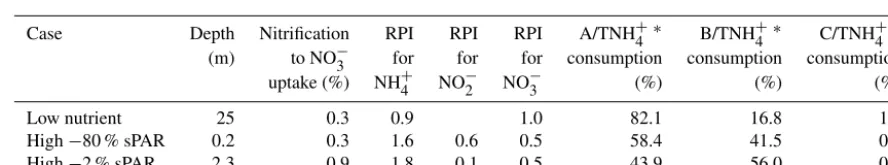
Table 4.The contribution of nitrification derived NO−x to NO−x uptake (%), N preference index, and the proportion of NH+4 consumption by phytoplankton, bacteria, and nitrifier to total NH+4 consumption in low- and high-nutrient cases.
Case Depth Nitrification RPI RPI RPI A/TNH+4 ∗ B/TNH+4 ∗ C/TNH+4 ∗ (m) to NO−3 for for for consumption consumption consumption uptake (%) NH+4 NO−2 NO−3 (%) (%) (%)
Low nutrient 25 0.3 0.9 1.0 82.1 16.8 1.2 High−80 % sPAR 0.2 0.3 1.6 0.6 0.5 58.4 41.5 0.1 High−2 % sPAR 2.3 0.9 1.8 0.1 0.5 43.9 56.0 0.1
∗A, B, and C represent NH+
4 utilized by phytoplankton, bacteria, and nitrifier, respectively. TNH
+
4 consumption represents total NH
+
4 consumption.
Surprisingly, when we introduced the values of F andk determined with the method of Santoro et al. (2010) into STELLA to generate time courses of variables, we found that the simulated values ofδ15NO−x andrNO−
x agreed well with those determined by the isotope matrix method (Fig. 4j and n). However, much slower decreasing trends were found for
15NO−
x,14NO
−
x, and NO
−
x (Fig. 4b, f, and r). Finally, we real-ized that the equation proposed by Santoro et al. (2010) was constrained only by the changes in the ratios rather than by the changes in the individual concentrations of 15NO−x and
14NO−
x. Thus, nonlinear curve fitting may provide a correct simulation only of the change in the ratio. This conclusion implies that the nitrate uptake rate derived from nonlinear curve fitting should be validated by the final concentration of nitrate, as was done by Santoro et al. (2013).
In summary, (1) accurate measurements of concentrations during a time series are vital for all kinds of transforma-tion rate estimates, including the isotope matrix method, and (2) the isotope matrix method can overcome various biases that impact estimates made with traditional methods.
4.2 Implications for nitrogen biogeochemical processes Results of use of the isotope matrix method suggest several conclusions with respect to biogeochemical processes.
4.2.1 Remineralization, regeneration, and community succession
The matrix solution was consistent with the model runs with variablerNH+4 at time points of no more than 12 h, the im-plication being that dilution effects were negligible during the early incubation period, at least in our studies. Dilution effects could be significant when remineralization is inten-sive and the incubation longer. Pfister et al. (2016) found that macrofauna (mussels) play an important role in remineral-ization. The fact that zooplankton in our water samples were not abundant might be a reason for the low remineralization rates in our short-term incubations.
[image:14.612.74.518.319.401.2]ac-tually observed phytoplankton succession. Our flow cytome-try data (Fig. S3) demonstrated that the number of living eu-karyotic cells (4 times higher thanSynechococcus) increased in the first 24 h and started to drop rapidly after 24 h. In contrast, the growth ofSynechococcuscontinued after 24 h, even though nitrogen concentrations dropped to a constantly low level. These observations suggest that the phytoplankton community was competing for nitrogen, and a major commu-nity shift started at around 24 h. After the time point at 12 h, the observed concentrations of14N and15N in the PN were higher than those projected by STELLA. The most intriguing phenomenon among PN-associated parameters was the addi-tional 15N, which could not have come from 15NH+4. The most likely source of nitrogen with enriched15N to support
Synechococcusgrowth was the nitrogen released from dead eukaryotes, which contained freshly consumed 15N tracer, rather than the ambient DON. More studies are needed to ex-plore nutrient thresholds for different phytoplankton species. Nevertheless, our results suggest that incubations must last no more than a few hours for nitrogen uptake studies in the oligotrophic ocean.
4.2.2 Evaluation of the contribution of nitrification to new production
Nitrification in the euphotic zone of the ocean drew little attention until recent years after molecular evidence led to the discovery of the widespread occurrence of ammonia-oxidizing archaea (AOA) (Francis et al., 2005; Santoro et al., 2010, 2013; Smith et al., 2014) and rate measurements based on isotopic studies (Ward, 2011; Santoro et al., 2010; Grundle et al., 2013; Smith et al., 2014). As mentioned in the Introduction, the conventional “new” production may have been overestimated 19–33 % on a global scale due to the ni-trate regenerated in the euphotic zone via nitrification. How-ever, a more realistic assessment of the fractional contribu-tion of nitrificacontribu-tion to NO−3 uptake can only be achieved when incubations are conducted in the same bottle under in situ light conditions instead of parallel incubations in the dark and light. The isotope matrix method is so far the most convenient and suitable method for evaluating the relative importance of co-occurring nitrification and new production in the euphotic zone. In all our experimental studies, the con-tributions of nitrification to new production were < 1 % (Ta-ble 4). This relatively low contribution was probably due to light inhibition of nitrifiers in the WNP and the low water temperature.
Nevertheless, light effects in our studies were signifi-cant. Light suppresses nitrification (Ward, 2005; Merbt et al., 2012; Peng et al., 2016). The NH+4 oxidation rate at 80 % sPAR was reduced by 36 % relative to the rate at 2 % sPAR. These results are consistent with current knowledge, although some recent evidence has shown that some taxa of marine AOA have the genetic capability to reduce oxidative stress and to repair ultraviolet damage (Luo et al., 2014;
San-toro et al., 2015). More case studies are needed in the future to explore the vertical distribution of the relative contribution of nitrification to new production in the euphotic zone. 4.2.3 Nutrient preference
Phytoplankton use a variety of nitrogenous species for growth. McCarthy et al. (1977) introduced the concept of a relative preference index (RPI) to assess the relative use of different forms of N, and an RPI > 1 indicates a preference for the specific substrate over other forms of N. As shown in Table 4, in the low-nutrient case NO−3 was preferred. The fact that the RPI for NO−3 was slightly higher than the RPI for NH+4 was probably due to the phytoplankton commu-nity structure, as mentioned above. This result is consistent with studies in the Sargasso Sea (Fawcett et al., 2011). How-ever, in the high-nutrient case, the order of the RPI values was NH+4 > 1 > NO−3 > NO−2, the suggestion being that phy-toplankton preferred NH+4 over NO−3 and NO−2, similar to the results of studies in Chesapeake Bay (McCarthy et al., 1977).
4.2.4 Quantifying various ammonium consumption pathways
In the upper ocean, NH+4 cycles rapidly due to the metabolic pathways of the various microorganisms that compete for ammonium. Ammonium may serve as a nitrogen source for phytoplankton assimilation, and as an energy source for ammonia-oxidizing organisms (AOMs). Moreover, many studies have shown that bacteria also play a part in NH+4 utilization (Middelburg and Nieuwenhuize, 2000; Veuger et al., 2004). Our results in the low-nutrient case showed that phytoplankton were the main consumers of NH+4 (82 % of the total NH+4 consumption). Bacteria accounted for another
∼17 %, and AOMs used the remaining 1 %. In the high-nutrient study, phytoplankton and bacteria each consumed
∼50 % of the total NH+4 (Table 4).
5 Conclusions
The isotope matrix method was designed specifically for in-cubations in the euphotic zone under simulated in situ con-ditions. By considering multiple flows among pools and re-quiring mass balance at the whole-system level, we mini-mized potential biases caused by non-targeted processes in traditional source–product methods. Given the progress in analytical techniques for measuring concentrations and iso-topic compositions of nitrogen species, the isotope matrix method is a promising approach for studying of rates of nitro-gen fluxes from a system-wide perspective. Furthermore, the matrix method is also appropriate for probing the effects of environmental factors (e.g., CO2, pH, temperature, and light
Data availability. The data associated with the paper are available from the corresponding author upon request.
The Supplement related to this article is available online at doi:10.5194/bg-14-1021-2017-supplement.
Competing interests. The authors declare that they have no conflict of interest.
Acknowledgements. We sincerely thank Wenbin Zou and Tao Huang at the State Key Laboratory of Marine Environmental Science (Xiamen University, China) for their valuable help with the water sampling and the on-board trace NH+4 concentration analysis during the 2015 NWP cruise. Yu-ting Shih from the Department of Geology at National Taiwan University in Taiwan is thanked for his help on ODE application. This research was funded by the National Natural Science Foundation of China (NSFC U1305233, 2014CB953702, 91328207, 2015CB954003). This is MEL contribution number #melpublication2017179.
Edited by: J. Middelburg
Reviewed by: three anonymous referees
References
Beman, J. M., Popp, B. N., and Alford, S. E.: Quantification of ammonia oxidation rates and ammonia-oxidizing archaea and bacteria at high resolution in the Gulf of California and eastern tropical North Pacific Ocean, Limnol. Oceanogr., 57, 711–726, doi:10.4319/lo.2012.57.3.0711, 2012.
Blackburn, T. H.: Method for Measuring Rates of NH+4 Turnover in Anoxic Marine Sediments, Using a15N-NH+4 Dilution Tech-nique, Appl. Environ. Microbiol., 37, 760–765, 1979.
Braman, R. S. and Hendrix, S. A.: Nanogram nitrite and nitrate de-termination in environmental and biological materials by vana-dium (III) reduction with chemiluminescence detection, Anal. Chem., 61, 2715–2718, doi:10.1021/ac00199a007, 1989. Bronk, D., Killberg-Thoreson, L., Sipler, R., Mulholland, M.,
Roberts, Q., Bernhardt, P., Garrett, M., O’Neil, J., and Heil, C.: Nitrogen uptake and regeneration (ammonium regeneration, ni-trification and photoproduction) in waters of the West Florida Shelf prone to blooms of Karenia brevis, Harmful Algae, 38, 50– 62, doi:10.1016/j.hal.2014.04.007, 2014.
Bronk, D. A. and Glibert, P. M.: A15N tracer method for the mea-surement of dissolved organic nitrogen release by phytoplankton, Mar. Ecol. Prog. Ser., 77, 171–182, 1991.
Bronk, D. A. and Glibert, P. M.: The fate of the missing15N dif-fers among marine systems, Limnol. Oceanogr., 39, 189–195, doi:10.4319/lo.1994.39.1.0189, 1994.
Bronk, D. A. and Ward, B. B.: Magnitude of dissolved or-ganic nitrogen release relative to gross nitrogen uptake in marine systems, Limnol. Oceanogr., 45, 1879–1883, doi:10.4319/lo.2000.45.8.1879, 2000.
Bronk, D. A., Glibert, P. M., and Ward, B. B.: Nitrogen uptake, dissolved organic nitrogen release, and new production, Science, 265, 1843–1846, 1994.
Caperon, J., Schell, D., Hirota, J., and Laws, E.: Ammo-nium excretion rates in Kaneohe Bay, Hawaii, measured by a 15N isotope dilution technique, Mar. Biol., 54, 33–40, doi:10.1007/BF00387049, 1979.
Casciotti, K., Sigman, D., Hastings, M. G., Böhlke, J., and Hilkert, A.: Measurement of the oxygen isotopic composition of nitrate in seawater and freshwater using the denitrifier method, Anal. Chem., 74, 4905–4912, 2002.
Casciotti, K. L.: Nitrogen and Oxygen Isotopic Studies of the Marine Nitrogen Cycle, Ann. Rev. Mar. Sci., 8, 379–407, doi:10.1146/annurev-marine-010213-135052, 2016.
Chen, Y.-L.: Spatial and seasonal variations of nitrate-based new production and primary production in the South China Sea, Deep-Sea Res. Pt. I, 52, 319–340, doi:10.1016/j.dsr.2004.11.001, 2005.
Collos, Y.: Calculations of15N uptake rates by phytoplankton as-similating one or several nitrogen sources, International Journal of Radiation Applications and Instrumentation, Part A, Appl. Ra-diat. Isotopes, 38, 275–282, doi:10.1016/0883-2889(87)90038-4, 1987.
Coplen, T. B., Krouse, H. R., and Böhlke, J. K.: Reporting of nitro-gen isotope abundances-(Technical report), Pure Appl. Chem., 64, 907–908, 1992.
Daims, H., Lebedeva, E. V., Pjevac, P., Han, P., Herbold, C., Al-bertsen, M., Jehmlich, N., Palatinszky, M., Vierheilig, J., Bulaev, A., Kirkegaard, R. H., von Bergen, M., Rattei, T., Bendinger, B., Nielsen, P. H., and Wagner, M.: Complete nitrification by Nitro-spira bacteria, Nature, 528, 504–509, doi:10.1038/nature16461, 2015.
De Brauwere, A. D., Ridder, F. D., Pintelon, R., Elskens, M., Schoukens, J., and Baeyens, W.: Model selection through a statistical analysis of the minimum of a weighted least squares cost function, Chemom. Intell. Lab. Syst., 76, 163–173, doi:10.1016/j.chemolab.2004.10.006, 2005.
Dore, J. E. and Karl, D. M.: Nitrification in the euphotic zone as a source for nitrite, nitrate, and nitrous oxide at Station ALOHA, Limnol. Oceanogr., 41, 1619–1628, 1996.
Dugdale, R. and Goering, J.: Uptake of new and regenerated forms of nitrogen in primary productivity, Limnol. Oceanogr., 12, 196– 206, doi:10.4319/lo.1967.12.2.0196, 1967.
Dugdale, R. and Wilkerson, F.: The use of15N to measure nitrogen uptake in eutrophic oceans; experimental considerations, Lim-nol. Oceanogr., 31, 673–689, doi:10.4319/lo.1986.31.4.0673, 1986.
Elskens, M., Baeyens, W., Cattaldo, T., Dehairs, F., and Grif-fiths, B.: N uptake conditions during summer in the Sub-antarctic and Polar Frontal Zones of the Australian sector of the Southern Ocean, J. Geophys. Res.-Oceans, 107, 1–11, doi:10.1029/2001JC000897, 2002.
Falkowski, P. G.: Evolution of the nitrogen cycle and its influence on the biological sequestration of CO2in the ocean, Nature, 387,
272–275, doi:10.1038/387272a0, 1997.
Fawcett, S. E., Lomas, M. W., Casey, J. R., Ward, B. B., and Sigman, D. M.: Assimilation of upwelled nitrate by small eukaryotes in the Sargasso Sea, Nat. Geosci., 4, 717–722, doi:10.1038/ngeo1265, 2011.
Francis, C. A., Roberts, K. J., Beman, J. M., Santoro, A. E., and Oakley, B. B.: Ubiquity and diversity of ammonia-oxidizing ar-chaea in water columns and sediments of the ocean, P. Natl. A. Sci. India A, 102, 14683–14688, doi:10.1073/pnas.0506625102, 2005.
Glibert, P. M., Lipschultz, F., McCarthy, J. J., and Altabet, M. A.: Isotope dilution models of uptake and remineralization of am-monium by marine plankton, Limnol. Oceanogr., 27, 639–650, 1982.
Granger, J. and Sigman, D. M.: Removal of nitrite with sul-famic acid for nitrate N and O isotope analysis with the den-itrifier method, Rapid Commun. Mass Sp., 23, 3753–3762, doi:10.1002/rcm.4307, 2009.
Grundle, D. S., Juniper, S. K., and Giesbrecht, K. E.: Euphotic zone nitrification in the NE subarctic Pacific: Implications for measurements of new production, Mar. Chem., 155, 113–123, doi:10.1016/j.marchem.2013.06.004, 2013.
Hannon, J. E. and Böhlke, J. K.: Determination of the delta (15N/14N) of Ammonium (NH+4) in Water: RSIL Lab Code 2898, US Geological Survey 2328-7055, 2008.
Harrison, P. J. and Davis, C. O.: Use of the perturbation tech-nique to measure nutrient uptake rates of natural phytoplankton populations, Deep-Sea Res., 24, 247–255, doi:10.1016/S0146-6291(77)80003-9, 1977.
Harrison, W. G., Harris, L. R., Karl, D. M., Knauer, G. A., and Redalje, D. G.: Nitrogen dynamics at the VERTEX time-series site, Deep-Sea Res. Pt. I, 39, 1535–1552, doi:10.1016/0198-0149(92)90046-V, 1992.
Harvey, W. A. and Caperon, J.: The rate of utilization of urea, ammonium, and nitrate by natural populations of marine phy-toplankton in a eutrophic environment, Pac. Sc., 30, 329–340, 1976.
Holmes, R., McClelland, J., Sigman, D., Fry, B., and Peterson, B.: Measuring 15N–NH+4 in marine, estuarine and fresh wa-ters: An adaptation of the ammonia diffusion method for samples with low ammonium concentrations, Mar. Chem., 60, 235–243, doi:10.1016/S0304-4203(97)00099-6, 1998.
Horrigan, S., Carlucci, A., and Williams, P.: Light inhibition of ni-trification in sea-surface films [California], J. Mar. Res., 39, 557– 565, 1981.
Howard, M. D. A., Cochlan, W. P., Ladizinsky, N., and Kudela, R. M.: Nitrogenous preference of toxigenic Pseudo-nitzschia aus-tralis (Bacillariophyceae) from field and laboratory experiments, Harmful Algae, 6, 206–217, doi:10.1016/j.hal.2006.06.003, 2007.
Hsiao, S.-Y., Hsu, T.-C., Liu, J.-w., Xie, X., Zhang, Y., Lin, J., Wang, H., Yang, J.-Y., Hsu, S.-C., and Dai, M.: Nitrifica-tion and its oxygen consumpNitrifica-tion along the turbid Chang Jiang River plume, Biogeosciences, 11, 2083–2098, doi:10.5194/bg-11-2083-2014, 2014.
Knapp, A. N., Sigman, D. M., and Lipschultz, F.: N isotopic com-position of dissolved organic nitrogen and nitrate at the Bermuda
Atlantic Time-series Study site, Global Biogeochem. Cy., 19, 1– 15, doi:10.1029/2004GB002320, 2005.
Koroleff, F.: Simultaneous oxidation of nitrogen and phosphorus compounds by persulfate, Methods of Seawater Analysis, 2, 205–206, 1983.
Laws, E. A.: Analytic Models of NH+4 Uptake and Re-generation Experiments, Limnol. Oceanogr., 30, 1340–1350, doi:10.4319/lo.1985.30.6.1340, 1985.
Laws, E. A. and Wong, D. C. L.: Studies of carbon and ni-trogen metabolism by three marine phytoplankton species in nitrate-limited continuous culture, J. Phycol., 14, 406–416, doi:10.1111/j.1529-8817.1978.tb02460.x, 1978.
Laws, E. A., Landry, M. R., Barber, R. T., Campbellc, L., Dick-sond, M.-L., and Marra, J.: Carbon cycling in primary pro-duction bottle incubations: inferences from grazing experiments and photosynthetic studies using14C and18O in the Arabian Sea, Deep-Sea Res. Pt. II, 47, 1339–1352, doi:10.1016/S0967-0645(99)00146-0, 2000.
Lipschultz, F.: A time-series assessment of the nitrogen cycle at BATS, Deep-Sea Res. Pt. II, 48, 1897–1924, doi:10.1016/S0967-0645(00)00168-5, 2001.
Lipschultz, F.: Isotope Tracer Methods for Studies of the Marine Ni-trogen Cycle, in: NiNi-trogen in the marine environment, edited by: Capone, D. A., Bronk, D. A., Mulholland, M. R., and Carpenter, E. J., Academic Press, London, UK, 303–384, 2008.
Lomas, M. W. and Lipschultz, F.: Forming the primary nitrite maxi-mum: Nitrifiers or phytoplankton, Limnol. Oceanogr., 51, 2453– 2467, doi:10.4319/lo.2006.51.5.2453, 2006.
Luo, H., Tolar, B. B., Swan, B. K., Zhang, C. L., Stepanauskas, R., Ann, M. M., and Hollibaugh, J. T.: Single-cell genomics shed-ding light on marine Thaumarchaeota diversification, ISME J., 8, 732–736, doi:10.1038/ismej.2013.202, 2014.
Marchant, H. K., Mohr, W., and Kuypers, M. M. M.: Re-cent advances in marine N-cycle studies using 15N la-beling methods, Curr. Opin. Biotechnol., 41, 53–59, doi:10.1016/j.copbio.2016.04.019, 2016.
McCarthy, J. J. and Eppley, R. W.: A comparison of chemical, iso-topic, and enzymatic methods for measuring nitrogen assimila-tion of marine phytoplankton, Limnol. Oceanogr., 17, 371–382, doi:10.4319/lo.1972.17.3.0371, 1972.
McCarthy, J. J., Taylor, W. R., and Taft, J. L.: Nitrogenous nutri-tion of the plankton in the Chesapeake Bay, 1. Nutrient avail-ability and phytoplankton preferences, Limnol. Oceanogr., 22, 996–1011, 1977.
McIlvin, M. R. and Altabet, M. A.: Chemical conversion of nitrate and nitrite to nitrous oxide for nitrogen and oxygen isotopic anal-ysis in freshwater and seawater, Anal. Chem., 77, 5589–5595, doi:10.1021/ac050528s, 2005.
Merbt, S. N., Stahl, D. A., Casamayor, E. O., Martí, E., Nicol, G. W., and Prosser, J. I.: Differential photoinhibition of bacterial and archaeal ammonia oxidation, FEMS Microbiol. Lett., 327, 41– 46, doi:10.1111/j.1574-6968.2011.02457.x, 2012.
Middelburg, J. J. and Nieuwenhuize, J.: Uptake of dissolved inor-ganic nitrogen in turbid, tidal estuaries, Mar. Ecol. Prog. Ser., 192, 79–88, doi:10.3354/meps192079, 2000.
Newell, S. E., Fawcett, S. E., and Ward, B. B.: Depth distribution of ammonia oxidation rates and ammonia-oxidizer community composition in the Sargasso Sea, Limnol. Oceanogr., 58, 1491– 1500, doi:10.4319/lo.2013.58.4.1491, 2013.
Olson, R.:15N tracer studies of the primary nitrite maximum, J. Mar. Res., 39, 203–226, 1981a.
Olson, R. J.: Differential photoinhibition of marine nitrifying bacte-ria: a possible mechanism for the formation of the primary nitrite maximum, J. Mar. Res., 39, 227–238, 1981b.
Painter, S. C., Patey, M. D., Tarran, G. A., and Torres-Valdés, S.: Picoeukaryote distribution in relation to nitrate uptake in the oceanic nitracline, Aquat. Microb. Ecol., 72, 195–213, doi:10.3354/ame01695, 2014.
Pakulski, J., Benner, R., Amon, R., Eadie, B., and Whitledge, T.: Community metabolism and nutrient cycling in the Mississippi River plume: evidence for intense nitrification at intermediate salinities, Mar. Ecol. Prog. Ser., 117, 207–218, 1995.
Peng, X., Fuchsman, C. A., Jayakumar, A., Warner, M. J., Devol, A. H., and Ward, B. B.: Revisiting nitrification in the eastern tropi-cal South Pacific: A focus on controls, J. Geophys. Res.-Oceans, 121, 1667–1684, doi:10.1002/2015JC011455, 2016.
Pfister, C. A., Altabet, M. A., Pather, S., and Dwyer, G.: Tracer ex-periment and model evidence for macrofaunal shaping of micro-bial nitrogen functions along rocky shores, Biogeosciences, 13, 3519–3531, doi:10.5194/bg-13-3519-2016, 2016.
Raimbault, P. and Garcia, N.: Evidence for efficient regenerated production and dinitrogen fixation in nitrogen-deficient waters of the South Pacific Ocean: impact on new and export produc-tion estimates, Biogeosciences, 5, 323–338, doi:10.5194/bg-5-323-2008, 2008.
Santoro, A., Sakamoto, C., Smith, J., Plant, J., Gehman, A., Wor-den, A., Johnson, K., Francis, C., and Casciotti, K.: Measure-ments of nitrite production in and around the primary nitrite maximum in the central California Current, Biogeosciences, 10, 7395–7410, doi:10.5194/bg-10-7395-2013, 2013.
Santoro, A. E., Casciotti, K. L., and Francis, C. A.: Activity, abun-dance and diversity of nitrifying archaea and bacteria in the central California Current, Environ. Microbiol., 12, 1989–2006, 2010.
Santoro, A. E., Dupont, C. L., Richter, R. A., Craig, M. T., Carini, P., Mcilvin, M. R., Yang, Y., Orsi, W. D., Moran, D. M., and Saito, M. A.: Genomic and proteomic characterization of “Candida-tus Nitrosopelagicus brevis”: An ammonia-oxidizing archaeon from the open ocean, P. Natl. Acad. Sci. USA, 112, 1173–1178, doi:10.1073/pnas.1416223112, 2015.
Sigman, D., Casciotti, K., Andreani, M., Barford, C., Galanter, M., and Böhlke, J.: A bacterial method for the nitrogen isotopic analysis of nitrate in seawater and freshwater, Anal. Chem., 73, 4145–4153, doi:10.1021/ac010088e, 2001.
Smith, J. M., Chavez, F. P., and Francis, C. A.: Ammonium uptake by phytoplankton regulates nitrification in the sunlit ocean, PloS One, 9, e108173, doi:10.1371/journal.pone.0108173, 2014.
Sunda, W. G. and Ransom, H. D.: Ammonium uptake and growth limitation in marine phytoplankton, Limnol. Oceanogr., 52, 2496–2506, 2007.
van Kessel, M. A., Speth, D. R., Albertsen, M., Nielsen, P. H., Op-den Camp, H. J., Kartal, B., Jetten, M. S., and Lucker, S.: Com-plete nitrification by a single microorganism, Nature, 528, 555– 559, doi:10.1038/nature16459, 2015.
Varela, M. M., Bode, A., Fernandez, E., Gonzalez, N., Ki-tidis, V., Varela, M., and Woodward, E.: Nitrogen uptake and dissolved organic nitrogen release in planktonic com-munities characterised by phytoplankton size–structure in the Central Atlantic Ocean, Deep-Sea Res. Pt. I, 52, 1637–1661, doi:10.1016/j.dsr.2005.03.005, 2005.
Veuger, B., Middelburg, J. J., Boschker, H. T. S., Nieuwenhuize, J., Rijswijk, P. V., Rochelle-Newall, E. J., and Navarro, N.: Microbial uptake of dissolved organic and inorganic nitro-gen in Randers Fjord, Estuar. Coast. Shelf S., 61, 507–515, doi:10.1016/j.ecss.2004.06.014, 2004.
Wada, E. and Hatton, A.: Nitrite metabolism in the euphotic layer of the central North Pacific Ocean, Limnol. Oceanogr., 16, 766– 772, doi:10.4319/lo.1971.16.5.0766, 1971.
Ward, B. B.: Temporal variability in nitrification rates and related biogeochemical factors in Monterey Bay, California, USA, Mar. Ecol. Prog. Ser., 292, 97–109, doi:10.3354/meps292097, 2005. Ward, B. B.: Nitrification in marine systems, in: Nitrogen in the
ma-rine environment, edited by: Capone, D. A., Bronk, D. A., Mul-holland, M. R., and Carpenter, E. J., Academic Press, London, UK, 5, 199–261, 2008.
Ward, B. B.: Measurement and distribution of nitrification rates in the oceans, in: Methods in enzymology, edited by: Abelson, J. N. and Simon, M. I., Academic Press, London, UK, 486, 307–323, 2011.
Yool, A., Martin, A. P., Fernández, C., and Clark, D. R.: The signif-icance of nitrification for oceanic new production, Nature, 447, 999–1002, doi:10.1038/nature05885, 2007.
Zehr, J. P. and Kudela, R. M.: Nitrogen cycle of the open ocean: from genes to ecosystems, Ann. Rev. Mar. Sci., 3, 197–225, doi:10.1146/annurev-marine-120709-142819, 2011.
Zhang, L., Altabet, M. A., Wu, T., and Hadas, O.: Sensitive mea-surement of NH+415N/14N (δ15NH+4) at natural abundance levels in fresh and saltwaters, Anal. Chem., 79, 5297–5303, doi:10.1021/ac070106d, 2007.
![Figure 2. The observational data in the low-nutrient case for (a) [NH+4 ], (b) [NO−x ], (c) [PN], (d) [TDN], (e) δ15N-NO−x , and (f) δ15N-PN.The regular and inverse open triangles represent the paralleled samples and the analytical errors are shown.](https://thumb-us.123doks.com/thumbv2/123dok_us/8151723.247423/6.612.130.471.64.271/figure-observational-nutrient-inverse-triangles-represent-paralleled-analytical.webp)
![Figure 3. The observational data in the high-nutrient case for (a) [NH+4 ], (b) [NO−2 ], (c) [NO−3 ], (d) [PN], (e) [TDN], (f) [PN+TDN],(g) δ15N-NO−2 , (h) δ15N-NO−3 , and (i) δ15N-PN](https://thumb-us.123doks.com/thumbv2/123dok_us/8151723.247423/7.612.126.471.66.372/figure-observational-data-high-nutrient-case-tdn-tdn.webp)
![Figure 4. The observed and STELLA-derived values in the low-nutrient case forPN,(e)observed values; the black, green, blue, magenta, and pink solid lines represent the STELLA model simulations when (a) [15NH+4 ], (b) [15NO−x ], (c) [15N-PN], (d) [15N-DON],](https://thumb-us.123doks.com/thumbv2/123dok_us/8151723.247423/9.612.61.542.67.633/figure-observed-stella-nutrient-observed-magenta-represent-simulations.webp)
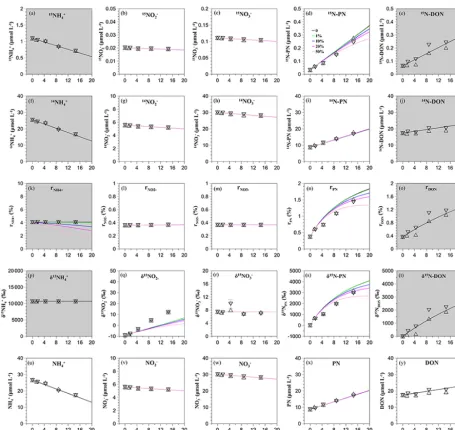
![Figure 5. The observed and STELLA-derived values in the high-nutrient case: in the first part 80 % sPAR depth and in the second part2 % sPAR depth for (a) [15NH+4 ], (b) [15NO−2 ], (c) [15NO−3 ], (d) [15N-PN], (e) [15N-DON], (f) [14NH+4 ], (g) [14NO−2 ], (h](https://thumb-us.123doks.com/thumbv2/123dok_us/8151723.247423/13.612.73.529.63.485/figure-observed-stella-derived-values-nutrient-rst-second.webp)