www.ann-geophys.net/33/1479/2015/ doi:10.5194/angeo-33-1479-2015
© Author(s) 2015. CC Attribution 3.0 License.
Gravity wave transmission diagram
Y. Tomikawa1,2
1National Institute of Polar Research, Tokyo, Japan
2SOKENDAI (The Graduate University for Advanced Studies), Tokyo, Japan Correspondence to: Y. Tomikawa (tomikawa@nipr.ac.jp)
Received: 5 September 2015 – Revised: 24 November 2015 – Accepted: 24 November 2015 – Published: 1 December 2015
Abstract. A new method of obtaining power spectral distri-bution of gravity waves as a function of ground-based hor-izontal phase speed and propagation direction from airglow observations has recently been proposed. To explain grav-ity wave power spectrum anisotropy, a new gravgrav-ity wave transmission diagram was developed in this study. Gravity wave transmissivity depends on the existence of critical and turning levels for waves that are determined by background horizontal wind distributions. Gravity wave transmission di-agrams for different horizontal wavelengths in simple back-ground horizontal winds with constant vertical shear indicate that the effects of the turning level reflection are significant and strongly dependent on the horizontal wavelength. Keywords. Atmospheric composition and structure (air-glow and aurora) – meteorology and atmospheric dynam-ics (waves and tides)
1 Introduction
An airglow imager is a unique instrument that can detect the horizontal structures of gravity waves around the mesopause region with high temporal and horizontal resolutions (i.e. ∼1 min and ∼1 km, respectively). Nearly monochromatic gravity waves have been extracted from airglow data by vi-sual inspection and examined in previous studies (e.g. Taylor et al., 1993; Nakamura et al., 1999; Hecht et al., 2001). How-ever, this method is time consuming and relies upon the abil-ity of data analysts to detect the wave-like structures from the airglow data. Thus, methods that are more objective and uni-versally applicable for describing the characteristics of grav-ity waves in airglow images are required.
Matsuda et al. (2014) proposed a new method (hereafter, Matsuda’s method) to obtain a power spectral distribution of gravity waves as a function of ground-based horizontal phase
speed and propagation direction from airglow data. They ap-plied a three-dimensional (i.e. zonal, meridional and tempo-ral) fast Fourier transform (3-D FFT) to the airglow emission intensity data at Syowa Station, Antarctica (69◦S, 40◦E), af-ter some corrections and converted the obtained 3-D power spectrum into the polar plot with ground-based horizontal phase speed as the radius and propagation direction as the polar angle. The peaks in the obtained power spectral distri-butions closely corresponded to the gravity waves obtained using a conventional event analysis based on visual inspec-tion. Matsuda’s new method enabled rapid parallel analysis of airglow data with different temporal and spatial resolu-tions, which is highly beneficial for the comparison of grav-ity wave statistics between different locations.
Gravity wave reflection at a turning level has never been considered in previous studies using airglow data. This is probably because the horizontal wavelength of a gravity wave is required to determine its turning level in addition to the background horizontal winds. However, the horizontal wavelength can be obtained using the 3-D FFT in Matsuda’s method, which makes it possible to seek the turning level of the wave. A gravity wave transmission diagram, which rep-resents a restricted region of gravity wave propagation due to critical level filtering and turning level reflection, is pre-sented in this article. The relative effects of critical level fil-tering and turning level reflection on the vertical propagation of gravity waves from their source region to the mesopause are also demonstrated. The effects of additional critical level filtering, which would occur before the intrinsic horizontal phase speed of the wave becomes zero, are also discussed.
The theoretical backgrounds of the critical and turning lev-els are described in Sect. 2. Section 3 shows how a restricted region of gravity wave propagation due to critical level fil-tering and turning level reflection could change in relation to the horizontal wavelength of a wave under simple back-ground horizontal wind conditions. The applicability of the gravity wave transmission diagram is discussed in Sect. 4. Concluding remarks are given in Sect. 5.
2 Theoretical background 2.1 Critical level filtering
Vertically propagating gravity waves are absorbed at a crit-ical level at which the background horizontal wind speed component parallel to a horizontal wavenumber vector is equal to the ground-based horizontal phase speed of the wave (Booker and Bretherton, 1967). In other words, the intrinsic horizontal phase speed of the wave becomes zero at the crit-ical level. This intrinsic horizontal phase speed is given by
ˆ
ch=ch−(ucosθ+vsinθ ) , (1)
wherechandcˆhare the ground-based and intrinsic horizontal phase speeds, respectively,uandvare the background zonal and meridional winds, respectively, andθis the direction of the horizontal wavenumber vector (and ground-based hori-zontal phase speed) (i.e. degrees anticlockwise from east-ward). Thus, chˆ =0 at the critical level. It should be noted that the intrinsic phase speed can be in the opposite direc-tion to the ground-based phase speed when the background wind along the horizontal wavenumber vector is sufficiently strong. In short,cˆhcan take either sign, whilechis positive definite. The convention, wherechis positive definite, simpli-fies the definition of source waves whose transmission is to be considered and eases the interpretation of the transmission diagrams. However, it is noted that this convention differs to that used in Fritts and Alexander (2003) whereωˆ (and thus
ˆ
ch)is defined as positive definite. Stationary gravity waves
(i.e. mountain waves), for which the direction of the ground-based phase speed cannot be determined, require an alterna-tive treatment (Dunkerton and Butchart, 1984; Whiteway and Duck, 1996).
When a vertical distribution of background horizontal winds is given, Eq. (1) can be used to determine the height of the critical level where the intrinsic horizontal phase speed changes sign with height. Although Taylor et al. (1993) de-fined the height of the critical level to be where the intrin-sic horizontal phase speed changes from positive to negative with height, their definition excludes gravity waves for which the directions of the ground-based and intrinsic horizontal phase speeds are opposite (e.g. Thomas et al., 1999). The ef-fects of such a difference in the definition of the critical level are discussed in Sect. 3.
2.2 Additional critical level filtering
An intrinsic horizontal phase speed of zero, which is gener-ally used as the definition of the critical level, corresponds to a zero intrinsic wave frequency. However, from the disper-sion relation of inertia–gravity waves given by
m2= N 2−k2
hcˆ 2 h ˆ
ch2−f2/k2 h
− 1
4H2 (2)
(cf. Fritts and Alexander, 2003), whereN andf are buoy-ancy and inertial frequencies, respectively,khandmare the horizontal and vertical wavenumbers of the wave, respec-tively, andH is a scale height,m2→ ∞atcˆh= ±kfh. Note that kh is positive definite. Thus, the lowest intrinsic fre-quency of a vertically propagating gravity wave is the inertial frequency in a rotating fluid. A critical level of a gravity wave in a rotating fluid exists at the height at whichchˆ = ±f
kh and
provides more gravity wave filtering than does the critical level defined bychˆ =0.
2.3 Turning level reflection
In linear theory, all waves are absorbed and their vertical wavelengths become infinitely small at the critical level de-fined in Sect. 2.2; however, the waves are totally reflected at the height at whichm2=0. This height is called the turning level (Fritts and Alexander, 2003). The intrinsic phase speed at the turning level is given by
ˆ ch2=
N2+ f2 4H2k2
h
kh2+ 1 4H2
, (3)
3 Results
Matsuda et al. (2014) extracted gravity waves with horizontal wavelengths (λh≡2kπ
h)of 5–100 km in their method. Thus,
transmission diagrams for gravity waves with λh=100, 50 and 10 km are considered in this study.
The buoyancy frequency squared, which is used in the sub-sequent analysis, is taken to be
N2=
2×10⁻⁴ s−2 50 km≤z≤90 km (mesosphere) 4×10⁻⁴ s−2
10 km≤z <50 km (stratosphere) 1×10⁻⁴ s−2
0 km≤z <10 km (troposphere) . (4)
In this treatment, it is assumed that the airglow emission layer exists at an altitude of 90 km. The inertial frequency is taken to be the value at Syowa Station (69◦S; i.e. the inertial period is about 12.8 h), but would be lower at lower latitudes.
When background horizontal winds and a horizontal wavelength of the wave are given, gravity wave transmissiv-ity is obtained as follows: first, the intrinsic horizontal phase speed (ch)ˆ and vertical wavenumber squared (m2) at each height are computed for specified ground-based horizontal phase speed and propagation direction using Eqs. (1) and (2), respectively. If cˆh or cˆh∓kfh change sign with height be-tween starting height and 90 km, the wave is considered to encounter the critical level of cˆh=0 orcˆh= ±kfh, respec-tively. On the other hand, if m2 becomes zero or negative between starting height and 90 km, the wave is considered to encounter the turning level. This calculation is performed for every phase speed and propagation direction, such that the transmission diagram is constructed.
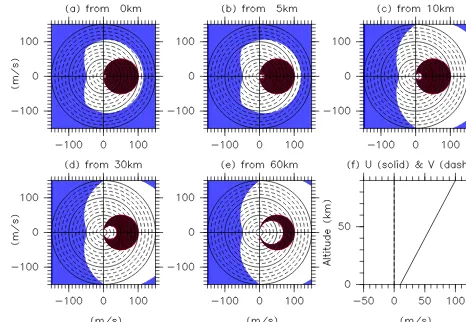
[image:3.612.309.542.65.226.2]Figure 1a–e show transmission diagrams for gravity waves withλh=100 km in background horizontal winds with con-stant vertical shear (shown in Fig. 1f). The transmissivities for propagation to 90 km of the gravity waves emitted at 0 km (i.e. ground), 5 km (i.e. middle troposphere), 10 km (i.e. tropopause), 30 km (i.e. middle stratosphere) and 60 km (i.e. lower mesosphere) were computed. The black shaded re-gions represent the restricted vertical propagation of gravity waves due to the critical level filtering (outlined in Sect. 2.1). The restricted regions exhibit circular structures around the background horizontal winds that vary with height, similar to critical level blocking diagram results (Taylor et al., 1993; Medeiros et al., 2003; Dowdy et al., 2007). However, a region of allowed vertical propagation appears inside the region of restricted vertical propagation, especially in Fig. 1d and e. This region of allowed vertical propagation corresponds to those gravity waves for which the directions of the intrin-sic and ground-based phase speeds are opposite, as men-tioned in Sect. 2.1. For example, a gravity wave with an east-ward ground-based phase speed of 50 m s−1emitted at 60 km can propagate to the mesopause region, because its intrinsic phase speed is always negative between 60 and 90 km and it does not encounter the critical level (see Fig. 1e). Such grav-ity waves can exist in regions of strong background horizon-tal winds, such as the polar-night jet, and they have not been
Figure 1. Gravity wave transmission diagrams for gravity waves
propagating to the mesopause region with λh=100 km starting from (a) 0 km, (b) 5 km, (c) 10 km, (d) 30 km and (e) 60 km, and
(f) vertical distributions of background (solid) zonal and (dashed)
meridional winds. Black, red and blue shading represents restricted regions of gravity wave propagation due to critical level filtering, additional critical level filtering and turning level reflection, respec-tively.
considered in previous studies using critical level blocking diagrams.
The red shaded regions in Fig. 1a–e represent the restricted vertical propagation of gravity waves due to additional crit-ical level filtering (outlined in Sect. 2.2). As |kf|
h ≈2 m s
−1 forλh=100 km at Syowa Station, the region of critical level filtering is extended outward by about 2 m s−1compared to thechˆ =0 case. Since this effect becomes smaller for shorter horizontal wavelengths, its impact on gravity wave propaga-tion is not expected to be significant forλh≤100 km.
The blue shaded regions in Fig. 1a–e represent the re-stricted vertical propagation of gravity waves due to turn-ing level reflection (outlined in Sect. 2.3). Turnturn-ing level re-flection occurs where the magnitude of the intrinsic phase speed of the wave is larger than the threshold value given in Eq. (3). Most gravity waves with ground-based horizontal phase speeds of < 50 m s−1would be able to propagate verti-cally, except through the restricted region due to critical level filtering.
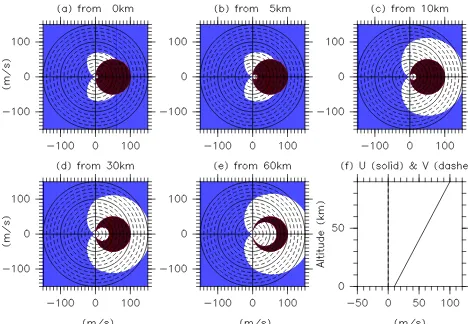
Figure 2a–e present transmission diagrams for gravity waves withλh=50 km. As critical level filtering only de-pends on the horizontal wavelength of the wave through kf
h
re-Figure 2. Same as Fig. 1 except forλh=50 km.
stricted region is larger for gravity waves emitted at 0 and 5 km than for those emitted at 10, 30 and 60 km. This differ-ence occurs because gravity waves propagating in regions of smaller buoyancy frequency such as in the troposphere have m2values closer to zero (the turning level threshold) and are thus more prone to restriction in vertical propagation. This feature indicates that buoyancy frequency also has significant effect on gravity wave transmissivity.
Transmission diagrams for gravity waves withλh=10 km are shown in Fig. 3. Almost all gravity waves are restricted to propagate vertically, even if they are emitted in the strato-sphere and mesostrato-sphere. Therefore, it is difficult for grav-ity waves with short horizontal wavelengths, such as 10 km, to propagate vertically in horizontal background winds that vary considerably with height (cf. Marks and Eckermann, 1995).
4 Discussion
The ground-based horizontal group speed for gravity waves with medium frequency (i.e. N >>ωˆ
[image:4.612.49.283.65.227.2]
>>|f|, where ωˆ is the intrinsic wave frequency) becomes the same as the ground-based horizontal phase speed (cf. Fritts and Alexan-der, 2003). If the period for vertical propagation of a wave from its source region to the mesopause is about 2 h (Stock-well and Lowe, 2001), then the horizontal propagation dis-tance is at most a few hundred kilometres for gravity waves with|ch| ≤50 m s−1. Thus, the assumption that the horizon-tal variation of the background horizonhorizon-tal winds is negligi-ble within the horizontal propagation distance of the wave is valid for background winds modified by large-scale waves, such as planetary waves and tides. However, the effects of large-scale gravity waves with horizontal wavelengths of sev-eral hundred kilometres or longer need to be considered care-fully.
Figure 3. Same as Fig. 1 except forλh=10 km.
Gravity wave transmission diagrams in simple background horizontal winds with constant vertical shear showed the fol-lowing:
– Gravity waves with λh=100 km and |ch| ≤50 m s−1 can propagate vertically, except for those filtered at the critical level.
– Gravity waves withλh=50 km can propagate vertically if the direction of their ground-based phase speed is roughly normal to the background horizontal winds. – Gravity waves withλh=10 km cannot propagate
verti-cally.
These features are true even in the real atmosphere above Syowa Station. As the vertical variations of the zonal wind are dominant over those of the meridional wind in winter, be-cause of the polar-night jet, the gravity wave transmission di-agram becomes similar to Figs. 1–3. Stratospheric westward winds become dominant, and the meridional wind is gener-ally weak in summer. Gravity waves with westward and east-ward ground-based phase speeds are restricted to propagate vertically by critical level filtering and turning level reflec-tion, respectively, in summer.
In principle, the gravity wave transmission diagram can be applied to gravity waves with long horizontal wavelengths such asλh=1000 km and low intrinsic frequency (i.e.
ωˆ
≈ |f|). While these gravity waves with low intrinsic frequency hardly encounter the turning level, additional critical level filtering significantly restricts their vertical propagation be-cause of |kf|
h ≈20 m s
[image:4.612.310.544.66.228.2]A ray tracing theory has also been used to describe the horizontal and vertical propagation of gravity waves given varying background horizontal winds (Lighthill, 1978). The effects of planetary waves and tides on gravity wave prop-agation have been studied by Senf and Achatz (2011) and Kalisch et al. (2014) using ray tracing models. As the ray tracing of gravity waves provides accurate and realistic tra-jectories of the gravity wave packets, it should be explored if possible. However, ray tracing calculations require 3-D hori-zontal wind and temperature distributions throughout the cal-culation period. Generally, such data are not available near the mesopause, except in general circulation models. Thus, the gravity wave transmission diagram used in this study re-mains useful for the interpretation of gravity waves observed by airglow imagers, even if it assumes that the gravity waves only propagate vertically.
5 Conclusions
Gravity waves with relatively short horizontal wavelengths (i.e. < 100 km) near the mesopause have been studied using airglow imagers. Recently, a new statistical method of ob-taining the gravity wave power spectrum as a function of ground-based horizontal phase speed and propagation direc-tion using airglow imager data was proposed (Matsuda et al., 2014). The gravity waves observed around the mesopause generally originate at lower altitudes, and these waves are affected by various processes such as critical level filtering, turning level reflection and turbulent and radiative dissipa-tion during their upward propagadissipa-tion. A critical level block-ing diagram, which considers the effects of critical level fil-tering, has been used to explain the gravity wave statistics observed by airglow imagers (Taylor et al., 1993; Stockwell and Lowe, 2001). However, the effects of turning level reflec-tion have never been considered in such accounts. This report proposed a gravity wave transmission diagram that considers the effects of both critical level filtering and turning level re-flection.
Transmission diagrams for gravity waves propagating to the mesopause region with different horizontal wavelengths and starting heights in simple background horizontal winds were presented in this study. In previous studies, critical level filtering has been taken into account for gravity waves with the same sign for their ground-based and intrinsic horizontal phase speeds. However, this study demonstrated that gravity waves with opposite signs for their ground-based and intrin-sic horizontal phase speeds could reach the mesopause region when the gravity waves were emitted in the stratosphere and mesosphere. Although the effects of additional critical level filtering atcˆh= ±kfh were also evaluated, they were small for gravity waves with relatively short horizontal wavelengths observed by airglow imagers.
The effects of turning level reflection on gravity wave transmissivity were observed to depend considerably on the horizontal wavelength of the gravity waves. While most
gravity waves with λh=100 km and|ch| ≤50 m s−1 could propagate vertically, except for those filtered at the critical level, almost all gravity waves with λh=10 km could not reach the mesopause region because of critical level filtering and turning level reflection. In the case of gravity waves with λh=50 km, while gravity waves with eastward and west-ward ground-based phase speeds were not allowed to propa-gate vertically, because of critical level filtering and turning level reflection, respectively, gravity waves with southward and northward ground-based phase speeds could reach the mesopause region. These results indicate that, in addition to critical level filtering, turning level reflection is an important mechanism in determining gravity wave transmissivity.
Acknowledgements. The author thanks T. Nakamura, M. Tsutsumi, M. K. Ejiri, T. Nishiyama and T. S. Matsuda for their helpful com-ments. Figures were drawn using Dennou Club Library (DCL). The author would like to thank Enago (www.enago.jp) for the English language review.
The topical editor Christoph Jacobi thanks two anonymous ref-erees for help in evaluating this paper.
References
Booker, J. R. and Bretherton, F. P.: The critical layer for internal gravity waves in a shear flow, J. Fluid Mech., 27, 513–539, 1967. Dowdy, A. J., Vincent, R. A., Tsutsumi, M., Igarashi, K., Mu-rayama, Y., Singer, W., and Murphy, D. J.: Polar meso-sphere and lower thermomeso-sphere dynamics: 1. Mean wind and gravity wave climatologies, J. Geophys. Res., 112, D17104, doi:10.1029/2006JD008126, 2007.
Dunkerton, T. J. and Butchart, N.: Propagation and selective trans-mission of internal gravity waves in a sudden warming, J. Atmos. Sci., 41, 1443–1460, 1984.
Fritts, D. C. and Alexander, M. J.: Gravity wave dynamics and effects in the middle atmosphere, Rev. Geophys., 41, 1003, doi:10.1029/2001RG000106, 2003.
Hecht, J. H., Walterscheid, R. L., Hickey, M. P., and Franke, S. J.: Climatology and modeling of quasi-monochromatic atmospheric gravity waves observed over Urbana Illinois, J. Geophys. Res., 106, 5181–5195, doi:10.1029/2000JD900722, 2001.
Kalisch, S., Preusse, P., Ern, M., Eckermann, S. D., and Riese, M.: Differences in gravity wave drag between realistic oblique and assumed vertical propagation, J. Geophys. Res., 119, 10081– 10099, doi:10.1002/2014JD021779, 2014.
Lighthill, M. J.: Waves in Fluids, Cambridge Univ. Press, Cam-bridge, UK, 1978.
Marks, C. J. and Eckermann, S. D.: A three-dimensional nonhydro-static ray-tracing model for gravity waves: Formulation and pre-liminary results for the middle atmosphere, J. Atmos. Sci., 52, 1959–1984, 1995.
Medeiros, A. F., Taylor, M. J., Takahashi, H., Batista, P. P., and Gobbi, D.: An investigation of gravity wave activity in the low-latitude upper mesosphere: Propagation direction and wind fil-tering, J. Geophys. Res., 108, 4411, doi:10.1029/2002JD002593, 2003.
Nakamura, T., Higashikawa, A., Tsuda, T., and Matsushita, Y.: Sea-sonal variations of gravity wave structures in OH airglow with a CCD imager at Shigaraki, Earth Planets Space, 51, 897–906, 1999.
Senf, F. and Achatz, U.: On the impact of middle-atmosphere ther-mal tides on the propagation and dissipation of gravity waves, J. Geophys. Res., 116, D24110, doi:10.1029/2011JD015794, 2011. Stockwell, R. G. and Lowe, R. P.: Airglow imaging of gravity waves 2. Critical layer filtering, J. Geophys. Res., 106, 17205–17220, 2001.
Taylor, M. J., Ryan, E. H., Tuan, T. F., and Edwards, R.: Evidence of preferential directions for gravity wave propagation due to wind filtering in the middle atmosphere, J. Geophys. Res., 98, 6047– 6057, doi:10.1029/92JA02604, 1993.
Thomas, L., Worthington, R. M., and McDonald, A. J.: Inertia-gravity waves in the troposphere and lower stratosphere associ-ated with a jet stream exit region, Ann. Geophys., 17, 115–121, 1999,
http://www.ann-geophys.net/17/115/1999/.