www.biogeosciences.net/13/6565/2016/ doi:10.5194/bg-13-6565-2016
© Author(s) 2016. CC Attribution 3.0 License.
Microbial activity promoted with organic carbon accumulation in
macroaggregates of paddy soils under long-term rice cultivation
Yalong Liu1,2,*, Ping Wang1,2,*, Yuanjun Ding1, Haifei Lu1, Lianqing Li1, Kun Cheng1, Jufeng Zheng1, Timothy Filley3, Xuhui Zhang1, Jinwei Zheng1, and Genxing Pan1,4
1Institute of Resource, Ecosystem and Environment of Agriculture, and Department of Soil Science, Nanjing Agricultural University, 1 Weigang, Nanjing 210095, China
2Department of Soil Sciences, Land and Environment College, Shenyang Agricultural University, Shenyang 110866, China 3Department of Earth, Atmospheric, and Planetary Sciences, Purdue University, West Lafayette, IN 47907, USA
4Center of Terrestrial Ecosystem Carbon Sink and Land remediation, School of Environmental and Resource Sciences, Zhejiang A & F University, Lin’an, Hangzhou 311300, China
*These authors contributed equally to this work.
Correspondence to:Genxing Pan (pangenxing@aliyun.com)
Received: 9 February 2016 – Published in Biogeosciences Discuss.: 25 April 2016
Revised: 17 November 2016 – Accepted: 19 November 2016 – Published: 15 December 2016
Abstract. While soil organic carbon (SOC) accumulation and stabilization has been increasingly the focus of ecosys-tem properties, how it could be linked to soil biological ac-tivity enhancement has been poorly assessed. In this study, topsoil samples were collected from a series of rice soils shifted from salt marshes for 0, 50, 100, 300 and 700 years from a coastal area of eastern China. Soil aggregates were fractioned into different sizes of coarse sand (200–2000 µm), fine sand (20–200 µm), silt (2–20 µm) and clay (< 2 µm), us-ing separation with a low-energy dispersion protocol. Soil properties were determined to investigate niche specializa-tion of different soil particle fracspecializa-tions in response to long-term rice cultivation, including recalcitrant and labile organic carbon, microbial diversity of bacterial, archaeal and fungal communities, soil respiration and enzyme activity. The re-sults showed that the mass proportion both of coarse-sand (2000–200 µm) and clay (< 2 µm) fractions increased with prolonged rice cultivation, but the aggregate size fractions were dominated by fine-sand (200–20 µm) and silt (20–2 µm) fractions across the chronosequence. SOC was highly en-riched in coarse-sand fractions (40–60 g kg−1) and moder-ately in clay fractions (20–25 g kg−1), but was depleted in silt fractions (∼10 g kg−1). The recalcitrant carbon pool was higher (33–40 % of SOC) in both coarse-sand and clay frac-tions than in fine-sand and silt fracfrac-tions (20–29 % of SOC). However, the ratio of labile organic carbon (LOC) to SOC
culti-vation management. The finding here provides a mechanistic understanding of soil organic carbon turnover and microbial community succession at fine scale of soil aggregates that have evolved along with anthropogenic activity of rice culti-vation in the field.
1 Introduction
Soil organic matter (SOM), as a continuum of organic sub-stances that accumulated over time from decomposition of plants and microorganisms (Lehmann and Kleber, 2015), provided a key driver for soil aggregation and thus soil ecosystem functions and services (Banwart et al., 2014). Soil aggregates have been considered as fundamental soil particle units where organic matter, minerals and microbes interacted to store carbon and nutrients, as well as moisture (Tisdall and Oades, 1982; Lützow et al., 2006; Marschner et al., 2008; Schmidt et al., 2011), and mediated their cycling in soil–plant systems (Six et al., 2004). One of the primary mechanisms for soil carbon sequestration could be the increased physi-cal protection of SOC within aggregates that decreased de-composition rates (Blanco-Canqui and Lal, 2004; Six et al., 2004; Kong et al., 2005; Six and Paustian, 2014). This could have something to do with separated allocation of mineral-associated SOC fractions between microaggregates within macroaggregates (Lehmann et al., 2008; Dungait et al., 2012; Vogel et al., 2014). Soil aggregation further shaped the mi-crohabitats for soil microbial communities (Six et al., 2000; Ettema and Wardle, 2002; Balser et al., 2006; Kögel-Knabner et al., 2008), with changes in SOC substrate availability, chemical recalcitrance and redox potential with or within aggregates (Rillig et al., 2001; Six et al., 2006; Strickland and Rousk, 2010). Consequently, changes in composition of soil aggregate fractions could lead to changes in bioactivity reflected by the size, diversity and biochemical activity of the microbial community (Six et al., 2006; Lagomarsino et al., 2012; Bardgett and van der Putten, 2014). Particulate or-ganic carbon (POC) has been increasingly considered as an indicator of soil quality and health under different stresses or human disturbance (Cambardella and Elliot, 1992; Mar-riott and Wander, 2006). As a labile carbon pool, POC has also been suggested as a measurement of SOC accumula-tion and stabilizaaccumula-tion with co-existing microbial activity of soils in different ecosystems (Gajda, 2010; Six and Paustian 2014). Soil aggregation, affected by land use and manage-ment practices, could result in changes in allocation of POC inter- and/or intra-microaggregates in size fractions of soil (Yang et al., 2009; Lagomarsino et al., 2012; Six and Paus-tian, 2014; Smith et al., 2014). Unfortunately, the link be-tween changes in carbon pools and those in microbial bio-logical activity with SOC stabilization in soil aggregates has not yet been well understood and quantitatively assessed (Six and Paustian 2014; Smith et al., 2014).
Soil aggregation could be characterized by measuring dis-tributions of defined particle size fractions, which could dif-fer in soil microbial biomass and activity, in response to SOC accumulation and stabilization of soil (Salinas-Garcia et al., 1997; Kandeler et al., 1999; Smith et al., 2014). Such differ-ence could mimic the microscale interactions driving SOC stabilization and nutrient cycling in soils (Kandeler et al., 2006; Lagomarsino et al., 2012; Six and Paustian, 2014). To examine these interactions, aggregate separation meth-ods should use the least low-energy dispersion of bulk soil into particle size fractions (Kandeler et al., 2000), and avoid use of any chemical dispersion methods (Smith et al., 2014). Stemmer et al. (1998) developed a low-energy ultrasonic dis-persion protocol, which allowed the least disturbed separa-tion for analyzing microbial community composisepara-tion and en-zyme activity in the obtained size fractions of soil aggregates (Kandeler et al., 2000). This approach was followed in later studies (Sessitsch et al., 2001; Poll et al., 2003; Matocha et al., 2004; Marx et al., 2005; Zhang et al., 2013), address-ing the impacts of different management practices or envi-ronmental disturbances on SOC persistence, microbial com-munities and enzyme activity in aggregate agricultural soils. However, the interactions between these attributes in aggre-gate size fractions with carbon stabilization and their trend with continuing management in long-term cultivated soils has not yet been well characterized.
Soil matrix or microsite properties have been well known to have an important role in the spatial allocation of organic matter and microbial community and thus the link between SOC pools and microbial bioactivity among different frac-tions of soil aggregates (Smith et al., 2014). Rice paddy soils were developed with a dynamic redox regime and neo-formation of iron/manganese oxyhydrates due to hydromor-phic pedogenesis under long-term hydroagric paddy manage-ment (Li, 1992). These soils were thus classified as a par-ticular soil group of hydroagric Anthrosols in the new Chi-nese Soil Taxonomy (Gong et al., 1999). Recently, these soils have been shown to have high SOC storage and sequestration potential compared to dry-land croplands (Pan et al., 2004, 2010; Wissing et al., 2013). This has previously been at-tributed to enhanced aggregation and aggregate stability (Lu et al., 1998; Yang et al., 2005) as well as to increased humi-fication of SOC (Olk et al., 2000). However, SOC accumula-tion and stabilizaaccumula-tion in paddy soils with management prac-tices has been addressed with a number of processes. These processes were understood with either increased binding to free oxyhydrates (Zhou et al., 2009b; Cui et al., 2014) and enhanced chemical recalcitrance (Zhou et al., 2009a, 2011; Song et al., 2012), or enhanced physical protection with in-creased aggregate stability (L. Li et al., 2007; Zhou et al., 2008) or their interactions (Song et al., 2012, 2013).
initial stage after the salt marshes shifted to rice paddies (Kalbitz et al., 2013). Across this chronosequence, the ac-cumulated SOC was increasingly stabilized with neo-formed iron oxyhydrates (Cheng et al., 2009; Wissing et al., 2011), as rice cultivation prolonged. Whereas, in a rice paddy with well-managed fertilization from southeastern China, SOC accumulation was well represented by an increase in propor-tion of water-stable macroaggregates (> 250 µm) and the as-sociated POC pool (Zhou and Pan, 2007). In rice paddies un-der long-term fertilization trials from southern China, physi-cally protected SOC in the coarse-sand-sized fractions of soil aggregates contributed to bulk-soil SOC accumulation and stabilization (Zhou et al., 2008).
Importantly, the co-evolution of the soil microbial commu-nity and diversity has been observed with SOC accumulation and stabilization in rice paddies (Zhang et al., 2007; Zheng et al., 2007; Liu et al., 2011). In line with the trend of SOC accumulation in paddy soils, microbial biomass and commu-nity diversity was shown to be enhanced across a chronose-quence under prolonged rice cultivation (Bannert et al., 2011; Jiang et al., 2013). Using a similar chronosequence, the en-hanced biological activity could be well portrayed with an increase in mean weight diameter of soil aggregates and in the POC pool across the soils with prolonged rice cultiva-tion (Wang et al., 2015). This indicated a potential role of the physically protected labile carbon pool in enhancing biologi-cal activity with bulk SOC accumulation in rice soils (Zou et al., 2015). Recently, changes in microbial gene abundance and community composition were reported for bulk soils (Liu et al., 2016a) and for aggregate size fractions of soils (Liu et al., 2016b), from such a rice soil chronosequence. It could be speculated that physical protection could involve a change in the spatial distribution of pools rather than in the chemical recalcitrance, of organic carbon located among ag-gregate size fractions. The changed allocation of both carbon pools and the microbial community could contribute to SOC stabilization with increased microbial abundance and the car-bon use efficiency,qCO2(Schlesinger and Andrews, 2000), as a result of enhanced aggregation (Lehmann, 2011). Such information would be of key importance for understanding carbon stabilization in relation to sustainable management of rice paddy soils with respect to carbon biogeochemical cy-cling and ecosystem functions provided by soils (Smith et al., 2015).
In this study, two hypotheses were tested. First, we sought to examine whether microbial bioactivity and carbon stabil-ity in soil aggregates could differ in their size fractions, lead-ing to changes in spatial allocation of SOC pools among aggregate size fractions in rice paddies. In this case, phys-ical protection of SOC could improve microbial microhab-itat conditions and thus microbial carbon use efficiency through enhanced aggregation. Furthermore, it could enable an existence of labile carbon pool within microaggregates that build up macroaggregates or between microaggregates within macroaggregates (Six and Paustian 2014; Smith et
al., 2014). Thus, biological activity could be enhanced with physically protected carbon in macroaggregates, as com-pared to microaggregates (clay sized) with chemically stabi-lized organic carbon. Second, we sought to examine whether the strong link between microbial activity and the size of la-bile carbon pool in macroaggregates could be promoted with enhancement of physically stabilized SOC through continu-ing hydroagric paddy management under long-term rice cul-tivation. In a series of soils formed on similar paleo-deposits rich in silt, continuous rice cultivation could result in a direc-tional change in soil aggregation, and thus in microhabitat conditions as well as nutrients. This directional pedogenetic development would in turn affect a more or less directional change in SOC stabilization (with increasing POC pool and accumulation of recalcitrant carbon and mineral bound car-bon). This study aimed to understand that carbon stabiliza-tion could not confront but could improve biological activity in soils under rice cultivation over centuries.
2 Materials and methods 2.1 Methodology rational
Using a recommended sonication separation procedure, we examined changes in aggregate size fraction composition for aggregate stability, in functional group composition for chemical recalcitrance of SOC, and in soil respiration for microbial energy use, in order to characterize SOC accu-mulation and stabilization in rice soils. Meanwhile, changes with SOC accumulation and stabilization were explored in microbial activity for soil functioning. For this, we ana-lyzed total microbial gene abundance and estimated over-all enzyme activity in aggregate size fractions. Furthermore, the potential link between OC (organic carbon) stabilization and bioactivity among the aggregate fractions were quanti-tatively assessed using the parameters of carbon-scaled or gene abundance-scaled respiration and enzyme activity. Fi-nally, the evolution of such an interlink was traced by com-paring the soils of sequential lengths of rice cultivation up to 700 years in a soil chronosequence.
2.2 Site and soils
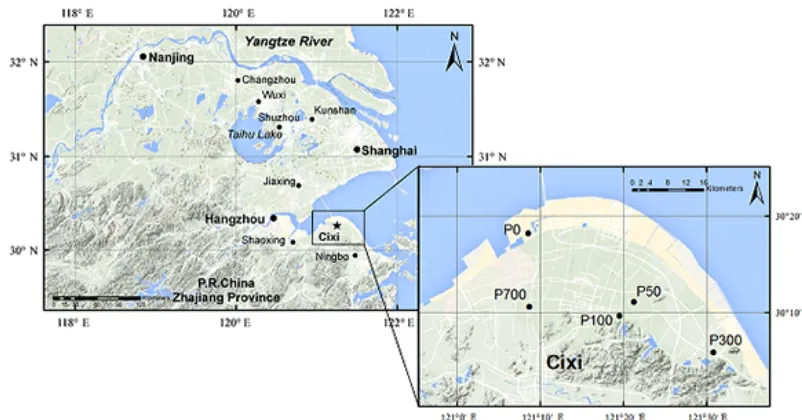
Figure 1.Sampling sites for the individual soils constituting the rice soil chronosequence from Cixi County, Zhejiang province, China. The suffix number followingP (paddy soil) designates the years under rice cultivation after shifting from salt marsh since dyke establishment.
studies for rice soil development, including a pedological characterization by Cheng et al. (2009) and a morphological, mineralogical and microbiological investigation by Kölbl et al. (2014).
Individual soils of the chronosequence were identified based on dyke establishment history recorded in Cixi County Annals (with brief information in Chinese available at www. cixi.gov.cn), including an initial tidal marsh soil before rice cultivation (P0), and rice soils of P50, P100, P300 and
P700 shifted for rice cultivation, respectively, 50, 100, 300 and 700 years before present (Fig. 1). These soils were sepa-rated from each other at a distance of no more than 40 km in nearly the same topography. All of the soils developed on comparable parent materials of paleo-deposit from the Yangtze River, with a particle composition of silt (75–84 %) followed by clay but low in sand content (Chen and Zhang, 2009). Soil texture ranged from silty loam to silty clay loam. The clay mineral assemblage consisted of illite (40–50 %), chlorite (20–30 %) and kaolinite (10–20 %) with a minor amount of smectite and quartz (G. Zhang et al., 2010).
The cropping system in this area followed a traditional summer rice–winter rape rotation. Rice production manage-ment on the chronosequence was relatively consistent across the sites, with similar cultivars and management practices in-cluding crop protection, irrigation and fertilization (Cheng et al., 2009). The influence of soil salinity on rice produc-tion could occur in the early stage of rice cultivaproduc-tion on the reclaimed tidal marsh though the groundwater table was al-ready low enough without restricting rice growth (Kölbl et al., 2014). The directional evolution of soil properties (Cheng et al., 2009; Chen et al., 2011), neo-formation of clay min-erals, particularly of iron/manganese oxyhydrates (Wissing et al., 2011, 2013; Kölbl et al., 2014), and interaction of
or-ganic matter with minerals (Wissing et al., 2011, 2013) as well as organic carbon pools (Wissing et al., 2011; Wang et al., 2015) have already been characterized.
2.3 Soil sampling
Topsoil (0–15 cm in depth) samples of the five individual soils of the chronosequence were used in the study. To avoid influence of fresh straw material on soil aggregates and car-bon substrates in soil samples, the sampling was done in early November 2011, when the soil was moist following rice harvest. While collecting a soil sample from the field, an undisturbed soil core was obtained using an Eijkelkamp soil core sampler (Agrisearch Equipment, Giesbeek, the Nether-lands), whereas a bulk-soil sample was obtained using a stainless steel shovel. For each individual soil, a topsoil was collected in triplicates from three adjacent individual fields. Finally, all soil samples were shipped to a lab within 2 days after sampling, and stored at 4◦C before soil analysis in the following 2 weeks. The basic properties of the studied soils are listed in Table 1. Changes of OC stability and microbial activity of bulk soil along the chronosequence has been as-sessed in our previous study (Wang et al., 2015, and Liu et al., 2016a, b).
2.4 Particle size fractionation of soil aggregates
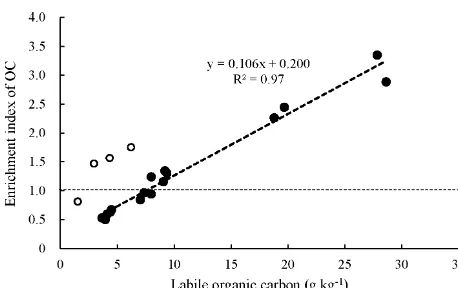
Table 1.Basic properties of the soils in the chronosequence (mean±SD,n=3).
Soil pH SOC Total N BD CEC Fed
(H2O) (g kg−1) (g kg−1) (g cm−3) (cmol kg−1) (g kg−1)
P0 8.62±0.07a 6.32±0.58d 0.79±0.02c 1.31±0.05a 6.32±0.34c 1.76±0.02c
P50 7.84±0.04b 15.96±0.66c 1.81±0.06b 1.13±0.03b 12.82±0.06b 1.96±0.01b
P100 6.39±0.05d 17.07±0.49b 2.06±0.09a 1.06±0.04b 12.54±0.12b 2.04±0.04a
P300 6.40±0.03d 17.97±0.81b 2.09±0.08a 1.07±0.07b 13.78±0.26a 2.08±0.05a
P700 6.65±0.08c 21.07±1.21a 2.14±0.06a 1.06±0.05b 12.97±0.27b 1.71±0.02c
SOC, soil organic carbon; BD, bulk density; CEC, cation exchange capacity; Fed: dithionate-extractable iron oxyhydrates.
and Kandeler, et al. (1999, 2000, 2006). A portion of field moist soil core (50 g equivalent dry weight), cleaned of dis-cernible straw material, was placed into a glass beaker in 100 mL of distilled water. The soil mass was dispersed us-ing a low-energy ultrasonic disaggregator (Zhixin, JVD-650, Shanghai, China) with an output energy of 170 J g−1 for 5 min. A coarse-sand-sized fraction of aggregates with a di-ameter range of 2000–200 µm was separated by wet sieving and the fine-sand-sized fraction of 200–20 µm was subse-quently obtained by sedimentation after siphoning. The re-mainder was centrifuged to collect the silt-sized fraction of 20–2 µm and the supernatant was centrifuged again to col-lect the clay-sized fraction of ≤2 µm. The samples of the obtained size fractions were freeze-dried (Thermo, Modulyo D-230, NY, USA) and then stored at −70◦C. Here, water-stable macroaggregates larger than 2000 µm were not taken into consideration as they were insignificant in rice soils un-der prevailing water submergence with long-term hydroagric management (Deng and Xu, 1965). The classes of the size fractions were kept basically consistent with our previous studies (L. Li et al., 2007; Z. P. Li et al., 2007; Zheng et al., 2007; Pan et al., 2008; Chen et al., 2014).
2.5 Organic carbon pool and FTIR spectroscopy analysis
Soil organic carbon (SOC) and total nitrogen (TN) of the separated fractions were determined with a CNS elemen-tal analyzer (Elementar Vario-max CNS Analyser, Germany Elementar Company). Labile organic carbon (LOC) con-tent was measured by 0.33 M potassium permanganate ox-idation (KMnO4), following a procedure described by Blair et al. (1995). Microbial biomass carbon (MBC) was mea-sured using the chloroform fumigation-extraction method. The MBC content was estimated as the difference of OC be-tween the unfumigated and fumigated samples using the con-version factor of 0.45, following Joergensen (1996). Herein, MBC of the coarse-sand fractions of P0 soil was not pro-vided due to the very small sample obtained via the sonica-tion and separasonica-tion procedure.
The chemical composition of the organic carbon in the particle size fractions was characterized with FTIR
spec-troscopy using a Bruker FTIR spectrophotometer (Bruker TENSOR 27 Spectrometer, Ettlingen, Germany). Briefly, a portion of frozen-dried aggregate sample was powdered in an agate mill, and 1 mg of the homogenized sample powder was mixed thoroughly with 100 mg KBr. The pellet prepared with pressure was placed in a sample holder and FTIR spec-tra were recorded. FTIR scanning was conducted in ambi-ent conditions at 22±1◦C. The resolution was set to 4 cm−1 and the operating range was 400–4000 cm−1. In all cases, 20 scans per sample were recorded, averaged for each spec-trum and corrected against the specspec-trum with ambient air as background. Following Ellerbrock et al. (1999) and Cocozza et al. (2003), the characteristic vibration peak at 1050 cm−1 was assigned to polysccharides, those at 1630 cm−1 to aro-matic compounds and those at 2927 cm−1to aliphatic com-pounds as well as those at 3405 cm−1 to phenols. Subse-quently, a general semi-quantification of three major func-tional OC groups of polysaccharides, aliphatic and aromatic compounds was performed following Tivet et al. (2013). Nevertheless, it was not able to quantify potential contribu-tions from organic Si or P compounds to the intensity of the band assigned to polysaccharides (Mao et al., 2008; Tivet et al., 2013). All the obtained FTIR spectra are given in Fig. S1 in the Supplement.
2.6 SEM observation of soil aggregates
The aggregate assembly of a portion of an undisturbed soil core was examined under a scanning electron microscope (Model Hitachi S-3000N) at an electron acceleration voltage of 20 kV. Prior to scanning, a sample was mounted on a stub using a double sticker and coated with gold using Hummer sputter coating equipment (Anatech Ltd., Union City, CA, USA). Images were captured by automatic image capturing software (Hitachi Science Systems LTD., Schaumburg, IL, USA). Magnifications and linear scale are indicated in the micrographs.
2.7 DNA extraction, microbial gene abundance and diversity analysis
acid) extraction with PowerSoil™ DNA Isolation Kit (Mo-Bio, USA), following the manufacturer’s guide. The con-centration of the DNA extracts was checked with a spec-trophotometer (Eppendorf, Germany), and its integrity and size were checked by using 1.0 % agarose gel electrophore-sis. Extracted DNA was stored at−70◦C prior to molecular bioassay.
Quantitative real-time PCR (polymerase chain reaction) assay was performed on a 7500 real-time PCR system (Ap-plied Biosystems, USA) using SYBR Green (an asymmet-rical cyanine dye commonly used as a nucleic acid stain in molecular biology) as a fluorescent dye. Primer combina-tions of 338F/518R (Øvreås and Torsvik, 1998), ITS1F/ITS4 (Gardes and Bruns, 1993) and Ar109F/Ar915R (Lueders and Friedrich, 2000) were used for bacterial 16S rRNA, fungal internal transcribed spacer (ITS) region and archaeal 16S rRNA genes in the real-time PCR assay.
PCRs were carried out on all PSF DNA samples with spe-cific primers to amplify the 16S rRNA genes from bacteria (27F and 1492R) and archaea (Ar109F and Ar915R) and the ITS regions from fungi (ITS1F and ITS4). The forward primer from each pair had a fluorescent label (6-FAM) at-tached to the 50 end. Amplification of the 16S rRNA gene and ITS regions, purification, digestion and amplicon sepa-ration for T-RFLP (terminal restriction fragment length poly-morphism) analysis is described in the Supplement.
From the T-RFLP profiles, the Shannon diversity index (H0) of the individual T-RFs was calculated following Black-wood et al. (2007), using the equation
H0=6Pi(ln Pi), (1)
where Pi is the proportion of each T-RF in a single sample.
2.8 Soil enzyme activity
Soil enzyme activities relevant to cycling of C, N and P in soils were measured. In detail, activities of invertase, ure-ase and acid phosphature-ase were determined using the meth-ods described by Guan et al. (1986) while β-glucosidase,
β-cellobiosidase and peroxidase were measured using 96 micro-plates colorimetric methods described by Saiya-Cork et al. (2002). For an integrated assessment of microbial bio-chemical activity, the six different enzyme activities analyzed were normalized to give a single value as the normalized en-zyme activity (NEA) of an individual fraction, which was estimated with the following equation:
xi0=Pnxi i=1xi
(i=1,2, . . .,5), (2)
whereiis the number of each soil sample (P0,P50,P100,
P300,P700),x the enzyme activity andx0 the normalized enzyme activity of each soil sample. Subsequently, an arith-metic mean of enzyme activity of each sample was obtained for the NEA.
2.9 Soil respiration
For assessing microbial use of carbon in aggregates of differ-ent size fractions, soil respiration was determined by measur-ing CO2production following an anaerobic laboratory incu-bation protocol by Zheng et al. (2007). A size fraction sam-ple (20 g equivalent dry weight) was placed into a 125 mL glass jar and submerged with 40 mL of distilled water be-fore being gently mixed. The jar was then sealed with a butyl rubber stopper and two Teflon tubes for gas sampling and N2circulation were inserted into the stopper. The headspace was repeatedly evacuated and flushed with N2gas into the jar at a rate of 300 mL min−1for 30 min, which created an anaerobic condition. The jars with soil slurry were incubated in an incubator (LRH-250-S, Medicine Machinery Co. Ltd, Guangdong, China) at 25±1◦C for 37 days. During incuba-tion, a 0.25 mL sample of the headspace gas was collected with a syringe every 5 days starting the third day after in-cubation was initiated. After each gas sampling, N2gas was again flushed into the jar at a rate of 300 mL min−1for 30 min to remove all the emitted gas in the jar. CO2 concentra-tion in a gas sample was determined with a gas chromato-graph (Agilent 4890D) equipped with a stainless steel col-umn (Porapak Q) (80/100 mesh) and flame-ionization detec-tor (FID). Following the procedures described by A. Zhang et al. (2010), the determination was done with an oven tem-perature of 80◦C and a FID temperature of 200◦C, with N2 as the carrier gas at a flow rate of 40 mL min−1and a makeup gas mixture of H2and air at a flow rate of 35 mL min−1. A blank of 40 mL distilled water was used as the control for the gas concentration in the bottle. The total CO2evolved was estimated from the cumulative sum of the gas evolved in all monitoring intervals and was used to calculate the anaerobic soil respiration expressed in terms of soil mass.
2.10 Data treatment and statistical analysis
All data were analyzed using EXCEL 2013 and expressed as mean±standard deviation of triplicate samples. The signif-icant differences between particle size fractions in a single soil and between soils of a single particle size fraction were statistically analyzed by one-way ANOVA with Tukey’s test, using the SPSS software package 20.0. A statistical signifi-cance was defined at a 95 % confidence level.
3 Results
3.1 Organic carbon characterization in aggregate size fractions
Figure 2.Scanning electron microscopy images of aggregates separated with sonication dispersion in water from a topsoil sample of the studied chronosequence.P0,P50,P100,P300 andP700 represent, respectively, the uncultivated mash soil and the rice soils cultivated for 50, 100, 300 and 700 years.
chronosequence. As indicated in Fig. 2, soil aggregates from the initial marsh soil (P0) were sharply edged single indi-vidual minerals and mostly uncovered with clear surfaces; however, in rice soils with increasing rice cultivation lengths, soil aggregates became increasingly round, loosely assem-bled fine minerals but covered with more or less amorphous materials. Particularly inP700, soil aggregates were seen in large size, very loosely assembled unclearly shaped mineral particles with amorphous materials, with some particulate or-ganic matter including some fungal hyphae on the aggregate surface (magnifiedP700 image in Fig. 2).
Soil properties of SOC, total N and LOC were signifi-cantly different among the size fractions and between the uncultivated and rice soils (Table 3). SOC, LOC and total N
Table 2.Particle size distribution (%) of aggregates of the studied chronosequence soils. Lowercase letters indicate a significant (p< 0.05) difference between soils for a single fraction in a column.
Soil Coarse sand Fine sand Silt Clay MWD
(2000–200 µm) (200–20 µm) (20–2 µm) (< 2 µm) (µm)
P0 2.78±0.59c 46.53±1.30a 41.00±2.46a 9.69±0.57d 86.5±6.2c
P50 5.10±0.25b 44.31±0.02b 40.79±0.41a 9.8±0.14d 109.5±2.1b
P100 5.34±0.10b 43.17±0.53c 39.72±0.72a 11.78±0.09c 110.8±1.3b
P300 6.87±1.04a 41.53±1.64d 38.67±0.33a 12.92±0.27b 125.8±7.8a
P700 7.63±1.40a 39.91±5.16d 36.97±3.59a 15.49±0.16a 132.2±8.5a
decreasing order, i.e., coarse-sand fractions > fine-sand frac-tions > silt- and clay-sized fracfrac-tions.
The FTIR spectra showed sharp peaks generally at a vibra-tion of 1050 cm−1 (assigned to polysaccharides) but broad shoulders at a vibration of 3405 cm−1(assigned to aromatic carbon across the aggregate fractions) (Fig. S1). There was a clear trend of decreasing intensity in the polysaccharide peaks but increasing shoulder intensity of aromatic carbon in a single fraction, with increasing rice cultivation. The semi-quantitative data of carbon chemical groups obtained with FTIR analysis is presented in Table 4. Herein, carbon groups in aggregates were dominated by polysaccharides (60–70 %), followed by aromatic carbon (20–39 %) with a small contri-bution (0.6–3.7 %) of aliphatic carbon in a single fraction. The relative proportion of aromatic carbon was lower and polysaccharide carbon higher in the silt fractions as com-pared to the other fractions. Consequently, the estimated SOC chemical recalcitrance (ratio of aromatic to polysaccha-ride C) was the lowest in the silt fractions, followed by the fine-sand fractions, and the highest in the coarse-sand and clay fractions.
Recalcitrance of SOC of in a single fraction was generally lower in uncultivated marsh soil than in the shifted rice soils, but tended to increase with increasing length of rice culti-vation. The fine-sand fraction, bearing the majority of total SOC for the soil (Tables 2 and 3), had a moderate carbon recalcitrance but the coarse-sand fraction had similar carbon recalcitrance but a higher carbon lability and higher C/N ratio. Compared to other fractions, this indicated a greater existence of potentially available carbon pools (POC, for ex-ample) in the coarse-sand fraction,.
3.2 Microbial biomass carbon, microbial gene abundance and diversity
MBC was the highest in the coarse-sand fraction of macroag-gregates and the lowest in the clay-sized fraction of fine croaggregates over the sequence (Table 3). Generally, the mi-crobial quotient (MQ) was not significantly different between the coarse-sand-, fine-sand- and silt-sized fractions but was significantly higher than the clay-sized fractions.
The microbial DNA content (equivalent to biomass) and gene abundance of microbial communities in the fractions
over the chronosequence are shown in Table 5. Total DNA ranged from 1.57 µg g−1 in the silt fraction to 4.00 µg g−1 in the clay fraction of the tidal marsh and from 4.35 µg g−1 in the fine-sand fraction to 35.33 µg g−1in the coarse-sand fraction in rice soils. Fungal ITS gene copies were gener-ally higher in the coarse-sand fractions, decreasing with the size of aggregate fractions. Although there was a general bi-modal pattern among the particle size fractions, total DNA, bacterial and archaeal 16S rRNA gene copy numbers were higher in both coarse-sand and clay fractions, compared to other fractions across the chronosequence. Clearly, microbial gene abundance was dominated by bacterial, with archaeal and fungal gene abundance respectively one and two orders of magnitude lower than bacterial copy numbers across the fractions. The ratio of fungal to bacterial gene abundance generally decreased while that of archaeal to bacterial gene abundance increased with decreasing size of the aggregate fractions.
Over the studied chronosequence, DNA contents of a frac-tion were several folds higher in the rice soils as compared to that of the initial tidal marsh. Accordingly, gene copy num-bers of microbial communities from a fraction were much higher in rice soils than in the initial tidal marsh. Bacterial and fungal abundance in coarse-sand, fine-sand, silt and clay fractions inP50 was increased by 688, 72, 498 and 622 %, and 74, 149, 7 and 152 %, respectively overP0. A mean in-crease in the rice soils cultivated for over 100 years overP0 in bacterial gene copy numbers was seen statistically signifi-cant, with percentages ranging from 73 to 437, 0.4 to 67, 225 to 246 and 147 to 201 %, respectively, in the coarse-sand, fine-sand, silt and clay fractions. Comparatively, changes in fungal gene abundance of aggregates were much smaller across the soils, particularly in the silt- and clay-sized tions. In contrast, archaeal gene abundance in a single frac-tion across the soils increased overP0 consistently with pro-longed rice cultivation, although the increase was smaller in fine-sand- and silt-sized fractions. For the coarse-sand frac-tion only, both the fungal-to-bacterial ratio and the archaeal-to-bacterial ratio tended to increase with increasing rice cul-tivation lengths.
Table 3.SOC, total N and LOC in g kg−1and SMBC in mg kg−1of the size fractions (PSFs) of the soil chronosequence. Different capital and lowercase letters indicate a significant (p< 0.05) difference respectively between fractions of a single soil, and between soils for a single fraction, in a single column.
PSF Soil SOC Total N LOC SMBC
Coarse sand P0 11.07±1.20Ad 1.04±0.11Ad 6.22±0.18Ac not determined (2000–200 µm) P50 53.44±1.09Ab 4.15±0.49Aa 27.85±1.61Aa 794.7±47.0Ac
P100 41.74±1.31Ac 3.37±0.38Ab 19.69±1.16Ab 1052±73.7Ab
P300 40.64±1.57Ac 2.72±0.12Ac 18.80±1.45Ab 1385±88.1Aa
P700 60.79±1.88Aa 4.43±0.22Aa 28.64±1.90Aa 1480±166.2Aa
Fine Sand P0 9.90±0.43Ac 1.01±0.14Ac 4.34±0.14Bb 188.0±8.0Ac (200–20 µm) P50 8.45±0.27Cc 0.73±0.11Dd 3.66±0.57Cb 309.2±16.5Bb
P100 16.48±0.41Cb 1.57±0.14Cb 7.36±0.32Ca 441.1±13.4Ba
P300 15.16±1.45Cb 1.51±0.13Bb 7.03±0.30Ca 445.9±28.2Ba
P700 19.86±1.11Ca 1.81±0.12Ca 7.99±0.65Ba 449.9±25.9Ba
Silt P0 5.13±0.19Bb 0.52±0.14Bd 1.53±0.13Db 166.7±4.5Ad (20–2 µm) P50 10.73±0.55Ba 1.20±0.11Cb 4.50±0.13Ca 296.2±15.0Bc
P100 10.13±0.44Da 1.15±0.09Cc 4.10±0.26Da 287.0±2.7Cc
P300 11.37±0.58Da 1.33±0.11Ba 4.39±0.29Da 392.1±15.0Ba
P700 10.57±0.43Da 1.11±0.08Dc 3.95±0.69Ca 348.3±10.5Cb
Clay P0 9.29±0.29Ac 1.17±0.15Ad 2.96±0.27Cc 155.6±18.1Ac (< 2 µm) P50 19.80±1.47Bb 2.27±0.14Bc 7.99±0.28Bb 284.9±19.7Bb
P100 22.94±1.43Ba 2.70±0.12Bb 9.19±0.35Ba 279.4±5.0Cb
P300 23.45±1.46Ba 2.92±0.12Aa 9.36±0.40Ba 324.8±13.1Ca
P700 24.36±1.65Ba 2.73±0.16Bb 9.05±0.47Ba 325.7±8.1Ca
Abbreviation: SOC: soil organic carbon, LOC: labile organic carbon, SMBC: soil microbial biomass carbon.
Table 4.Relative proportion (%) of carbon chemical groups and carbon recalcitrance (ratio of aromatic to polysaccharide carbon) in size fractions by FTIR analysis. Different capital and lowercase letters indicate a significant (p< 0.05) difference respectively between fractions of a single soil, and between soils for a single fraction.
Size fraction Soil Total aromatic Aliphatic Polysaccharide
Coarse sand P0 28.58±1.41Bc 0.03±0.00Ac 71.41±5.76ABa (2000–200 µm) P50 38.55±5.73Aab 0.50±0.09Aa 60.94±2.54Cb
P100 34.43±3.78ABab 0.27±0.03Ab 65.31±4.72Bab
P300 32.67±0.78ABb 0.28±0.04Ab 67.04±4.66BCab
P700 38.47±1.59Aa 0.37±0.03Ab 61.17±4.30Cb
Fine sand P0 26.30±1.57Ba 0.05±0.01Ab 73.64±4.83ABa (200–20 µm) P50 26.98±1.15Ba 0.04±0.00Bb 72.98±4.43ABa
P100 29.62±1.07Ba 0.13±0.03Ba 70.24±3.47ABa
P300 29.60±1.42Ba 0.07±0.02Bb 70.32±4.60ABa
P700 29.33±1.28Ba 0.17±0.02Ba 70.51±4.09Ba
Silt P0 23.22±1.27Ca 0.01±0.00Ba 76.76±3.81Aa (20–2 µm) P50 23.98±1.50Ca 0.01±0.00Ca 76.02±4.29Aa
P100 22.61±1.32Ca 0.00±0.00Db 77.37±4.73Aa
P300 23.61±1.14Ca 0.00±0.00Db 76.39±4.21Aa
P700 19.87±0.83Cb 0.00±0.00Db 80.14±3.87Aa
Clay P0 33.78±1.69Aa 0.00±0.00Bb 66.20±3.2B2a (< 2 µm) P50 35.46±1.36Aa 0.03±0.00Ba 64.52±4.23Ba
P100 36.10±1.74Aa 0.04±0.01Ca 63.85±4.57Ba
P300 36.02±1.72Aa 0.03±0.01Ca 63.96±4.65Ca
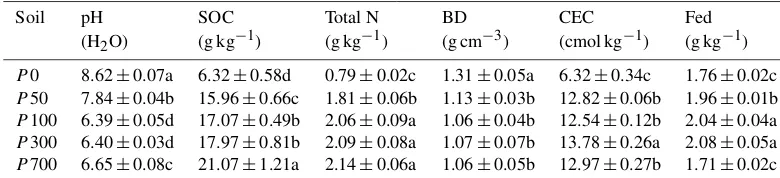
[image:9.612.137.458.442.703.2]Table 5.DNA content (µg g−1), and the copy numbers of bacterial (BA; copies×109g−1), fungi (FA; copies×107g−1)and archaeal (ArA; copies×108g−1)of the size fractions. Different capital and lowercase letters in a single column indicate a significant (p< 0.05) difference respectively between fractions of a single soil, and between soils for a single fraction.
Fraction Soil DNA BA FA ArA
Coarse sand P0 3.32±0.07Ae 5.86±0.75Ad 8.92±1.50Ab 0.81±0.03Ce (2000–200 µm) P50 35.33±0.42Aa 46.18±9.21Aa 15.50±2.60Aa 6.37±0.81Bd
P100 24.72±2.14Ac 31.45±5.79Ab 10.49±0.87Ab 13.54±0.73Bc
P300 16.20±0.05Ad 10.12±2.39Ac 8.12±0.32Ab 16.01±1.06Ab
P700 31.95±0.64Ab 14.25±1.03Ac 9.40±0.71Ab 21.17±0.48Ba
Fine sand P0 3.63±0.28Ab 4.90±0.45Ab 3.23±0.27Bc 2.83±0.18Ac (200–20 µm) P50 4.35±0.40Db 8.42±1.75Ba 8.04±0.25Ba 5.27±1.12Bd
P100 13.63±3.30Ba 7.75±1.18Ca 8.37±0.67Aa 8.16±2.27Cab
P300 9.97±0.33Ba 4.92±1.10Bb 6.23±0.23Bb 3.57±0.24Cb
P700 12.83±0.33Ca 8.16±1.64Ba 2.43±0.19Cd 7.68±0.66Ca
Silt P0 1.57±0.28Bc 1.78±0.15Bc 3.98±0.57Ba 0.29±0.02Dd (20–2 µm) P50 10.02±1.58Ca 10.64±2.95Ba 4.25±0.30Ca 2.48±0.44Cc
P100 8.25±0.12Cab 5.78±0.36Cb 2.17±0.20Bb 8.65±0.09Ca
P300 7.78±0.31Cb 5.91±0.81Bb 2.47±0.45Bb 6.60±0.27Bb
P700 9.25±0.64Da 6.16±0.29Bb 3.68±0.19Ba 9.44±1.41Ca
Clay P0 4.00±1.89Ad 5.27±0.61Ac 0.52±0.03Cd 1.83±0.10Bc (< 2 µm) P50 17.62±0.26Bb 38.05±4.92Aa 1.31±0.07Dc 14.08±2.13Ab
P100 16.20±0.38Bb 15.86±3.31Bb 1.94±0.30Bb 44.66±13.68Aa
P300 11.17±0.90Bc 13.03±2.58Ab 1.39±0.40Cb 22.16±6.17Aa
P700 25.67±0.57Ba 15.63±2.24Ab 2.48±0.31Ca 36.00±3.82Aa
Table S1 of the Supplement. In detail, a Shannon index of the bacterial community was much higher in the coarse-sand fraction and, to a lesser extent, in the clay-sized fraction than in the fine-sand and silt fractions across the chronose-quence. Fungal community Shannon indices generally de-creased with the size of aggregate fractions. In contrast, there were no significant changes in the archaeal Shannon index among the size fractions across the sequence. Generally, the Shannon diversity index of the microbial communities in a single fraction was much higher in the rice soils than in the uncultivated tidal marsh.
3.3 Enzyme activity and basal respiration
All analyzed enzyme activities (Table S2) were increased in the rice soils over the levels measured for the initial tidal marsh soil. Furthermore, NEA was 0.07 in the coarse-sand fraction and 0.10 in the fine-sand fraction as well as 0.07 and 0.14 in the silt and clay fractions inP0. In contrast, NEA was 0.18–0.30 in the coarse-sand fraction and 0.12–0.30 in the fine-sand fraction, but 0.17–0.30 in silt and 0.19–0.24 in clay fraction of the rice soils. Moreover, NEA in a single size frac-tion showed a significantly increasing trend with prolonged rice cultivation (Table 6).
Soil respiration of a single fraction was much higher for the rice soils than for the marsh soil, and in the coarse-sand-sized macroaggregate fraction than in the silt and fine-sand
fractions over the chronosequence (Table 6). In detail, soil respiration was 662 and 565 mg CO2kg−1in the coarse and fine-sand fractions, and 298 and 496 mg CO2kg−1in the silt and clay fractions, respectively, inP0, whereas in rice soils, soil respiration ranged between 1588 and 2914 mg CO2kg−1 in the coarse sand, 1076 and 1256 mg CO2kg−1in the fine-sand, 740 and 1354 mg CO2kg−1 in the silt and 1028 and 1434 mg CO2kg−1 in the clay fractions of the rice soils. Basal respiration in a single size fraction generally increased with rice cultivation length (Table 6).
Table 6. Normalized enzyme activity (NEA) and soil respiration (mg CO2kg−1)of aggregate size fractions of the chronosequence soils. Different capital and lowercase letters in a single column in-dicate a significant (p< 0.05) difference respectively between frac-tions of a single soil, and between soils for a single fraction.
Size fraction Soil NEA Basal respiration
Coarse sand P0 0.07±0.01Bc 662±66Ac (2000–200 µm) P50 0.28±0.03Aa 2345±805Aab
P100 0.18±0.01Ab 2283±506Aab
P300 0.18±0.01Bb 1588±309Ab
P700 0.30±0.05Aa 2914±190Aa
Fine sand P0 0.10±0.01Bc 565±153ABb (200–20 µm) P50 0.12±0.03Cc 1076±139Ba
P100 0.21±0.03Ab 1252±103Ba
P300 0.27±0.03Aa 1256±096Aa
P700 0.30±0.02Aa 1234±143Ba
Silt P0 0.07±0.01Bd 298±053Cc (20–2 µm) P50 0.21±0.02Bb 740±258Bb
P100 0.17±0.01Ac 1246±063Ba
P300 0.25±0.02Ab 1256±071Aa
P700 0.30±0.02Aa 1354±095Ba
Clay P0 0.14±0.01Ac 496±053Bb (< 2 µm) P50 0.19±0.02Bb 1425±430Aa
P100 0.20±0.02Aab 1401±289Aa
P300 0.24±0.02Aa 1028±226Aa
P700 0.23±0.01Ba 1434±196Ba
4 Discussions
4.1 Carbon accumulation vs. stabilization in soil aggregates
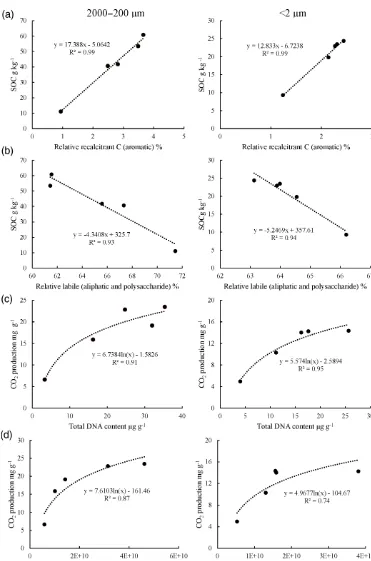
In this study, the level of SOC, soil respiration and micro-bial gene abundance/diversity differed significantly among different size fractions of water-stable aggregates from the chronosequence. Similar to the findings of L. Li et al. (2007) and Zheng et al. (2007), SOC accumulated predominantly in the coarse-sand-sized and moderately in the clay-sized frac-tions, but was depleted in the silt-sized aggregate fractions (Table 3). As shown in Fig. 3a, SOC content in a fraction was positively linearly correlated to organic carbon recal-citrance as determined by the FTIR analysis (Fig. S1; Ta-ble 4), whereas respiration quotient as a rate indicator of car-bon turnover for microbial energy use (Kennedy and Papen-dick, 1995) indicated a significant negative logarithm func-tion of SOC level (Fig. 3b). The divergence of the unculti-vated marsh soil to the rice soils could be attributed to the land use impact as a determinant factor for SOC turnover (Qian et al., 2013). The correlations hereby could suggest the accumulation of SOC in soil aggregates related to chem-ical stabilization against biologchem-ical use for their energy sup-ply, which had been traditionally considered as an inher-ent carbon sequestration with selective persistence of
non-Figure 3.Correlation of carbon recalcitrance (the ratio of aromatic to polysaccharide and aliphatic carbon)(a) and respiration quo-tient(b)to organic carbon level with of the particle size fractions of topsoil of the chronosequence soils.
degradable or residue organic carbon in soils (Lützow et al., 2006; Mikutta et al., 2006).
Calculations using the SOC contents (Table 3) and the fraction mass percentage (Table 2) of a single fraction showed that the amounts of SOC allocated only in the coarse-sand- and clay-sized fractions were closely correlated to the bulk SOC contents (Table 1) of the soils (Fig. S2). This was in general agreement with the findings for similar rice paddy soils from an adjacent area (Pan et al., 2008). The increased allocation of SOC to clay-sized fraction could be attributed to the accelerated formation of clay and hydroxyl Fe/Mn min-erals (Wissing et al., 2013) due to long-term paddy manage-ment (Kölbl et al., 2014).
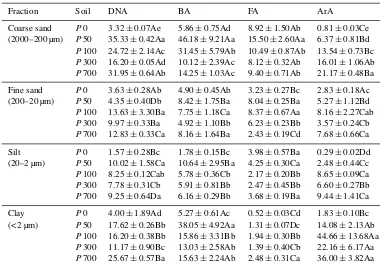
[image:11.612.47.286.130.385.2]Figure 4. Correlation of organic carbon enrichment index (SOC content in a fraction divided by SOC content of the bulk soil) to content of labile carbon of size fractions of soil aggregates of the chronosequence soils. The open circles are those fractions from the uncultivated marsh soil (P0). Closed circles above or below the black long dashed line represent OC enrichment or depletion in a fraction.
in new or labile carbon substrates, more or less related to root fungal activities, and were largely physically protected in mi-croaggregates within mami-croaggregates (Elliott et al., 1986; Jastrow et al., 1998; Six et al., 2000). As shown by Wang et al. (2015), SOC accumulation in bulk soil could be well ac-counted for by the changes in POC of the studied chronose-quence.
Based on the data in Tables 2 and 3, organic carbon protected in the coarse-sand and fine-sand fractions consti-tuted 51–62 % of the total SOC while chemically protected or mineral bound carbon in the clay-sized fractions consti-tuted 11–19 % of the total SOC of soils over the studied se-quence. In a study of river bed sediments from a Califor-nian river basin (Wakeham and Canuel, 2016), light frac-tions contributed largely to the total SOC pool but the heavy (clay) fractions contained smaller amounts of mostly old car-bon. Six et al. (2002a) reported that organic matter accu-mulated mainly as unprotected particulate pools in microag-gregates having a size larger than 53 µm and organic matter intimately associated with silt and clay had high chemical recalcitrance. The higher enrichment of organic carbon re-lated to LOC in macroaggregates of the coarse-sand-sized fraction and smaller enrichment in clay-sized fraction in this study supported the general understanding of relatively fresh labile carbon in macroaggregates and relatively recalcitrant carbon in microaggregates as clay complexes (Six et al., 2002a). Microaggregates and other primary particles could be bound into macroaggregates with a close association of fungal hyphae and organic matter/materials (Oades, 1984; Tisdall, 1994; Miller and Jastrow, 2000).
Physical protection of labile carbon in macroaggregates rather than inherent chemical stability of SOC (a minor mass fraction of the clay-sized microaggregates; Table 2) has been increasingly considered as a mechanism for soil carbon
se-questration (Six et al., 2004; Kong et al., 2005; Six and Paus-tian, 2014). For the rice soils under long-term rice cultiva-tion that were studied here, SOC accumulated and stabilized mainly through physical protection of new or relatively labile carbon in macroaggregates, whereas old or mineral bound SOC was preserved in clay-sized fine aggregates (Marschner et al., 2008). This study also confirmed our previous under-standing that coarse-sand-sized fraction of aggregates could play a prevalent role in soil carbon sequestration (Zhou et al., 2008).
4.2 Bioactivities vs. carbon stabilization between sand-and clay-sized fractions
Biological activity of soil microbes including soil respiration and soil enzyme activity were known to vary across size frac-tions of soil aggregates (Kandeler et al., 1999; Sessitsch et al., 2001; Poll et al., 2003; Allison and Jastrow, 2006). In this study, total DNA content was linearly correlated with content either of SOC and total nitrogen, or of LOC, across the size fractions of the studied sequence (Fig. S3). However, gene abundance of bacterial, fungal and archaeal communi-ties was correlated neither to the size of SOC and LOC nor to measures of carbon recalcitrance and lability (LOC/SOC) across the sequence. Likewise, SOC levels did not neces-sarily affect microbial populations along soil reclamation gradients with exotic carbon amendments (Yin et al., 2000; Torsvik and Øvreås, 2002). Indeed, different carbon lability and accessibility could shape microbial communities within and between size fractions of aggregates (Six et al., 2000; Et-tema and Wardle, 2002; Balser et al., 2006; Kögel-Knabner et al., 2008).
Soil matrix and microhabitat conditions (aggregation and associated nutrients and C substrate as well as redox poten-tial) played a critical role in changes in soil microbial abun-dance and community composition (Lehmann et al., 2011; Smith et al., 2014). Here, a clearly marked difference in mi-crobial abundance and community could be found between the rice soils and the initial marsh soil before the shift to rice cultivation, either for bulk soils (Wang et al., 2015) or for aggregate fractions (Liu et al., 2016b). This could be coinci-dent with the shift in soil physical and chemical conditions between the rice soil and the initial marsh soil, where the lat-ter has alkaline in reaction, poor aggregation due to depleted SOC and high salinity (data in Table 1).
differ-ence in the trend of the LOC-to-SOC ratio and of carbon re-calcitrance (Table 3).
We further compared the bioactivity vs. SOC accumula-tion between coarse-sand- and clay-sized fracaccumula-tions of aggre-gates. Here, a correlation of DNA content, as an indicator of microbial biomass, to SOC content was highly signifi-cant for the coarse-sand fraction but not for the clay fraction (Fig. 6a). Meanwhile, normalized enzyme activity followed a positive linear function with total SOC content for coarse-sand fractions but again not for clay fractions (Fig. 6b). In contrast, soil basal respiration scaled with DNA content re-flected a negative power function with total DNA content, be-ing higher for the coarse-sand fraction than for the clay-sized fraction (Fig. 6c). This could suggest a higher increase with SOC accumulation in carbon use efficiency in the coarse-sand-sized fractions, compared to clay-sized fractions. Fur-thermore, a positively linear correlation of DNA content to the content of LOC (Fig. 6d) was found for the coarse-sand-sized aggregate fractions but not for clay-coarse-sand-sized fractions.
The lack of improvement in bioactivity with SOC accu-mulation in the clay-sized fractions indicated an insignificant potential to support biological activities in fine aggregates rich in stabilized SOC with high recalcitrance. In the clay-sized fractions of aggregates, DNA content was independent of SOC, which could be either inaccessible to microbes or non-degradable due to binding to minerals or as inert car-bon (Lützow et al., 2006; Kögel-Knabner et al., 2008). In contrast, the DNA of microbes, here mainly as bacterial or archaeal in the soils, could be mostly adsorbed on clay min-erals or hidden in small micropores within the fine aggregates (Poll et al., 2003; Chiu et al., 2006). Soil enzyme activities could represent an overall microbial activity for soil func-tioning (Allison et al., 2010), which was not a response to accumulation of SOC in the clay fractions, although extra-cellular enzymes also could be adsorbed onto clay particles (Allison and Jastrow, 2006).
High microbial biomass and enzyme activities were in line with carbon accumulation and stabilization in the coarse-sand-sized macroaggregates. The large response of total mi-crobial DNA and carbon use efficiency to SOC accumulation in the coarse-sand-sized fraction could suggest an improve-ment of either carbon substrate supply or of habitat environ-ment through increases in mass proportion of macroaggre-gates with enhanced aggregation in soils (Lehmann et al., 2011). While containing a recalcitrant carbon pool similar to that in the clay-sized fractions, the macroaggregates in the coarse-sand-sized fractions also preserved a significant amount of labile carbon (Table 3), which could become eas-ily decomposable and potentially used by microbes (Cleve-land et al., 2007). For the bulk soil of this chronosequence, improved microbial activity was linked to the increase in POC content, which was enhanced via physical protection with increasing aggregate stability (Wang et al., 2015). Al-though habitats within macroaggregates offered protection for the young and labile carbon against microbial
decomposi-tion (Gupta and Germida, 2015), enhanced aggregadecomposi-tion could lead to increased population and activities of specific micro-bial groups in-between microaggregates within macroaggre-gates (Six et al., 2002b).
The metabolic quotient qCO2 was proposed as an in-dicator of energy use by live soil microbial organisms (Schlesinger and Andrews, 2000). The data in Tables 3 and S3 clearly demonstrated the lowest qCO2 in the coarse-sand-sized fractions but the highestqCO2 in the clay-sized fractions, among the size fractions of aggregates. Again,
qCO2of the coarse-sand-sized fractions was in a generally decreasing trend with SOC accumulation under prolonged rice paddy management. With soil aggregation improved, macroaggregates could provide increasingly diverse soil mi-crohabitats with varying types of carbon substrates accessi-ble to microbes under sustainaaccessi-ble agricultural management (Six and Paustian, 2014). Improvement of spatial allocation within and between microaggregates of carbon resource, mi-crobial communities and extracellular enzymes could favor growth of microbiota and their functional performance in well-aggregated soils (Caldwell, 2005; Burns et al., 2013).
Many studies on bulk soils showed correlation of enzyme activity with microbial biomass in agricultural soils includ-ing rice paddies under proper management practices (Marx et al., 2005; Allison and Jastrow, 2006; Shi et al., 2006; Yu et al., 2012). Thus, carbon stabilization (indicative of car-bon recalcitrance or respiration quotient) could not restrict microbial activity (Janzen, 2006) in macroaggregates, where highly enriched SOC (particularly of LOC pools) was phys-ically protected, in rice soils under long-term paddy man-agement. This could explain a potential co-evolution of im-proved bioactivity with enhanced carbon sequestration in agricultural soils (Rabbi et al., 2010). As noted by Smith et al. (2014), the relationship between carbon pools and specific microbial communities and biogeochemical activities is still unclear.
4.3 Trend of bioactivity with carbon stabilization after prolonged rice cultivation
Figure 7.Change in partitioning of soil organic carbon (a, g kg−1), total DNA (b, µg g−1), normalized enzyme activity (c; relative enzyme activity index) and soil respiration (d; mg CO2g−1) among coarse and fine-sand fraction (blue base), silt fraction (brown base) and clay fraction (gray base) of soil aggregates over the chronosequence of rice soils (P50–P700) shifted from a salt marsh (P0) under long-term rice cultivation. The size of a circle in a row is relevant to that of an analyzed parameter among the soils.
The above-mentioned directional changes were also seen in soil aggregation, and thus in microhabitat conditions as well as in nutrients (Table 1). SEM observation (Fig. 2) evidenced a clear change in size of the randomly sam-pled aggregates of the soils studied. This was in agree-ment with the change in mean weight diameter (MWD), an indicator of soil aggregate stability, with increasing rice cultivation length over the chronosequence (Wang et al., 2015). There were dispersedly distinct, sharply edged and less organic-matter-covered mineral particles in the uncul-tivated tidal marsh (P0). However, aggregates became larger in size and softer, and more porous with minute mineral par-ticles bound together by organic matter in rice soils culti-vated over 100 years. This is particular the case for P700, where the coarse-sand-sized macroaggregates were highly porous and soft, containing smaller-sized microaggregates with some string-like particulate organic matter on the
In a previous study (Wang et al., 2015), bulk-soil car-bon accumulation and promotion of biological activity was concomitant with carbon stabilization through POC accumu-lation, in line with aggregate stability with long-term rice cultivation. Here we synthesize all the analysis data with respect to aggregate size fraction partitioning over the se-quence (Fig. 7). After salt marsh soil (P0) was converted to rice cultivation (P50), SOC, enzyme activity and soil res-piration showed a more or less consistent increase in both coarse-sand- and clay-sized fractions. The changes in rela-tive portion by sand-sized (coarse- and fine-sand fractions together) aggregates against silt- and clay-sized aggregates exerted different patterns between of carbon pools and of mi-crobial activities, across the soils of the chronosequence.
Over the sequence, the prevalence of physically protected organic carbon in coarse and fine-sand fractions as compared to the percentage of physically unprotected organic carbon in the silt and clay fractions (Six et al., 2002a) were in a range of 1.5–3.2 and 1.1–2.6 for SOC and total N, respec-tively, 0.9–2.2 for total DNA, 1.2–3.3 for fungal gene copy numbers and 0.8–1.5 for NEA. In contrast, the prevalence of archaeal copy numbers and soil respiration was in a range of 2.6–1.0 and 2.0–1.3, decreasing with rice cultivation lengths. Therefore, most analyzed carbon pools and bioactivities were dominated by the macro- and large microaggregates in size fractions of coarse and fine-sand, which was in general a consistent directional change with prolonged paddy manage-ment under long-term rice cultivation, although abundance of clay particles was consistently increased (Kölbl et al., 2014). Long-term SOC sequestration in agricultural soils has been questioned (Powlson et al., 2011) and SOC enriched in coarse-sand fractions of aggregates could indeed be sub-ject to fast decomposition in dry condition, for example, after shifting to maize cropping (Z. P. Li et al., 2007). In this study, however, hydroagric paddy management was kept continuous with ever prolonged rice cultivation, which could have driven the ever increasing trend of SOC accumulation up to the millennium (Wissing et al., 2011, 2013). Con-sequently, SOC accumulation and stabilization could take place in coarse-sand-sized aggregates with physical protec-tion of labile carbon pool intra-microaggregates, with pro-longed rice cultivation (Wang et al., 2015). POC, as a pool of relatively fast turnover (Cambardella and Elliott, 1992), also has been shown to keep increasing in paddies culti-vated for centuries (Wang et al., 2015). Allison and Jas-trow (2006) suggested that microbial biochemical activity and carbon turnover was stronger in POC-enriched size frac-tions but weaker in mineral-dominated fracfrac-tions, where en-zymes and their carbon substrates were immobilized on mineral surfaces. Long-term hydroagric paddy management (Zhang and Gong, 2003) reduced decomposition of root-, crop- or microbial-residue input under low-oxygen condi-tions (Roth et al., 2011). Moreover, the changes in relative proportion of carbon pools and microbial activities (NEA and soil respiration) by aggregates in the size of coarse and
fine-sand further demonstrated that physically protected and sta-bilized carbon supported high soil bioactivities in macroag-gregates, which has been increasingly prevalent over the smaller-sized fractions of soil aggregates.
The changes in organic carbon pools and the accessibility to microbes could lead to changes in the relative abundance and activity of microbes, potentially affecting C cycling and storage, in different size aggregates (Six et al., 2006). Unlike the findings of Allison and Jastrow (2006), this study pro-poses enhanced microbial activity but improved carbon use efficiency with reduced respiration quotient for microbial en-ergy in coarse-sand-sized macroaggregates, compared to clay fraction over centuries of rice cultivation. This could be sup-ported by the recent finding thatqCO2was reduced and that the microbial biomass carbon increased in biochar-amended agricultural soils in a case study by Zheng et al. (2016) and in a meta-analysis by Zhou et al. (2016). This study indicated a strong interlink between microbiological activity and labile carbon in large-sized aggregates of paddy soils, though the later has been generally considered as physically protected carbon. As strengthened with prolonged rice paddy manage-ment, such a link could help enhance ecosystem functioning and services provided by rice soils (Six and Paustian, 2014; Smith et al., 2015).
Unfortunately, the methodology used here did not allow us to characterize the spatial allocation of carbon substrate, specific microbial communities and extracellular enzyme ac-tivities among the aggregate fractions. More importantly, la-bile OC pools, particularly those intra-aggregates or inter-microaggregates within macroaggregates, could not be fur-ther explored. Such data are considered to be critical to un-ravel the microscale process mediating bioactivities at the ag-gregate level (Six and Paustian, 2014).
5 Conclusions
micro-bial carbon use efficiency and improve their biogeochemical activity related to ecosystem functioning. More studies are needed on interaction of soil organic matter, minerals and mi-crobial communities to unravel the microscale process medi-ating bioactivities at the aggregate level.
The Supplement related to this article is available online at doi:10.5194/bg-13-6565-2016-supplement.
Author contributions. Ping Wang contributed to the soil aggregate separation and carbon pool analysis, and Yalong Liu contributed to the soil biological activity.
Acknowledgements. This study was partially funded by China Natural Science Foundation under grant no. 40830528. The PhD fellowships for the first two authors were awarded with the Priority Academic Program Development of Jiangsu Higher Education Institutions, China. The international cooperation was partially sup-ported by State Foreign Expert Agency with a “111” project under grant no. B12009. The authors are grateful to David Crowley from the University of California Riverside for editing the manuscript.
Edited by: Z. Jia
Reviewed by: two anonymous referees
References
Allison, S. D. and Jastrow, J. D.: Activities of extracellular enzymes in physically isolated fractions of restored grassland soils, Soil Biol. Biochem., 38, 3245–3256, 2006.
Allison, S. D., Wallenstein, M. D., and Bradford, M. A.: Soil-carbon response to warming dependent on microbial physiology, Nat. Geosci., 3, 336–340, 2010.
Balser, T. C., McMahon, K., Bart, D., Bronson, D., Coyle, D., Craig, N., Flores-Mangual, M., Forshay, K., Jones, S., and Kent, A.: Bridging the gap between micro-and macro-scale perspectives on the role of microbial communities in global change ecology, Plant Soil, 289, 59–70, 2006.
Bannert, A., Kleineidam, K., Wissing, L., Mueller-Niggemann, C., Vogelsang, V., Welzl, G., Cao, Z., and Schloter, M.: Changes in diversity and functional gene abundances of microbial communi-ties involved in nitrogen fixation, nitrification, and denitrification in a tidal wetland versus paddy soils cultivated for different time periods, Appl. Environ. Microb., 77, 6109–6116, 2011. Banwart, S., Black, H., Cai, Z., Gicherud, P., Joosten, H., Victoria,
R., Milne, E., Noellemeyer, E., Pascual, U., Nziguheba, G., Var-gas, R., Bationo, A., Buschiazzo, D., De-Brogniez, D., Melillo, J., Richter,D., Termansen, M., Van Noordwijk, M., Goverse, T., Ballabio, C., Bhattacharyya, T., Goldhaber, M., Nikolaidis, N., Zhao, Y., Funk, R., Chris, D., Pan, G., La Scala, N., Gottschalk, P., Batjes, N., Six, J., Van Wesemael, B., Stocking, M., Bampa, F., Bernoux, M., Feller, C., Lemanceau, P., and Montanarell, L.:
Benefits of soil carbon: report on the outcomes of an interna-tional scientific committee on problems of the environment rapid assessment workshop, Carb. Manag., 5, 185–192, 2014. Bardgett, R. D. and van der Putten, W. H.: Belowground
biodiver-sity and ecosystem functioning, Nature, 515, 505–511, 2014 Blackwood, C. B., Hudleston, D., Zak, D. R., and Buyer, J. S.:
In-terpreting ecological diversity indices applied to terminal restric-tion fragment length polymorphism data: insights from simulated microbial communities, Appl. Environ. Microb., 73, 5276–5283, 2007.
Blair, G. J., Lefroy, R. D., and Lisle, L.: Soil carbon fractions based on their degree of oxidation, and the development of a carbon management index for agricultural systems, Crop Pasture Sci., 46, 1459–1466, 1995.
Blanco-Canqui, H. and Lal, R.: Mechanisms of carbon sequestra-tion in soil aggregates, Crit. Rev. Plant Sci., 23, 481–504, 2004. Burns, R. G., DeForest, J. L., Marxsen, J., Sinsabaugh, R. L.,
Stromberger, M. E., Wallenstein, M. D., Weintraub, M. N., and Zoppini, A.: Soil enzymes in a changing environment: current knowledge and future directions, Soil Biol. Biochem., 58, 216– 234, 2013.
Caldwell, B. A.: Enzyme activities as a component of soil biodiver-sity: a review, Pedobiologia, 49, 637–644, 2005.
Cambardella, C. A. and Elliott, E. T.: Particulate soil organic-matter changes across a grassland cultivation sequence, Soil Sci. Soc. Am. J., 56, 777–783, 1992.
Chen, J. H., Sun, X., Li, L., Liu, X., Zhang, B., Zheng, J., and Pan, G.: Change in active microbial community structure, abundance and carbon cycling in an acid rice paddy soil with the addition of biochar, Euro J. Soil Sci., 67, 857–867, doi:10.1111/ejss.12388, 2016.
Chen, L. and Zhang, G.: Parent material uniformity and evolution of soil characteristics of a paddy soil chronosequence derived from marine sediments, Act. Pedol. Sin., 46, 753–763, 2009. Chen, L., Zhang, G., and Effland, W.: Soil characteristic response
times and pedogenic thresholds during the 1000-year evolution of a paddy soil chronosequence, Soil Sci. Soc. Am. J., 75, 1807– 1820, 2011.
Chen, L., Zhang, G., and Jin, Z.: Rare earth elements of a 1000-year paddy soil chronosequence: Implications for sediment prove-nances, parent material uniformity and pedological changes, Geoderma, 230, 274–279, 2014.
Cheng, Y. Q., Yang, L. Z., Cao, Z. H., Ci, E., and Yin, S.: Chronose-quential changes of selected pedogenic properties in paddy soils as compared with non-paddy soils, Geoderma, 151, 31–41, 2009. Chiu, C. Y., Chen, T. H., Imberger, K., and Tian, G.: Particle size fractionation of fungal and bacterial biomass in subalpine grass-land and forest soils, Geoderma, 130, 265–271, 2006.
Cleveland, C. C., Nemergut, D. R., Schmidt, S. K., and Townsend, A. R.: Increases in soil respiration following labile carbon addi-tions linked to rapid shifts in soil microbial community compo-sition, Biogeochemistry, 82, 229–240, 2007.
Conrad, R.: The global methane cycle: recent advances in under-standing the microbial processes involved, Environ. Microbiol. Rep., 1, 285–292, 2009.
Cui, J., Li, Z., Liu, Z., Ge, B., Fang, C., Zhou, C., and Tang, B.: Physical and chemical stabilization of soil organic carbon along a 500-year cultived soil chronosequence originating from estuarine wetlands: Temporal patterns and land use effects, Agr. Ecosyst. Environ., 196, 10–20, 2014.
Deng, S. Q. and Xu, M. X.: A protocol of separating water stable aggregates from rice soils and its application, Acta Pedo. Sin., 13, 229–234, 1965 (in Chinese).
Dungait, J. A., Hopkins, D. W., Gregory, A. S., and Whitmore, A. P.: Soil organic matter turnover is governed by accessibility not recalcitrance, Glob. Change Biol., 18, 1781–1796, 2012. Ellerbrock, R., Höhn, A., and Rogasik, J.: Functional analysis of
soil organic matter as affected by longterm manurial treatment, Eur. J. Soil Sci., 50, 65–71, 1999.
Elliott, E. T.: Aggregate structure and carbon, nitrogen, and phos-phorus in native and cultivated soils, Soil Sci. Soc. Am. J., 50, 627–633, 1986.
Ettema, C. H. and Wardle, D. A.: Spatial soil ecology, Trends Ecol. Evol., 17, 177–183, 2002.
Gajda, A. M.: Microbial activity and particulate organic matetr con-tent in soils with diffrerent tillage system use, Int. Agrophys., 24, 129–137, 2010.
Gardes, M. and Bruns, T. D.: ITS primers with enhanced speci-ficity for basidiomycetes – to the identification of mycorrhizae and rusts, Molec. Ecol., 2, 113–118, 1993.
Gong, Z., Zhang, G., Wang, J. Z., Jia, H. Y., Shen, H., and Lu, J. C.: Anthorosols, in: Gong, Z., Chinese Soil Taxonomy: Priciples, Methodology and Application. Science Press, Beijing (China), 109–131, 1999.
Guan, S., Zhang, D., and Zhang, Z.: Soil enzyme and its research methods, China Agriculture Press, Beijing, 274–297, 1986. Gupta, V. V. and Germida, J. J.: Soil aggregation: Influence on
mi-crobial biomass and implications for biological processes, Soil Biol. Biochem., 80, A3–A9, 2015.
Janzen, H. H.: The soil carbon dilemma: shall we hoard it or use it?, Soil Biol. Biochem., 38, 419–424, 2006.
Jastrow, J. D., Miller, R. M., and Lussenhop, J.: Contributions of interacting biological mechanisms to soil aggregate stabilization in restored prairie, Soil Biol. Biochem., 30, 905–916, 1998. Jiang, X., Liu, W., Liu, Q., Jia, Z., Wright, A. L., and Cao, Z.: Soil N
mineralization, nitrification and dynamic changes in abundance of ammonia-oxidizing bacteria and archaea along a 2000 year chronosequence of rice cultivation, Plant Soil, 365, 59–68, 2013. Joergensen, R. G.: The fumigation-extraction method to estimate soil microbial biomass: calibration of the k EC value, Soil Biol. Biochem., 28, 25–31, 1996.
Kalbitz, K., Kaiser, K., Fiedler, S., Kölbl, A., Amelung, W., Bräuer, T., Cao, Z., Don, A., Grootes, P., and Jahn, R.: The carbon count of 2000 years of rice cultivation, Glob. Change Biol., 19, 1107– 1113, 2013.
Kandeler, E., Stemmer, M., and Klimanek, E.-M.: Response of soil microbial biomass, urease and xylanase within particle size frac-tions to long-term soil management, Soil Biol. Biochem., 31, 261–273, 1999.
Kandeler, E., Tscherko, D., Bruce, K., Stemmer, M., Hobbs, P. J., Bardgett, R. D., and Amelung, W.: Structure and function of the
soil microbial community in microhabitats of a heavy metal pol-luted soil, Biol. Fert. Soils, 32, 390–400, 2000.
Kandeler, E., Mosier, A. R., Morgan, J. A., Milchunas, D. G., King, J. Y., Rudolph, S., and Tscherko, D.: Response of soil microbial biomass and enzyme activities to the transient elevation of carbon dioxide in a semi-arid grassland, Soil Biol. Biochem., 38, 2448– 2460, 2006.
Kennedy, A. C. and Papendick, R. I.: Microbial characteristics of soil quality, J. Soil Water Conserv., 50, 243–248, 1995. Kögel-Knabner, I., Guggenberger, G., Kleber, M., Kandeler, E.,
Kalbitz, K., Scheu, S., Eusterhues, K., and Leinweber, P.: Organo-mineral associations in temperate soils: integrating bi-ology, mineralogy, and organic matter chemistry, J. Plant Nutr. Soil Sc., 171, 61–82, 2008.
Kölbl, A., Schad, P., Jahn, R., Amelung, W., Bannert, A., Cao, Z., Fiedler, S., Kalbitz, K., Lehndorff, E., and Müller-Niggemann, C.: Accelerated soil formation due to paddy management on marshlands (Zhejiang Province, China), Geoderma, 228, 67–89, 2014.
Kong, A. Y., Six, J., Bryant, D. C., Denison, R. F., and van Kessel, C.: The relationship between carbon input, aggregation, and soil organic carbon stabilization in sustainable cropping systems, Soil Sci. Soc. Am. J., 69, 1078–1085, 2005.
Lagomarsino, A., Grego, S., and Kandeler, E.: Soil organic carbon distribution drives microbial activity and functional diversity in particle and aggregate-size fractions, Pedobiologia, 55, 101–110, 2012.
Lehmann, J. and Kleber, M.: The contentious nature of soil organic matter, Nature, 528, 60–68, 2015.
Lehmann, J., Solomon, D., Kinyangi, J., Dathe, L., Wirick, S., and Jacobsen, C.: Spatial complexity of soil organic matter forms at nanometre scales, Nat. Geosci., 1, 238–242, 2008.
Lehmann, J., Rillig, M. C., Thies, J., Masiello, C. A., Hockaday, W. C., and Crowley, D.: Biochar effects on soil biota – a review, Soil Biol. Biochem., 43, 1812–1836, 2011.
Li, L., Zhang, X., Zhang, P., Zheng, J., and Pan, G.: Variation of or-ganic carbon and nitrogen in aggregate size fractions of a paddy soil under fertilisation practices from Tai Lake Region, China, J. Sci. Food Agr., 87, 1052–1058, 2007.
Li, Q.: Paddy Soils of China, Science Presss, Beijing, China, 1992 (in Chinese).
Li, Z. P., Pan, G., and Zhang, X. H.: Topsoil organic carbon pool and13C natural abundance changes from a paddy after 3 years corn cultivation, Acta Ped. Sin., 44, 244–251, 2007 (in Chinese with English summary).
Liu, D., Liu, X., Liu, Y., Li, L., Pan, G., Crowley, D., and Tipp-kötter, R.: Soil organic carbon (SOC) accumulation in rice paddies under long-term agro-ecosystem experiments in south-ern China – VI. Changes in microbial community structure and respiratory activity, Biogeosciences Discuss., 8, 1529–1554, doi:10.5194/bgd-8-1529-2011, 2011.
Liu, Y., Wang, P., Crowley, D., Liu, X., Chen, J., Li, L., Zheng, J., Zhang, X., Zheng, J., and Pan, G.: Methanogenic abundance and changes in community structure along a rice soil chronosequence from east China, Eur. J. Soil Sci., 67, 443–455, 2016a.