Scalable Knowledge Extraction and Visualization for Web Intelligence
Arno Scharl webLyzard technology & MODUL University Vienna
Albert Weichselbraun webLyzard technology & University of Applied Sciences Chur
Max Göbel
Vienna University of Economics and Business [email protected] Walter Rafelsberger webLyzard technology [email protected] Ruslan Kamolov MODUL University Vienna [email protected]
Abstract
Understanding stakeholder perceptions and assessing the impact of campaigns are key questions of commu-nication experts. Web intelligence platforms help to answer such questions, provided that they are scalable enough to analyze and visualize information flows from volatile online sources in real time. This paper pre-sents a distributed architecture for aggregating Web content repositories from Web sites and social media streams, memory-efficient methods to extract factual and affective knowledge, and interactive visualization techniques to explore the extracted knowledge. The presented examples stem from the Media Watch on Climate Change, a public Web portal that aggregates environmental content from a range of online sources.
1. Introduction
Media analytics applications have been developed for various domains including sports [7], politics [2] and climate change [10], often focusing on specific aspects such as event detection [1] or the annotation of video broadcasts [2]. To provide actionable knowledge and support decisions, such media analytics systems face two major challenges:
x compile and annotate large document collections from online sources – heterogeneous in terms of authorship, formatting, style (e.g. news article vs. tweets), and update frequency;
x provide a visual user interface to select the most relevant subsets of the information space, and to analyze and visualize the extracted information. Contextual information, when properly disambigu-ated, plays a vital part in addressing both challenges and can improve several steps in the processing pipe-lines of media analytics platforms. Contextual infor-mation can guide content acquisition via focused crawling [6], increase the accuracy of knowledge
ex-traction algorithms, and help to understand the role of affective knowledge in human decision-making [4].
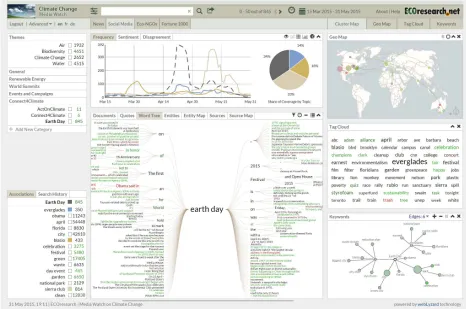
The Media Watch on Climate Change (MWCC)1 and the U.S. Climate Resilience Toolkit (CRT)2 are two public showcases of the technologies presented in this article. Shown in Figure 1, MWCC is a content aggre-gator on climate change and related environmental issues [10], while CRT was developed in response to U.S. President Barack Obama’s Climate Action Plan to provide expert knowledge and a suite of analytic tools to help citizens and communities manage climate-related risks and opportunities [3].
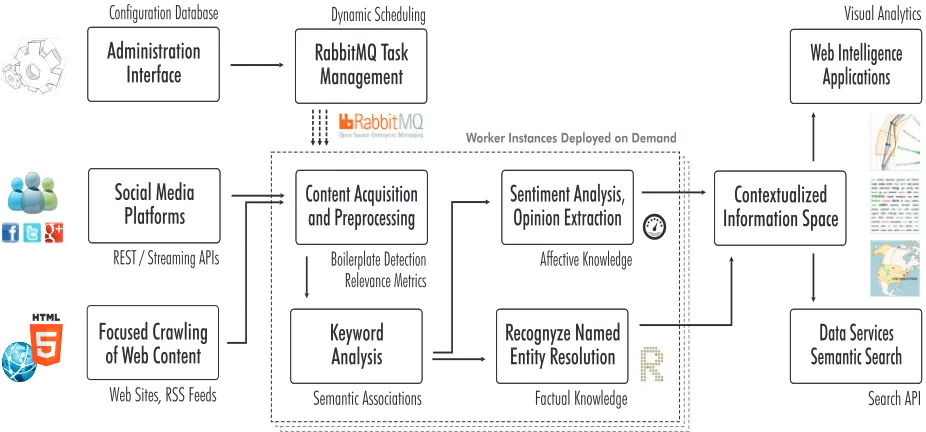
Using the distributed processing architecture of the webLyzard Web intelligence and media analytics plat-form [26] shown in Figure 2, both applications compile large archives of relevant Web content from multiple online sources, and provide visual tools to access and analyze this content [10].
MWCC has provided the data feeds for the exam-ples presented in this paper. The portal aggregates mul-tilingual content from English, French and German online sources – social media including Facebook, Twitter, Google+ and YouTube, and the Web sites of news agencies, Fortune 1000 companies and environ-mental NGOs. Exploring the role of user-generated content archives as a “knowledge commons” [9], MWCC is currently being extended into a collective awareness platform through the DecarboNet.eu project, with a focus on knowledge co-creation processes.
The remainder of this paper is structured as fol-lows: Section 2 describes the system architecture in-cluding queue management, virtualization and content filtering techniques. Section 3 presents knowledge ex-traction techniques and algorithmic optimizations that enable to process the gathered Web content in real time, and to create a contextualized information space spanning geospatial, temporal and social dimensions.
1
http://www.ecoresearch.net/climate
2
Figure 1. Visual dashboard of the Media Watch on Climate Change (www.ecoresearch.net/climate)
Methods to analyze and visualize this information space presented in Section 4 shed light on stakeholder perceptions, reveal information flows, and provide indicators for assessing the impact of environmental education and awareness campaigns.
2. Content Acquisition and Preprocessing
Figure 2 illustrates the content acquisition pipeline. The system pursues a hybrid strategy of real-time up-dates from streaming APIs and focused crawling of Web content by processing and enriching data from unstructured and structured evidence sources.
A dynamic task scheduling component uses the MWCC portal configuration to allocate resources to content acquisition and preprocessing tasks – i.e., fo-cused crawls of Web sites and RSS feeds, real-time updates of social media sites, or keyword analyses.
The webLyzard platform uses the scalable and flex-ible messaging broker service RabbitMQ [25] to dis-tribute these tasks to worker instances, which perform the content acquisition and processing tasks. Kernel-based Virtual Machines [22] and Docker [18] images enable the dynamic creation and destruction of worker instances based on the current system load and number of pending tasks. Although virtualization ensures a
scalable content acquisition and processing pipeline, additional steps are taken to manage the volume and dynamic nature of online content. Efficient pre-processing and filtering removes irrelevant content at an early stage of the processing pipeline. This reduces the number of documents that later need to be pro-cessed by the computationally more expensive knowledge extraction algorithms (see Section 3).
Boilerplate detection, if required, identifies over-view pages and extracts the main content from news articles, blogs and Web pages. Locality sensitive hash-ing [8] to identify near duplicates and a domain speci-ficity measure allow removing irrelevant content at an early stage. The domain specificity measure uses a combination of blacklists and whitelists to assess the relevance of gathered documents in the context of the targeted domain – i.e., climate change and related envi-ronmental issues in the case of the MWCC portal.
3. Knowledge Extraction
Figure 2. Overview of the distributed processing architecture of the webLyzard platform
For properly answering such questions, the Media Watch on Climate Change needs to extract both factual as well as affective knowledge.
3.1. Factual versus Affective Knowledge
Factual Knowledge includes concepts, instances, and relations among identified entities.MWCC utilizes
Recognyze [13], a named entity recognition and resolu-tion component that draws upon structured external knowledge repositories such as DBpedia [16], Free-base [19] and GeoNames [20] to identify, classify and disambiguate named entities – people, organizations, and locations. Confidence values align entities with external knowledge repositories or corporate databases, resulting in a continuously evolving knowledge reposi-tory that helps to better understand networks and the dynamic relations [1] among their actors.
Affective Knowledge includes sentiment and other emotions expressed in a document, which are captured and evaluated by opinion mining algorithms [11; 12]. Lexical methods rely on sentiment lexicons, which contain known sentiment terms and their respective sentiment values. The ratio of positive and negative terms in a document is a common indicator of overall polarity that is often used for classifiers. Even when considering negations and intensifiers, such methods are computationally inexpensive.
More advanced algorithms rely on dependency parsing or integrate external semantic knowledge ba-ses. This significantly increases the computational de-mands and calls for more effective approaches to store, retrieve and analyze Web content (see Section 3.2).
Combining factual and affective knowledge creates synergies – the factual knowledge of Recognyze, for example, helps to contextualize the sentiment analysis process, to process ambiguous sentiment terms, and to detect opinion holders and opinion targets.
3.2. Ensuring Maximum Scalability
The extraction of knowledge from unstructured Web content repositories benefits from distributed pro-cessing strategies that allocate computational resources dynamically, taking into account the nature of a given task and the current status of the infrastructure. Further performance gains can be achieved by optimizing the storage, integration and analysis of lexicons and exter-nal databases, and by using the derived artifacts for real-time text searches. A particularly well-suited data structure for performing these operations are Directed Acyclic Word Graphs (DAWGs), which in contrast to
prefix trees [5] efficiently encode suffixes as well as prefixes and support fast and efficient searches.
Figure 3 shows the DAWG representation of the following ten words: success, successes, successful, successfully, successfulness, succession, successions, successive, successively and successiveness. In this example, the common prefix “success” is represented in a single node. Colored nodes indicate word ends and following the node structure to a colored node yields the strings, encoded in the corresponding path.
The DAWG representation allows efficient string searches, covering all encoded terms in parallel. A search compares a string sequence s = {s1, … sm} with
the letters available in the graph structure g = {n1i,
s
e f
i
s
u l l
n
y
o v
n
e e s
succes
Figure 3. Visual representation of a Directed Acyclic Word Graph (DAWG)
If the graph contains a node for every letter of the string sequence, and the final node nmi encodes a word
end, the search has been successful. The search time is only influenced by the length of the strings encoded in the DAWG, but not by the number of strings.
The Recognyze component also cascades DAWG representations for disambiguation – e.g., by combin-ing searches for ambiguous company names with words which typically indicate a company name such
as “Inc.”, or “Corp.”. Recognyze provides the “.jet” format for building and serializing this data structure.
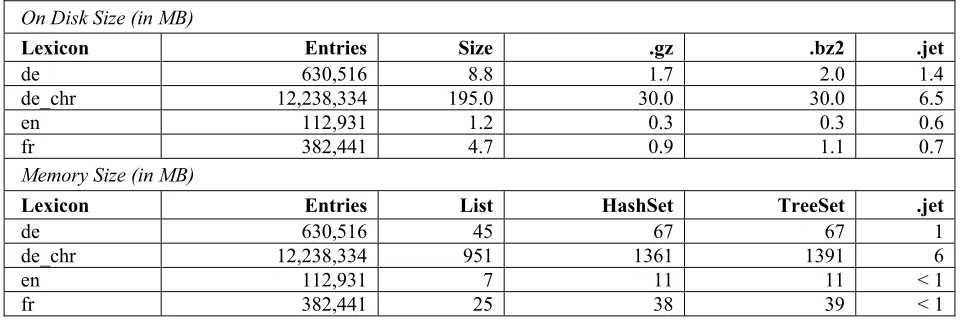
Table 1 compares the performance and storage re-quirements of the .jet representation with the standard Java implementations ArrayList, HashSet and TreeSet. The experiments draw upon the English, French and German versions of the hunspell lexicon [21], which has been extended using the unmunch utility included in the hunspell distribution. In addition, a German lexi-con (de_chr) obtained from the Chromium project [15] has been used in the experiments. These lexicons are also used in Recognyze for pre-processing and classify-ing company names. All tests have been performed on
an HP ProLiant Server with 128 GB RAM, a 32-core Intel Xeon E5-2650 2.00 GHz CPU and OpenJDK 7u65 (using a single core to increase reliability).
Table 1 reflects the memory efficiency of the .jet format, especially when used to encode large dictionar-ies such as the German Chromium lexicon (de_chr). In such cases, the .jet format even outperforms compres-sion algorithms such as gzip and bzip2. These results are particularly noteworthy when considering lookup performance. The listed lookup times have been de-termined based on a randomly chosen, balanced sam-ple of 500,000 set items and 500,000 items that are not part of the set. As expected, the lookup times for lists cannot compete with speeds obtained from sets and the .jet format. The .jet format’s performance lies between the HashSet and a TreeSet, yet it provides a much leaner representation of the lookup strings in terms of memory consumption. Although the HashSet performs better for single lookups, it does not support parallel searches for all strings encoded in the HashSet which is a key feature of the DAWG representation.
Table 1. Comparative evaluation of the .jet format using a Directed Acyclic Word Graph (DAWG) representation
On Disk Size (in MB)
Lexicon Entries Size .gz .bz2 .jet
de 630,516 8.8 1.7 2.0 1.4
de_chr 12,238,334 195.0 30.0 30.0 6.5
en 112,931 1.2 0.3 0.3 0.6
fr 382,441 4.7 0.9 1.1 0.7
Memory Size (in MB)
Lexicon Entries List HashSet TreeSet .jet
de 630,516 45 67 67 1
de_chr 12,238,334 951 1361 1391 6
en 112,931 7 11 11 < 1
Lookup Time for 1 Million Entries (in ms)
Lexicon Entries List HashSet TreeSet .jet
de 630,516 > 1E6 209 1237 626
de_chr 12,238,334 > 1E6 251 2428 694
en 112,931 > 1E6 55 569 452
fr 382,441 > 1E6 88 912 404
4. Visualizing the Extracted Knowledge
The scalability gains described in the preceding section allow the real-time extraction of knowledge from Web-scale content streams. Operating on such content streams, the MWCC visual dashboard [10] shown in Figure 1 reveals popular issues being dis-cussed in conjunction with specific topics. The various dashboard components combine factual and affective knowledge to reveal the context of online discussions. This includes interactive trend charts for the temporal context of frequency and sentiment data (Section 4.1), a geographic map for regional context (Section 4.2), and an entity map to depict relations among identified people, organizations and locations (Section 4.3).
Across all these visualizations, color coding con-veys affective knowledge – i.e., average document sentiment ranging from green (positive) to grey (neu-tral) and red (negative).
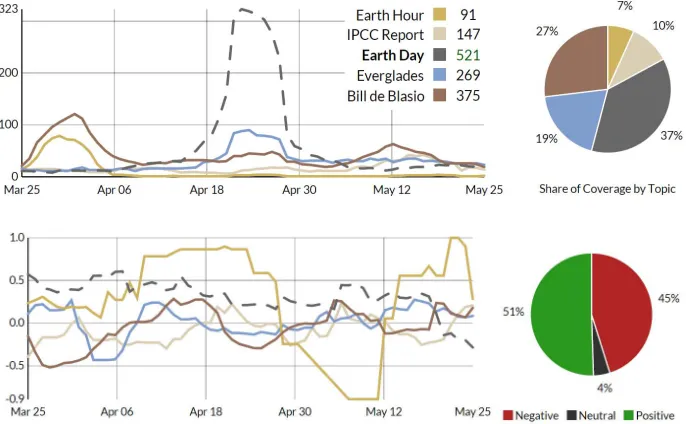
The presented examples are based on more than 125,000 documents about Earth Day 2015 – from 150 Anglo-American news media sites, blogs, Web 2.0 platforms (including Twitter, Facebook, Google+, and YouTube), scientific outlets, and the websites of envi-ronmental organizations and Fortune 1000 companies.
4.1. Trend Chart
The trend chart shown in Figure 3 reflects the evo-lution of topics. Whenever a different combination of sources or topics is selected, dynamic transitions show how these changes affect the displayed data set. Hover-ing above data points displays tooltips with weekly content statistics and associated keywords. This helps to investigate an issue and identify who or what has triggered an observable trend. A sentiment filter allows restricting the analysis to either positive or negative online coverage. The entity map presented in Section 4.3 uses a circular version of the trend chart to depict semantic associations between topics and entities.
4.2. Geographic Map
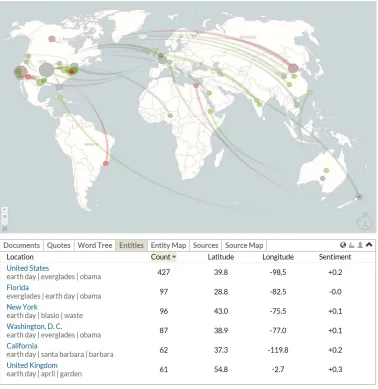
Once a user has entered a search query, MWCC ranks the matching results by relevance, date, or graphic location. The results are projected onto a geo-graphic map that shows the regional distribution of Web content – e.g., references to locations that co-occur with the term “earth day” as shown in Figure 4. The position of circles is determined by the geographic coordinates of these references, their size is propor-tional to the number of matches for a specific location.
Figure 5. Geographic map and references to locations in conjunction with the search term “earth day” in Anglo-American news media coverage between March and May 2015
When rendering documents in their geospatial con-text, the system distinguishes between source and tar-get information – i.e., the authors’ locations versus the primary locations referenced in the documents, which is determined by applying the above mentioned
Recognyze component to a geo-tagging process (the table underneath the map shows a list of the identified geographic entities, sorted by decreasing co-occurrence frequency with “earth day”; the grey keywords under-neath each location name are semantic associations determined through co-occurrence analysis).
4.3. Entity Map
To identify opinion leaders and reveal key factors influencing social conversations about a topic, the webLyzard platform detects not only locations, but also other named entities such as people and organiza-tions that have an impact on news and social media
Figure 6. Entity Map showing people and organizations related to the search term “earth day” in Anglo-American news media coverage between March and May 2015, the relation strength among those entities,
and their association with selected topics.
Radial Convergence Diagram. Located in the cen-ter of the graph, the radial convergence diagram dis-plays relations among different entities using ribbons. Entity names are displayed along a circle – their font size indicates the number of documents that mention the entity, their color ranges from red to green depend-ing on the average sentiment (in line with the sentiment color coding of the word tree and the geographic map). The thickness of an arc represents the number of co-occurrences between an entity pair. On mouse-over, the opacity of arcs that connect the selected entity to other entities is increased. A slider element in the low-er left cornlow-er controls the level of detail in the radial convergence diagram – i.e., determines the threshold for showing relations among entities. The second slider in the lower left corner adjusts the number of entities to be shown, between a minimum of five and a maximum of 20 entities.
Line Chart. Surrounding the radial convergence di-agram in the center, the data points in the line chart show the number of co-occurrences between an entity
and the selected topics – e.g., Earth Day, ActOnCli-mate and Connect4Climate in Figure 5. To increase readability and facilitate comparisons across topics, the line chart uses a logarithmic scale.
Both components are being updated via animated transitions. Users can select which entity types to dis-play (people, organizations and locations) and sort them by (i) the number of documents which reference the entity in descending order, (ii) the average senti-ment of documents containing the entity, from positive to negative, (iii) alphabetically by name, and (iv) by
5. Summary and Conclusion
The Web intelligence platform presented in this pa-per is a big data application for the real-time analysis of Web-scale content streams – extracting factual and affective knowledge from these collections, and estab-lishing relations between identified topics and named entities such as people, organizations, and locations. The Media Watch on Climate Change [23] is a public showcase of this platform that aggregates multilingual Web content from English, French and German Web sites (news media, Fortune 1000 companies, munici-palities and environmental organizations), and from social media platforms including Twitter, Facebook, Google+ and YouTube.
The Recognyze named entity resolution component analyzes the collected text resources to identify named entities. Disambiguation algorithms then align these entities with related items in external structured reposi-tories such as DBpedia.org, Freebase.com and
GeoNames.org. To achieve the required scalability for encoding and processing the massive amounts of data contained in such repositories, a distributed processing strategy couples virtualization and dynamic resource allocation with optimized data structures based on di-rected acyclic word graphs for managing lexicons and external databases.
Interactive visualizations allow users to explore the resulting information space, combining factual and affective knowledge to reveal contextual information in online discussions. The presented examples include
trend charts to depict the temporal context of Web coverage, a geospatial projection to show its regional distribution, and an entity map to explore relations be-tween referenced topics and entities.
The extraction and visualization of context infor-mation transforms collections of Web content into val-uable repositories of actionable knowledge. This knowledge helps analyst to better understand the im-pact of communication campaigns on public opinion and decision making on both individual and collective levels. Thereby, the presented techniques benefit a wide range of organizations including enterprises, non-government entities, news media outlets, science agen-cies, and policy makers. Revealing online trends can help these organizations to adopt better strategies for engaging audiences, guide their communication and public outreach campaigns, and increase the effective-ness of their decision making processes.
Three European research initiatives are currently extending the Web intelligence and visual analytics platform presented in this paper. The ASAP Project [14] increases the scalability of the underlying meth-ods, while the PHEME Project [24] enriches their func-tionality by adding veracity detection to reveal online
myths and rumors. The DecarboNet Project [17] ex-tends the Media Watch on Climate Change into a col-lective awareness platform that supports collaborative editing with real-time content recommendations, and reveals how information is created and shared in com-munities of environmental stakeholders.
Acknowledgement. The work presented in this paper
has been conducted as part of the research projects
DecarboNet.eu, PHEME.eu and ASAP-FP7.eu, which have received funding by the European Union’s 7th Framework Program for research, technology devel-opment and demonstration under the Grant Agree-ments No. 610829, 611233 and 619706; and the Radar Media Criticism Switzerland project funded by the Swiss National Science Foundation (No. 150327).
6. References
1. Adams, B., Phung, D. and Venkatesh, S. (2011). Eventscapes: Visualizing Events Over Times with Emotive Facets. 19th ACM International Conference on Multimedia (MM-2011). Scottsdale, USA:1477-1480. 2. Diakopoulos, N., Naaman, M. and Kivran-Swaine, F.
(2010). Diamonds in the Rough: Social Media Visual Analytics for Journalistic Inquiry. IEEE Symposium on Visual Analytics Science and Technology (VAST-2010). Salt Lake City, USA: IEEE:115-122
3. Duffy, P.B., Colohan, P., et al. (2014). "Empowering America's Communities to Prepare for the Effects of Climate Change: Developing Actionable Climate Science Under the President's Climate Action Plan", American Geophysical Union, Fall Meeting 2014. San Francisco, USA. A1.
4. Hoang, T.-A., Cohen, W.W., et al. (2013). Politics, Sharing and Emotion in Microblogs. IEEE/ACM International Conference on Advances in Social Networks Analysis and Mining. Niagara Falls, Canada: ACM Press:282-289.
5. Knuth, D.E. (1997). The Art of Computer Programming, Volume 3: Sorting and Searching (2nd ed). Upper Saddle River: Addison-Wesley.
6. Mangaravite, V., Assis, G.T.d. and Ferreira, A.A. (2012). Improving the Efficiency of a Genre-aware Approach to Focused Crawling Based on Link Context. Eighth Latin American Web Congress (LA-WEB 2012). Cartagena de Indias, Colombia: IEEE CPS:17-23. 7. Marcus, A., Bernstein, M.S., et al. (2011). Twitinfo:
Aggregating and Visualizing Microblogs for Event Exploration. 2011 Annual Conference on Human Factors in Computing Systems (CHI-11). Vancouver, Canada: ACM:227-236.
9. Pitt, J., Bourazeri, A., et al. (2013). “Transforming Big Data into Collective Awareness”, IEEE Computer, 46(6): 40-45.
10. Scharl, A., Hubmann-Haidvogel, A., et al. (2013). “From Web Intelligence to Knowledge Co-Creation – A Platform to Analyze and Support Stakeholder Commu-nication”, IEEE Internet Computing, 17(5): 21-29. 11. Weichselbraun, A., Gindl, S. and Scharl, A. (2013).
“Extracting and Grounding Contextualized Sentiment Lexicons”, IEEE Intelligent Systems, 28(2): 39-46. 12. Weichselbraun, A., Gindl, S. and Scharl, A. (2014).
“Enriching Semantic Knowledge Bases for Opinion Mining in Big Data Applications”, Knowledge-Based Systems, 69: 78-86.
13. Weichselbraun, A., Streiff, D. and Scharl, A. (2014). Linked Enterprise Data for Fine Grained Named Entity Linking and Web Intelligence. 4th International Conference on Web Intelligence, Mining and Semantics (WIMS-2014). Thessaloniki, Greece: ACM Press.
Online Resources
14. ASAP Project | www.asap-fp7.eu 15. Chromium Project | www.chromium.org 16. DBpedia | www.dbpedia.org
17. DecarboNet | www.decarbonet.eu 18. Docker | www.docker.io
19. Freebase | www.freebase.com 20. GeoNames | www.geonames.org
21. Hunspell Spell Checker | hunspell.sourceforge.net 22. Kernel Virtual Machine | www.linux-kvm.org 23. Media Watch on Climate Change |