for transportation systems
B. Chand1, K. H¨ahre2, J. Keghie1, and S. Dickmann1
1Fundamentals of Electrical Engineering, Helmut-Schmidt-University/University of the Federal Armed Forces,
Hamburg, Germany
2Power Electronics, Helmut-Schmidt-University/University of the Federal Armed Forces, Hamburg, Germany
Correspondence to: B. Chand ([email protected])
Abstract. There are many reasons, why electric drive sys-tems will be used in future more frequently in transportation systems. The electrification allows a flexible use of different energy sources and thus creates a greater independence from fossil energy. However, electric drive systems are a challenge for the manufacturers of transportation systems. The electri-cal powertrain can not only be exposed to interferences, it may also emit interferences into components and commu-nication cables in the vicinity. This can be a high risk for the drive system and for the passengers. For that reason, an EMC study of an electrical powertrain for transportation sys-tems is presented. There the interference at the unshielded high-voltage cable (HV-cable) is characterized. The analysis of the influence of position variation of the communication cable with respect to the unshielded HV-cables is one main aspect. Different optimizations have been added to the test setup.
1 Introduction
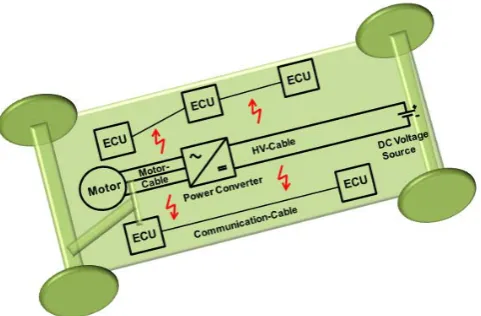
Almost every manufacturer of transportation systems extends his portfolio of products with electric drives. Not only a greater independence from fossil energy, but also more re-strictive EMC-standards force the manufacturers to restruc-ture their research and development departments. The elec-trical powertrain (Fig. 1) can not only be influenced from outside, it can also emit disturbances. These disturbances are critical, when important communication lines are influenced, which could put the drive or the safety of the passengers at risk. A simplified study was done in Weber et al. (2003). An extension to practical cases is done here. In addition, the interferences on the unshielded HV-cables are characterized. In transportation systems the HV-cables are distributed over the whole vehicle. Therefore the position between the
HV-Fig. 1. Electrical powertrain and nearby Electronic Control Units
(ECUs) in an automobile.
cables and existing communication lines can vary. And these different positions yields to different coupling behaviours.
For this reason, the position of the communication lines to the HV-cables is an essential point in this study. Further-more, the influence of variations of some parameters is stud-ied. These parameters which are taken into consideration are the motor speed, the PWM-frequency, the terminations and the load. An optimized control unit for the power converter is developed and built up in this study, and optimizations on the measurement setup are done. Different communication cables are used for comparison.
2 Components of the test setup
228 B. Chand et al.: An EMC study of an electrical powertrain for transportation systems
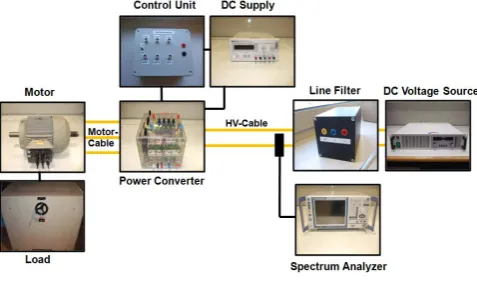
Fig. 2. Measurement setup.
This topic was presented in Kosonen and Ahola (2009). But this contribution shows, that disturbances are also present on the HV-cables at the DC side. Due to packaging reasons, the HV-cables are distributed over the whole vehicle and therefore could influence all components in the vehicle. The motor cables in Fig. 2 are kept very short or inserted into the housing of the motor, to minimize electromagnetic emissions.
2.1 DC voltage source
For the electrification of the powertrains, DC voltages from some hundred Volts to more than 1000 V, depending on the power of the motor, are commonly used. In this study an adjustable source with maximum 350 V and 6.5 A is used.
2.2 Power converter
Power Converters generate from DC voltage/DC current a mono- or multiphase AC voltage/AC current with an ad-justable frequency.
The frequency setting is done by a control unit. The schematic design of the inverter is given in Fig. 3.
Two capacitors are used for smoothing and for buffering. The IGBT drivers control the six IGBTs, which are con-nected to form three half-bridges. At each of the transistors a freewheeling diode is attached, to protect the IGBTs from overvoltage. The inductors describe the motor in star circuit. The branch next to the two capacitors is the chopper. The chopper is used for recovery of the voltage, which is gener-ated due to switching of the IGBTs. By matched time switch-ing of the IGBTs an approximate three-phase sine wave is produced.
2.3 Control unit
A control unit for the inverter has been designed and built up in this study. It includes a 32-bit flash microcontroller, on the base of an ARM Cortex microcontroller architecture. With this control unit it is possible to create a three-phase PWM. Discontinuous step voltage profiles (e.g. rectangular patterns) cause electromagnetic interference, while by us-ing the PWM method, a good approximation of a sine curve
Fig. 3. Equivalent circuit of the power converter.
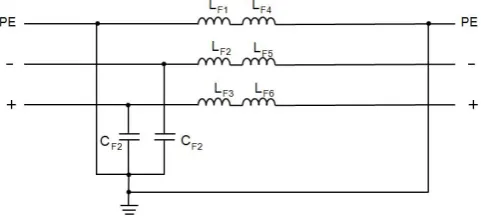
Fig. 4. Equivalent circuit of the DC-filter.
is created. Optocouplers are used for galvanic isolation of the signals. By using this control unit, it is possible to con-trol the motor speed and the PWM-frequency. It should be noted, that the PWM frequency is chosen sufficiently large in comparison to the rotational frequency to obtain a good sine wave, and thus to ensure smooth running of the engine.
2.4 Motor
For the electrification of transportation means, direct current motors, asynchronous motors, synchronous motors and vari-ous coupled variants are used. In this study, a 5.5 kW asyn-chronous motor has been used, since induction motors are very robust and therefore widely used.
2.5 Load
Since the motor without a load only draws a small cur-rent, various loads can be used to allow considerable current flow. An elegant way to achieve this, are adjustable resistors, which are connected in parallel in a star circuit to the motor. Thus the current can be drawn from the system according to the values of the resistors.
2.6 Cables
Fig. 5. Comparison of the results with filter and without filter, for
the lower frequency range.
single wire is a copper wire with 0.75 mm2cross section with a PVC jacket. The twisted-pair cable consists of two twisted wire strands, each 0.25 mm2, each with a PVC sheath. The single wire represents the communication line for the LIN-Bus. While the bus line for the CAN-Bus and FlexRay-Bus is described by the twisted-pair cable.
2.7 Spectrum analyzer
The measurements are done using a signal analyzer with re-spect to IEC-CISPR16-2-1 (2008).
3 Optimization of the test setup
The measurements of the HV-cables show strong interfer-ences, which come from the internal pulsed power supplies of the DC source. Since these unwanted interferences would distort the measurement results, a DC-filter (Fig. 4) was con-structed and further optimized with simulations for the re-quired frequency range.
The Figs. 5 and 6 show the results with and without filter for both frequency ranges. One can see a good attenuation of interferences from the pulsed DC voltage source. The filter improves the signal from the DC source significantly.
4 Measurements and evaluation
4.1 Optimized measurement setup
The interconnection of the components described in Sects. 2 and 3 yields the test setup shown in Fig. 7. The measure-ments are carried out in an Absorber Line Shielded Enclosure (ALSE) in order to avoid interferences from outside.
Fig. 6. Comparison of the results with filter and without filter, for
the upper frequency range.
Fig. 7. Components of the whole test setup, connected to one
pos-sible measurement setup.
The spectrum has been measured with a current measuring clamp. Since the current through the cables is also of interest, one can calculate it using the frequency-dependent coupling factorkof the clamp (Eq. 1).
I
dBµA= U
dBµV + k
dB1 (1)
4.2 Characterization of the HV-cable
230 B. Chand et al.: An EMC study of an electrical powertrain for transportation systems
Fig. 8. Composition of the interference.
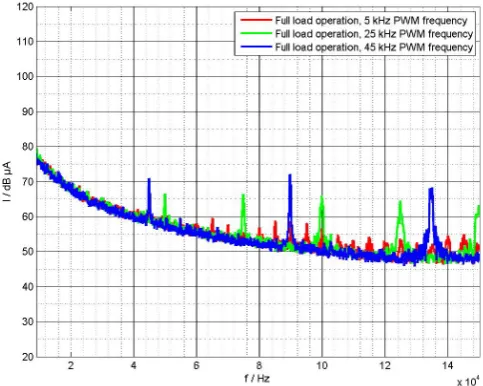
Fig. 9. Comparison of the results for different PWM-frequencies,
for the lower frequency range.
HV-cables is composed of the frequency dependent internal interferences of the components, as illustrated by the follow-ing results in Fig. 8.
4.3 Influence of the motor speed, the PWM-frequency and the load of the engine
The change of the motor speed respectively the rotational frequency at constant PWM-frequency, does not change the interference behaviour. This is because the resulting short-term disturbances are of transient nature and not considered here, since the frequency is measured under steady state con-dition. A change in the PWM-frequency at constant motor speed, however, shows a change of gradient. The higher the
Fig. 10. Comparison of the results for different load currents, for
the upper frequency range.
PWM-frequency, the higher the interference currents are and thus more resonances appear. In the lower frequency range, the PWM-frequencies and the multiples are clearly visible, (Fig. 9). Since higher PWM-frequencies lead to higher am-plitudes, the PWM-frequencies should be kept as small as possible. But small PWM-frequencies lead to poor quality of the produced sine wave form. For these reasons a com-promise between sufficiently high and minimum necessary PWM-frequency have to be found. An increase of the load, which results in an increase of the current, shows no signif-icant differences in the frequency range of 9–150 kHz. In the upper frequency range of 150 kHz–30 MHz, the magni-tude changes of course at a higher current, but also the signal form of the interference. The signal form of the interference changes, because for different current/voltage ratio the con-ducted interference of the components changes internally, as shown in Fig. 10.
4.4 Increasing the distance between the communication cable and the HV-cables
Increasing the distance between the measured cable and the HV-cable in a parallel configuration yields as expected to de-creasing magnitude.
In Fig. 11, three different values (5 cm, 10 cm, 30 cm) are used for the parallel distance between the cables. A decreas-ing of the parallel distance yields further to an increasdecreas-ing of the same ratio of dB of the interference current.
4.5 Change of the height profile of the measured cable with respect to the reference surface
Fig. 11. Influence of position variation of the communication cable
with respect to the HV-cables in a parallel configuration, for the upper frequency range.
influence on communication lines of different heights over a reference surface is studied. One side of the cable is set up 15 cm above the ground surface, the other is 5 cm above the ground plane. The result shows that such variation of the height profile of communication lines over a reference plane has a negligible influence on the interference behaviour for the studied case.
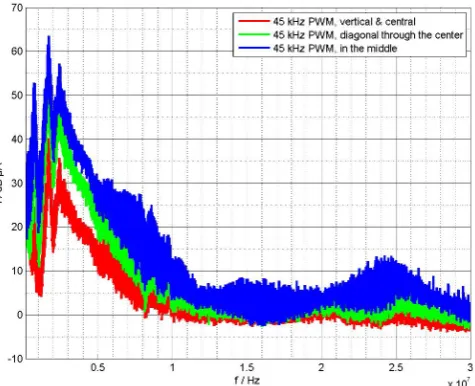
4.6 Communication cable between the HV-cables, diagonally across the HV-cables and perpendicular to the HV-cables
Furthermore, the influences of positioning the communica-tion cable diagonally across the HV-cables, perpendicular to the HV-cables and between the HV-cables are compared. The results in Figs. 12 and 13 shows on the communication cable in the middle of the two HV-cables the most interferences. The inclined position of the measured cable causes a lower coupling of the interference current due to the coupling pat-tern of the E-and H-fields. The lowest coupling is thus ob-tained for vertically and centrally located communication ca-ble. The change of the position of the communication cable yields up to 23 dB lower interferences.
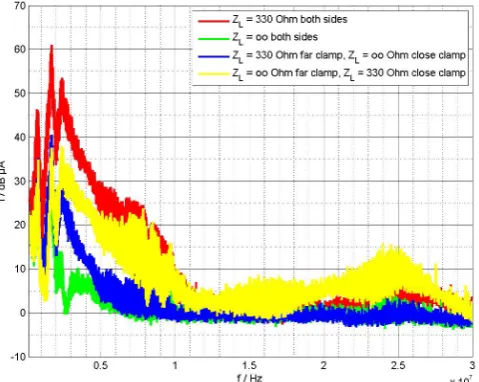
4.7 Influence of cable terminations at the communication cable
Another important point is the investigation of the influence of the communication cable terminations. The terminations describe the input resistances in the ECUs in bus systems. The following Fig. 14 shows the results of the measurements with the different terminations.
Fig. 12. Influence of position variation of the communication cable
with respect to the HV-cables, for the lower frequency range.
Fig. 13. Influence of position variation of the communication cable
with respect to the HV-cables, for the upper frequency range.
It can be seen, that the terminations influence the standing wave patterns on the cables. There is a direct correlation between the choosen terminations and the current magnitude that can be measured. The differences can be up to 40 dB, so it is necessary to consider the termination values well.
4.8 Comparison of single wire and twisted-pair cable
232 B. Chand et al.: An EMC study of an electrical powertrain for transportation systems
Fig. 14. Comparison of the results for different terminations for
both ends of the communication cable, for the upper frequency range.
Fig. 15. Comparison of the results for single wire and twisted-pair
cable as communication cable, for the B-Band.
Fig. 15. For that reason, as few wires as possible should be used. It should be noted, that the disturbances on the com-munication lines are common mode interferences.
The resulting currents can yield to load-voltages in Volt-ranges, depending on the terminations and on the voltage and current magnitude of the sources. For that reasons the inter-ferences from the electrical drives to the communication sys-tems should not be neglected, in order to avoid an influence up to a destruction of the communication.
5 Conclusions
In this paper an EMC study of an electrical powertrain for transportation systems is presented. The disturbance at the unshielded HV-cable is characterized. The analysis of the in-fluence of position variation of the communication cable with respect to the unshielded HV-cables is studied. Furthermore, this contribution discussed the influence due to the variation of parameters like the motor speed, the PWM-frequency, the terminations and the load. An optimized control unit for the power converter is developed and built in this study, and op-timizations at the test setup are done.
Due to different positions of the communication cables to the HV-cables the results were significantly improved.
To achieve a suppression of interferences on the commu-nication lines, a meaningful positioning of commucommu-nication cables with respect to HV-cables is encouraged. Using the knowledges gained in this contribution, the safety of the communication links can be increased.
References
IEC-CISPR16-2-1: Specification for radio disturbance and immu-nity measuring apparatus and methods Part 2-1: Methods of mea-surement of disturbances and immunity – Conducted disturbance measurements, 2008.
Kosonen, A. and Ahola, J.: Comparison of signal coupling methods for power line communication between a motor and an inverter, 2009, IET 2009, IET Electric Power Applications, 431–440, doi: 10.1049/iet-epa.2009.0114, 2009.