Irrigation
Uniformity
BRADLEY
A.
KING, JEFFREY C. STARK, AND DENNIS C. KINCAID/
ncreasing production efficiency is becoming a major theme for producers in order to maintain or increase their economic return in an increasingly competitive global market. In the case of irrigated agri-culture, producers must also address increasing public concern about wa-ter conservation, wawa-ter quality, and environmental protection.
Two irrigation management issues require attention in order to maxi-mize production efficiency. These are irrigation scheduling and irriga-tion uniformity. Irrigairriga-tion schedul-ing involves determinschedul-ing the proper amount and timing of water applica-tions throughout the growing season. Proper irrigation scheduling results in irrigation applications that supply the water needs of the crop without the development of deficit or excess soil moisture conditions.
riiSTER
COPY
Universityof Idaho
jigajlarildtire
BUL 824420
ue
I I I
-5 to 3 -3 to -1 -1 to 1 1 to 3 Irrigation - ET (in)
Over-irrigation 35
LtMB CU = 70%
30 Ma CU = 90%
3 to 5
Under-irrigation
O 10 20 30 40 50 60 70 80 90 100 Percent of field area
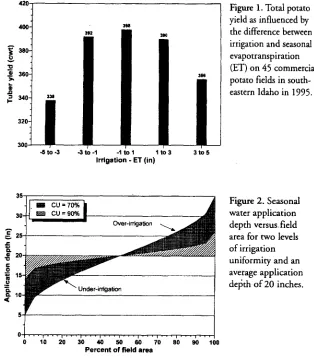
Figure 1. Total potato yield as influenced by the difference between irrigation and seasonal evapotranspiration (ET) on 45 commercial potato fields in south-eastern Idaho in 1995.
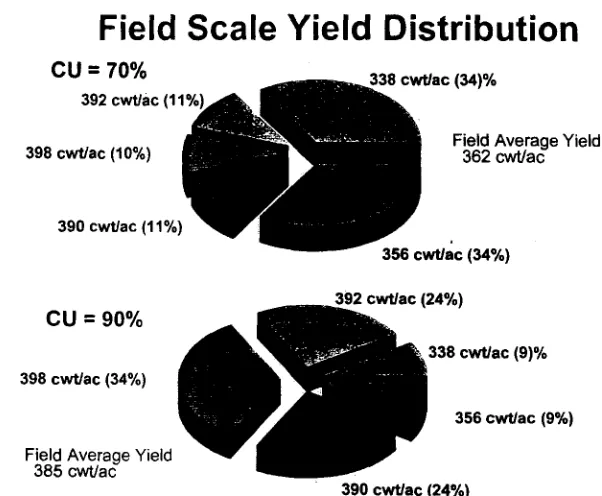
Figure 2. Seasonal water application depth versus field area for two levels of irrigation uniformity and an average application depth of 20 inches.
400- 380-o
o
2
▪
360-2
ei -g
▪
340-
320-300 Both over- and under-irrigation
re-duce crop yield and/or quality. For ex-ample, Figure 1 shows the impact of over- and under-irrigation on potato yield. The data shown in Figure 1 were collected from an irrigation manage-ment study of 45 commercial fields un-der sprinkler irrigation in southeast-ern Idaho during 1995. A mere 10 per-cent departure of seasonal water ap-plication from seasonal evapotranspi-ration (ET) can begin to decrease tu-ber yield and impact quality. Yield re-duction due to over-irrigation can be attributed to poor soil aeration, in-creased incidence of disease, and leach-ing of mobile nutrients below the crop root zone. In general, over- and un-der-irrigation adversely impact the yield and quality of all crops.
While the results shown in Figure 1 emphasize the importance of proper irrigation scheduling in attaining maxi-mum yield and quality, irrigation uni-formity is just as important. Irrigation uniformity describes how evenly an ir-rigation system distributes water over the field area. The most common quantitative measure of irrigation uni-formity is the Christiansen uniuni-formity coefficient (CU). The CU provides a quantitative measure of the average de-viation from the mean application depth relative to the mean application depth. When water application is per-fectly uniform, which is impossible on a field scale, the CU is 100 percent. Field evaluation of irrigation unifor-mity requires considerable effort. De-tails on sampling requirements, pro-cedures, and calculation of the CU can be found in the American Society of Agricultural Engineers Standards (ASAE, 1999).
The numerical significance of the CU is illustrated in Figure 2 using a cumulative frequency distribution of
seasonal water application depth ver-sus field area. The cumulative fre-quency distributions shown in Figure 2 are applicable to sprinkler and microirrigation systems. Figure 2 graphically shows cumulative water application distributions for CU val-ues of 70 and 90 percent with a sea-sonal average water application of 20 inches. By definition, half of the field area receives less than the average ap-plication depth and half of the field area receives more than the average ap-plication depth. Lower CU values re-sult in greater deviations from the av-erage application depth as illustrated by the greater extremes in water ap-plication depth for a 70 percent CU versus a 90 percent CU.
The usefulness of the relationships shown in Figure 2 stems from the graphical representation of cumulative seasonal water application. For ex-ample, 20 percent of the field area re-ceives 13.9 inches of water or less when the irrigation system has a CU of 70 percent compared to 0 percent of the field area when the irrigation system has a CU of 90 percent. Assuming sea-sonal ET for the potato yield data shown in Figure 1 is 20 inches, a sea-sonal water application of 17 inches or less would be expected to result in a tuber yield reduction of 60 cwt/ac (from 398 to 338 cwt/ac) or more. Based on the graphs in Figure 2, 34 percent of the field area would receive less than 17 inches with an irrigation
Field Scale Yield Distribution
CU = 70%
392 cwt/ac (11%)
Field Average Yield
362 cwt/ac
390 cwtlac (11%)
356 cwtlac (34%)
392 cwt/ac (24%)
338 cwt/ac (9)% 398 cwt/ac (34%)
356 cwt/ac (9%)
390 cwt/ac (24%)
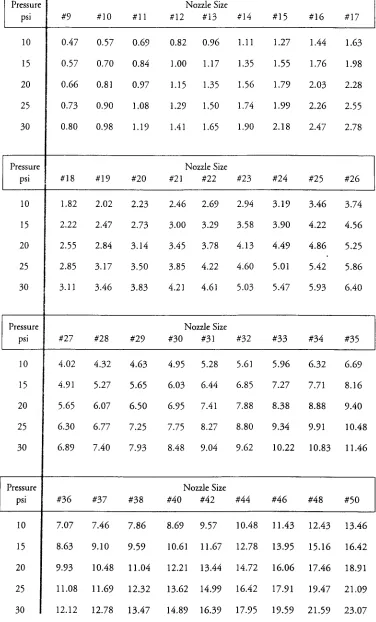
Figure 3. Comparison of estimated field scale potato yield for two levels of irrigation uniformity.
338 cwtlac (34)%
398 cwt/ac (10%)
CU = 90%
Field Average Yield 385 cwt/ac system having a CU of 70 percent, but
only 9 percent of the field would re-ceive less than 17 inches with a CU of 90 percent. Maximum yield is ex-pected to occur on 34 percent of the field when the irrigation system has a CU of 90 percent but only on 10 per-cent of the field when the irrigation system has a CU of 70 percent. Thus, total yield would be lower with the lower uniformity since a much larger portion of the field would receive over-or under-irrigation. This is summa-rized in Figure 3 which shows the ex-pected yield distribution at both CU levels resulting from combining the data of Figures 1 and 2. Overall, total yield increases 6 percent, from 362 cwt/ac to 385 cwt/ac, by increasing the CU from 70 percent to 90 percent. The estimated irrigation uniformity effects on yield, quality, and gross re-ceipts are summerized in Table 1. Tu-ber quality data is based on the 1995 irrigation study depicted in Figure 1. The estimated increase in gross receipts firm increasing CU from 70 to 90 per-cent is $144/acre. Smaller increases in CU would generate smaller increases in gross receipts. Tuber quality will likely be more variable when the irri-gation system has a low CU. The per-centage of field area receiving deficit
water application can be reduced by additional irrigation, but overall pro-duction will not increase because the additional irrigation causes over-irri-gation on other portions of the field, which reduces yield there.
Application system type, design, physical condition, and the operating
environment largely determine irriga-tion uniformity. A high degree of con-trol is required to achieve high irriga-tion uniformity. Only irrigairriga-tion sys-tems which precisely control the amount and location of water appli-cation are capable of high irrigation uniformity.
Table 1. Estimated irrigation uniformity effects on yield, grade and gross receipts for Russet Burbank. Irrigation
Uniformity cwt/acreTotal
Yield
U.S. No. l's
cwt/acre
Ito 14 oz
cwt/acre
Incentive
Adjusted Price Gross Receipts
$/cwt $/acre
70% 362 277 138 4.74 1716 90% 385 310 148 4.83 1860 Difference 23 33 10 0.09 144
MANAGING IRRIGATION SYSTEMS FOR HIGH CU
The various types of irrigation ap-plication systems require varying lev-els of management and attention to different operational details to achieve high irrigation uniformity. Following installation of an irrigation system, it becomes the irrigation manager's re-sponsibility to maintain the level of ir-rigation uniformity. The key items re-quiring attention that can be manipu-lated to achieve high irrigation unifor-mity are described below by irrigation application system type.
Center pivot and linear-move systems
Center pivot and linear-move irri-gation systems equipped with new pressure-regulated, low-pressure sprin-kler packages are capable of attaining CU values of 90 to 95 percent. A CU value of 85 percent is generally con-sidered to be the minimum value be-low which a system needs updating or maintenance. Center pivot sprinkler nozzle sizes are selected by computer to attain a high degree of irrigation uniformity for a given sprinkler model and available spacing. Nozzle sizes must be installed in the correct locations along the center pivot lateral for opti-mum system performance. In general, sprinklers on center pivot and linear-move systems have an overlap factor of two to four which results in very uni-form water application. Computer simulations of water application depth with wind-affected sprinkler patterns indicate that winds below 10-12 mph have little effect on application unifor-mity. Wind tends to shift the applica-tion pattern downwind while largely maintaining the irrigation uniformity under no-wind conditions.
In the case of center pivot and lin-ear-move systems, factors that influence
irrigation uniformity can produce a ran-dom effect or cumulative effect. Ran-dom effects are less important as they tend to even out over the course of the irrigation season. Wind is the most common factor which produces a ran-dom effect on irrigation uniformity. Cumulative effects are more important as they result in differences in water application that increase throughout the irrigation season. Worn or malfunc-tioning equipment and improper de-sign and installation are the most com-mon factors that produce cumulative effects on irrigation uniformity.
The primary objective in the main-tenance of a center pivot or linear-move irrigation system is to maintain the de-sign flow rate from each sprinkler. This requires that the design pressure and nozzle size at each sprinkler be main-tained. Common problems are worn or plugged sprinkler nozzles, plugged or malfunctioning pressure regulators, and improper installation of the sprinkler package nozzle sizes on center pivots. Of these common problems, only a plugged sprinkler nozzle or regulator is easy to spot when the system is operating. The other common problems are not readily discernable by visual observation of the system in operation. Malfunctioning
pressure regulators are nearly impossible to visually identify, however, some emit water through the sides of the regulator when they fail structurally. A malfunc-tioning regulator will result in a sprin-kler pressure that will be too high. A sprinkler emitting a fine spray relative to adjacent sprinklers may indicate a malfunctioning pressure regulator. For situations where the sprinkler is readily accessible, flow rate measurements from 10 to 20 randomly selected sprinklers can be used to judge the condition of the sprinkler package. Flow rate mea-surements can be made using a large graduated container such as a 12 qt pail and a stopwatch. The container can be positioned to encompass the sprinkler and capture flow from the sprinkler for a specific time measured with the stop-watch. Sprinkler flow rate can then be calculated from these two measurements and compared to the nominal flow rate value for the nozzle size and pressure. Nominal sprinkler flow rates for com-mon center pivot sprinkler pressures and nozzle sizes are provided in Table 2. Dif-ferences greater than ±10 percent indi-cate a problem. A repeated measurement should be used to confirm flow rate measurements greater than ±10 percent of the nominal flow rate.
Example: 8.5 quarts caught in 36 seconds from a sprinkler with a #22 nozzle and 20 psi pressure regulator
Measured flow rate
8.5qts x ( 60 sec/min) _ 3.54 gpm 4qts/gal 36 sec
Nominal flow rate
From Table 1 3.78 gpm
Difference = 3 ' 54 - 3.78 x 100 = –5.1% < 10% okay 3.78
Pressure
psi #9 #10 #11
Nozzle Size
#12 #13 #14 #15 #16 #17
10 0.47 0.57 0.69 0.82 0.96 1.11 1.27 1.44 1.63
15 0.57 0.70 0.84 1.00 1.17 1.35 1.55 1.76 1.98
20 0.66 0.81 0.97 1.15 1.35 1.56 1.79 2.03 2.28
25 0.73 0.90 1.08 1.29 1.50 1.74 1.99 2.26 2.55
30 0.80 0.98 1.19 1.41 1.65 1.90 2.18 2.47 2.78
Pressure Nozzle Size
psi #18 #19 #20 #21 #22 #23 #24 #25 #26
10 1.82 2.02 2.23 2.46 2.69 2.94 3.19 3.46 3.74
15 2.22 2.47 2.73 3.00 3.29 3.58 3.90 4.22 4.56
20 2.55 2.84 3.14 3.45 3.78 4.13 4.49 4.86 5.25
25 2.85 3.17 3.50 3.85 4.22 4.60 5.01 5.42 5.86
30 3.11 3.46 3.83 4.21 4.61 5.03 5.47 5.93 6.40
Pressure Nozzle Size
psi #27 #28 #29 #30 #31 #32 #33 #34 #35
10 4.02 4.32 4.63 4.95 5.28 5.61 5.96 6.32 6.69
15 4.91 5.27 5.65 6.03 6.44 6.85 7.27 7.71 8.16
20 5.65 6.07 6.50 6.95 7.41 7.88 8.38 8.88 9.40
25 6.30 6.77 7.25 7.75 8.27 8.80 9.34 9.91 10.48
30 6.89 7.40 7.93 8.48 9.04 9.62 10.22 10.83 11.46
Pressure Nozzle Size
psi #36 #37 #38 #40 #42 #44 #46 #48 #50
Table 2.
Nominal sprinkler nozzle flow rates in gpm for center pivot and linear-move systems. Nozzle sizes are given in 128' inch increments e.g. #22 is 22/128 inches in diameter.
10 7.07 7.46 7.86 8.69 9.57 10.48 11.43 12.43 13.46
15 8.63 9.10 9.59 10.61 11.67 12.78 13.95 15.16 16.42
20 9.93 10.48 11.04 12.21 13.44 14.72 16.06 17.46 18.91
25 11.08 11.69 12.32 13.62 14.99 16.42 17.91 19.47 21.09
30 12.12 12.78 13.47 14.89 16.39 17.95 19.59 21.59 23.07
-When one or more sprinklers are found to have flow rates greater than ±10 percent of the nominal flow rate, a second set of 10 to 20 randomly se-lected sprinklers need to be tested. If more sprinklers are found to have flow rates greater than ±10 percent of the nominal flow rate, the cause needs to be identified and corrected. Measured flow rates below the nominal flow rate indicate that the actual pressure is be-low the assumed or pressure regulator rated pressure. This can be due to plug-ging or system operating pressure be-low the design pressure. Measured fbe-lows above the nominal flow rate indicate a malfunctioning pressure regulator. A good strategy against worn nozzles and malfunctioning pressure regulators is to replace the sprinkler package every five to seven years. This will ensure that the highest possible irrigation uniformity is maintained throughout the life of the irrigation system.
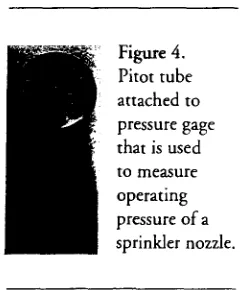
Pressure measurements are neces-sary to correctly diagnose measured flow rate anomalies and verify pressure regulator operation. A Pitot tube at-tached to a pressure gauge, Figure 4, is used to field check pressure regulator operation. Both are available from most irrigation equipment suppliers. The Pitot tube should be small to minimize flow interference. Pressure measurements are taken by placing the Pitot tube directly into the flow jet exiting the nozzle such that the open end of the tube is perpendicular to the flow jet. If the Pitot tube is inserted into the nozzle, the flow will be re-duced, but a properly functioning pres-sure regulator will readjust to main-tain the pressure within ±2 psi of the regulator pressure rating. Pressure mea-surements greater than 2 psi above the regulator pressure rating indicates a malfunctioning pressure regulator.
Pressure measurements more than 2 psi below the regulator pressure rating in-dicates plugging or low system oper-ating pressure.
The Pitot tube shown in Figure 4 may physically be too large to allow pressure measurements on some mod-els of center pivot sprinklers. A modi-fied version with a smaller diameter tube and longer length may need to be constructed to allow insertion into the water jet exiting the sprinkler nozzle. The only critical issue when constructing a Pitot tube is to make sure that the bend does not close off the tube leading to the pressure gauge.
Figure 4. Pitot tube attached to pressure gage that is used to measure operating pressure of a sprinkler nozzle.
The height of the sprinkler above the crop canopy can significantly af-fect irrigation uniformity. In general, sprinkler height should be approxi-mately 3 feet above the plant canopy to ensure good irrigation uniformity. Sprinkler heights greater than 6 feet above the plant canopy increase wind drift and evaporation losses. More de-tails on sprinkler type, height, and spacing are available in Bulletin 797, "Optimal Performance from Center Pivot Sprinkler Systems."
With center pivot and linear-move irrigation systems, uniform travel speed is important in attaining opti-mum irrigation uniformity for the
to-tal field area. Excessive slippage of the outer or end tower(s) through wet ar-eas and up steep slopes will tend to slow the speed of the system and in-crease application depths relative to other areas of the field. Booms can be used to offset sprinklers behind the lateral near the towers to reduce water application ahead of the tower wheels, thereby–reducing slippage potential and rutting. The continuous motion of hydraulic drive versus the start-stop motion of electric drive systems often leads to questions concerning the im-pact of continuous movement on irri-gation uniformity. There is no discernable difference in irrigation uni-formity at the individual plant scale between hydraulic and electric drive systems for the sprinkler packages used in Idaho where individual sprinkler patterns are typically 45 feet in diam-eter or greater and sprinkler overlap is typically a factor of two or greater.
With center-pivot and linear-move irrigation systems, the timing of suc-cessive irrigations at a given field loca-tion is critical in optimizing irrigaloca-tion uniformity for the total field area. Wa-ter loss due to evaporation and wind drift differs by 3 to 8 percent between day and nighttime hours. The diurnal difference in net water application must be spread over the total field area throughout the irrigation season in or-der to maintain high irrigation unifor-mity. The system needs to be operated such that successive irrigations at a given field location occur at different times during the day. This can be achieved with center pivot systems by setting the system rotation time to be something other than a multiple of 24 hours. Suitable rotation times are 18, 30, 36, 42, 54, 60 hrs and so on.
---Wheel line and hand line systems
Irrigation uniformity of set-move sprinkler systems such as wheel lines and hand lines is dependent upon sev-eral factors. These include sprinkler spacing, operating pressure and ori-entation, wind speed and direction, and pressure distribution in the sprin-kler lateral. A set-move system can achieve CU values of 80-90 percent with proper design and maintenance under moderate to low wind condi-tions, i.e. less than 10 mph. Values as low as 60 percent can occur with sys-tems on undulating topography, with worn or plugged nozzles, and/or un-der windy conditions.
As with center pivot and linear-move systems, the primary objective of system maintenance is to maintain the design flow rate and application pattern from each sprinkler along the lateral. Common problems are worn or plugged nozzles, pressures that are too high or too low, irregular rotation of the sprinkler head, a sprinkler axis of rotation that is not vertical, and sys-tem leaks. If high irrigation unifor-mity is to be achieved, each of these items needs to be monitored and cor-rected if necessary.
Set-move sprinkler systems require a daily commitment to detail to achieve optimum irrigation unifor-mity throughout the season. Sym-metrical application of water around the sprinkler is necessary for optimum uniformity. This means that the sprin-kler riser must be set vertical. For wheel line systems the self-levelers must be maintained to provide free movement for proper functioning. System leaks resulting from damaged gaskets or malfunctioning automatic drains need to be repaired regularly.
Replacement of gaskets and seals ev-ery five years is a good practice. The bearings on the standard impact sprin-kler need to be checked yearly to en-sure that rotation of the sprinkler is free and smooth for uniform rotation speed. Any of the above items can sig-nificantly reduce irrigation uniformity if not corrected.
Sprinkler operating pressure has a significant impact on irrigation unifor-mity. The optimum operating pressure for an impact sprinkler with a standard straight bore nozzle is 45 to 60 psi. The water jet leaving the nozzle will not break up sufficiently at low pressures (<40 psi) resulting in concentrated wa-ter application where the jet lands. The water jet leaving the nozzle will have excessive breakup at high pressures (>70 psi) resulting in concentrated water application near the sprinkler. Sprinkler operating pressure can be readily checked with a Pitot tube at-tached to a pressure gauge, Figure 4. Pressure variation along a lateral should be less than 20 percent to achieve ac-ceptable irrigation uniformity. Exces-sive pressure variation can be a prob-lem on undulating or sloping topog-raphy. Pressure compensating nozzles or pressure regulators can be used in these situations to limit the pressure variation along the lateral.
The water jet from a standard straight bore nozzle should exit as a solid stream. A diffuse stream indi-cates a problem. A diffuse stream can result from foreign material lodged in the nozzle, mineral deposits or corro-sion, and worn nozzles. Visual inspec-tion of the nozzle will reveal mineral deposits or corrosion. However, wear is not readily discernable by visual in-spection. Nozzle wear can be tested
using a new drill bit of the same size as the nozzle diameter. The shank of the drill bit is inserted into the nozzle while operating, and the distance wa-ter sprays out is a good measure of nozzle wear. If the nozzle is new or has no wear, inserting the drill bit shank into the nozzle will yield a nearly watertight fit with just a few drops exiting. If the wear is slight, a fine spray extending less than 10 feet will exit. If the nozzle is moderately worn, a large spray extending 10 to 15 feet will exit. When a nozzle is ex-tremely worn, a coarse spray extend-ing greater than 15 feet will exit. Un-der the latter two situations, sprinkler discharge is 7 to 20 percent greater than the design discharge.
When pressure—compensating or controlled-droplet type nozzles are used, the procedures for evaluating sprinkler flow rates with center pivot irrigation systems can be used. A large
diameter hose can be used to direct wa-ter from the nozzle into the graduated containers. The measured flow rates can be compared to the manufacture's published values to judge condition of the sprinkler system.
3 4 5 6 7 8 9 10 11 12
Windspeed (miles per hour)
0
Figure 7.
General increase in cumulative irrigation uniformity with successive irrigations for set-move systems. Adapted from Kincaid (1984).
Sprinkler Spacing, ft –It– 40 x 40 --a– 40 x 50
–a-- 40 x 60
100
so-0
c BO
0
70-2
Number of irrigations 3
Figure 5. General decrease in irrigation uniformity with increasing wind speed for lateral spacings of 40, 50 and 60 feet. Adapted from Kincaid (1984).
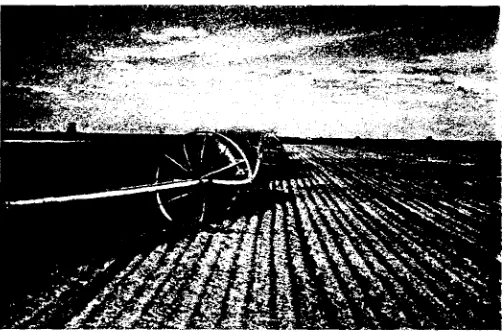
Figure 6. Wind greatly affects the water application pattern from set-move sprinkler system. Here the dark colored soil is wetted and the light colored soil is dry. Wind direction is from right to left. Wind speed in conjunction with
sprinkler spacing has a large impact on irrigation uniformity with set-move sprinkler systems. In general, irrigation uniformity at any sprinkler spacing will decrease as wind speed increases above approximately 5 mph as indicated in Fig-ure 5. Set-move sprinkler systems are especially susceptible to "wind skips". Wind skips occur when there is a large difference in wind speed and/or direc-tion between adjacent irrigadirec-tion sets. This problem is depicted in Figure 6. For the irrigation event shown in Figure 6, a temporary dry zone will likely develop adjacent to the sprinkler lateral on the upwind side because the following adja-cent irrigation set will probably not oc-cur under the same wind speed and di-rection. Under extreme wind conditions, as that depicted in Figure 6, wind skips will occur with any reasonable sprinkler spacing, however, reducing the sprinkler spacing will reduce the extent of the wind skip. Fortunately, wind skips are usually not cumulative and cumulative irrigation uniformity increases with successive ir-rigations as shown in Figure 7.
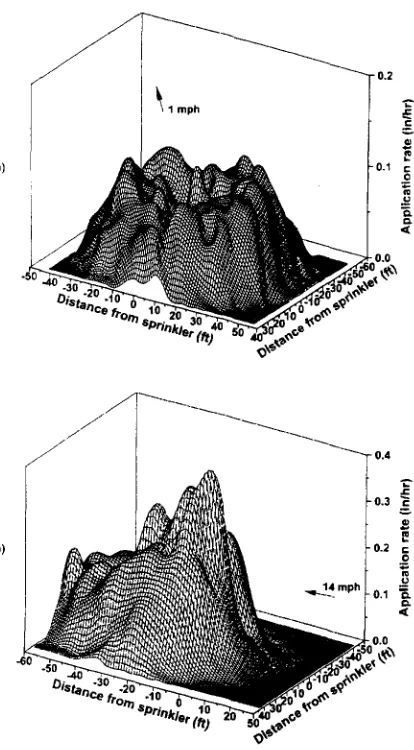
Application rate patterns from a single impact sprinkler equipped with a 9/64 inch straight bore nozzle in a 1 mph wind and a 3/16 inch nozzle in a 14 mph wind are shown in Figure 8. The effect of wind is to elongate the application pattern in the down wind direction and to cause water applica-tion to be concentrated near the sprin-kler. The simulated effect of wind on the combined application rate pattern from nine sprinklers having a 40 by 60 ft spacing with a 14 mph wind oriented perpendicular to the lateral is shown in
Figure 9. The average application rate is 0.28 in/hr, but with a range of 0.07 to 0.48 in/hr resulting' in a CU of 66 percent. A 14 mph wind is a common daytime occurrence during spring and early summer in southern Idaho.
In practice, wind speed and direc-tion vary throughout an irrigadirec-tion event. This tends to average out appli-cation rate variations and increases the CU for an actual irrigation event com-pared to that depicted in the simula-tion of Figure 9. However, when chemi-cals are applied through the irrigation
a)
0.4
0.3 c
O
0.1 a
0.0
0 1
0
5
-azi
00w 10 ... 6 ` 0 e'
504001, 041
Figure 8. Affect of wind on application rate pattern of impact sprinkler equipped with straight bore nozzle; a) 9/64 inch nozzle and b) 3/16 inch nozzle.
b) 0.2
0.9 0.8 0.7 0.6 0.5
0.4
system over a short time period, the ap-plication pattern shown in Figure 9 is representative of actual conditions. For windy conditions such as those shown in Figure 9, reducing the distance be-tween laterals may have little effect on irrigation uniformity.
Changes in wind speed and direction tend to increase the cumulative irriga-tion uniformity calculated over multiple irrigations. A management strategy that can further increase seasonal irrigation uniformity is the practice of offsetting the placement of sprinkler laterals over successive irrigations. This management
practice increases irrigation unformity by averaging out spatial differences in water application. This management practice effectively reduces the lateral spacing averaged over multiple irriga-tions by one-half to one-third.
The effect of offsets on improving the application pattern for the conditions of Figure 9 is shown in Figure 10. The simulated combined application pattern shown in Figure 10 was for a two-hour duration with one hour in each lateral location. The average depth of applica-tion is 0.56 inches with a range of 0.29 to 0.82 inches resulting in a CU of 76
percent. The CU increased by 10 per-cent which will likely have a positive impact on crop yield and quality. While offsets are an effective way to increase seasonal irrigation uniformity, wind skips will remain a problem with indi-vidual irrigations for shallow-rooted, water-sensitive crops such as potatoes. Offsets of one -half the lateral spacing are usually only possible with hand line systems. For wheel line systems, the off-set spacing must be a complete roll of the lateral when moved. This limitation commonly results in offsets of one-third and two-third the lateral spacing.
0.6
0.5
0.4
fa
..
0.3 is0.2 g
0.1 1
0.0
Figure 9. Combined application pattern from nine sprinklers with a 40 ft sprinkler spacing and 60 ft lateral spacing in a 14 mph wind oriented perpendicular to the laterals.
Figure 10. Combined application pattern over two irrigation events when using 30 ft lateral offsets with a 40 ft sprinkler spacing and 60 ft lateral spacing in a 14 mph wind oriented perpendicular to the laterals.
Microirrigation systems
Microirrigation systems employ low-pressure emission devices for the fre-quent, slow application of water either directly onto the land surface or into the root zone of the crop. Microirrigation encompasses both surface and subsur-face drip, micro-sprinkler, and bubbler irrigation systems. In all cases, water is precisely metered to a specific location allowing high irrigation uniformity. Ir-rigation uniformity of a microirIr-rigation system is usually based on measurement of emitter discharge. A microirrigation system on uniform topography should be designed for a minimum CU of 85 percent for annual row crops and 90 per-cent for permanent crops.
The primary objective in the main-tenance of a microirrigation system is to maintain the design flow rate from each emission device in the system. This requires that the design pressures are maintained throughout the system and that plugging of emission devices does not occur. Maintaining the design pres-sures throughout the system involves monitoring operating pressure at key lo-cations and regular maintenance of pres-sure regulating devices to enpres-sure their proper operation.
Physical, chemical, and biological agents can cause plugging of emission devices. Every microirrigation system should be designed with filtration equip-ment to remove contaminants over 100 micron (0.1 mm or 1/250 of an inch) in size. However, development of chemi-cal and biologichemi-cal agents within the sys-tem must be monitored and periodically treated. Chlorine and acid injection are the most common treatments for bio-logical and chemical agents. Physical agents smaller than 100 micron which enter the system through the water source can coalesce and settle at the end of supply lines and/or cause plugging.
All supply lines must be periodically flushed to prevent this from occurring. Lastly, daily monitoring and mainte-nance of the primary and secondary fil-tration equipment is required. Overall, the degree of management and routine maintenance required to keep a microirrigation system in top condition is greater than for any other type of irri-gation application system.
An indication of system condition can be obtained by occasional measure-ment of emitter discharge and compar-ing it to the rated discharge of the emit-ter. A graduated container such as a household measuring container and stop watch can be used to measure emitter flow rate. Thirty to forty emitters should be measured at random field locations. The mean and range in measured flow rate can be used to judge system condi-tion. The measured mean flow rate should be nearly equal to the manufacture's rated design flow rate. No more than 20 percent of the measured flow rates should be greater than ±10 percent of the mean in order to have an irrigation uniformity of 85 percent. The CU value can also be computed directly using the measured emitter flow rates
Surface irrigation systems
Irrigation uniformities as high as 95 percent can be achieved with surface ir-rigation systems under extremely ideal conditions and management. In contrast to microirrigation and sprinkler irriga-tion systems where water distribuirriga-tion is primarily dependent upon the physical attributes of the system hardware, wa-ter distribution in surface irrigation sys-tems is highly dependent upon water in-filtration rate into the soil. Inin-filtration rate is largely unmanageable and varies both in time and in space. Water appli-cation to individual plants can vary from one-half to twice the field average due
to spatial variability in infiltration rate, resulting in irrigation uniformities be-low 50 percent. Changes in slope along the furrow length adversely impact irri-gation uniformity.
Besides infiltration rate, other factors that affect irrigation uniformity are flow rate, furrow roughness, compaction, length, and slope. Flow rate and furrow length are the factors that can be ad-justed to improve irrigation uniformity. With surface irrigation, water is required to traverse the field by overland flow. The time required for water to reach the end of the field leads to a greater infil-tration opportunity time at the inflow compared to the out flow end, resulting in differences in infiltration. To achieve maximum uniformity, the differences in infiltration opportunity time must be minimized. This can be accomplished by increasing inflow rate, furrow or cor-rugate smoothing and/or compaction, and shortening furrow length.
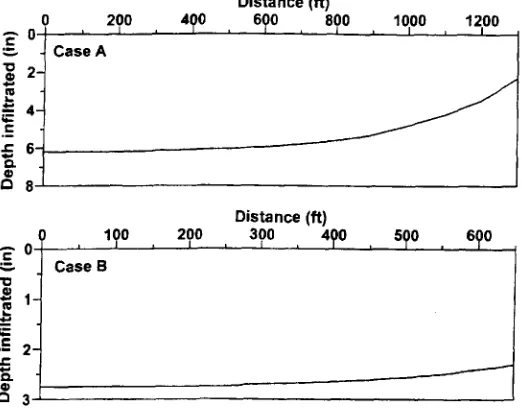
The effect of shortening furrow length on irrigation uniformity is depicted in Figure 11. The situation shown in Fig-ure 11 is for uniform soil conditions with infiltration characteristics representative of a Portneuf silt loam soil. Case A is for a field length of 1300 ft with 1 percent uniform slope and desired irrigation depth of 2.3 inches. An irrigation time of 36 hours is required to advance the water to the end of the field and infil-trate the desired depth at the end of the field when the furrow flow rate is 3.8 gpm. The resulting irrigation uniformity is 85 percent. Case B is for the same field conditions except that the field length is reduced by one-half to 650 ft. An irriga-tion time of 12 hours is now required to advance the water to the end of the field and infiltrate the desired depth at the end of the field when the furrow flow rate is 3.5 gpm. The resulting irrigation uni-formity is 96 percent. Irrigation
-Distance (ft)
200 4'0 6'0 800 1000 1200
Distance (ft)
100 200 300 4 0 5'0 6'0
Figure 11. Effect of reducing field length on irrigation uniformity for a furrow irrigation system. Case A - 3.8 gpm for 36 hours and
Case B - 3.5 gpm for 12 hours.
mity is increased by 11 percent while water use is decreased by 50 percent. However, labor costs are doubled and runoff is increased 7 fold. The increase in irrigation uniformity results in a large decrease in deep percolation which is the reason for 50 percent less water use. The environmental impact of the increased runoff could be effectively handled by employing a tailwater reuse system or effectively reduced by employing cut-back, cablegation, or surge irrigation.
Due to the nature of surface irrigation, direct comparison of Christiansen uni-formity coefficient values with other types of irrigation systems is not meaningful. An additional uniformity measure termed the Low-Quarter Distribution Unifor-mity (DU) is often used to quantify irri-gation uniformity of surface irriirri-gation systems. The low-quarter distribution uniformity is the ratio of the average of the lowest one-fourth of the infiltrated depths to the mean infiltrated depth, ex-pressed as a percentage. For the situation shown in Figure 11, the DU for Case A is 72 percent and for Case B is 92 per-cent. For surface irrigation systems, DU provides a better measure of the
nonuniformity occurring near the end of the field. Surface irrigation systems can be managed to provide good irrigation uniformity. However, the amount of la-bor required to accomplish this is often far greater for surface irrigation systems than other irrigation system types.
CONCLUSIONS
Irrigation uniformity is an important consideration when striving to increase production efficiency in irrigated agri-culture. Irrigation uniformity often re-ceives little attention compared to irri-gation scheduling, yet it is just as im-portant. Problems arising from poor ir-rigation scheduling are often much more noticeable because they occur on a larger scale over a short period of time. Problems arising from poor irrigation uniformity occur at diverse locations in the field and often gradually appear over the growing season. Any type of irriga-tion system can be designed to provide good irrigation uniformity, but it is management's responsibility to sustain the irrigation uniformity over the life of the irrigation system through proper maintenance.
REFERENCES
Kincaid, D.C. 1984. Minimizing energy requirements for sprinkler laterals. ASAE Paper No. 84-2585. American Society of Agricultural Engineers, St. Joseph, MI.
ADDITIONAL SOURCES
OF INFORMATION
ASAE. 1999. Test procedure for deter-mining the uniformity of water distri-bution of center Pivot and lateral move irrigation machines equipped with spray or sprinkler nozzles. ANSI/ASAE
5436.1. American Society of Agricul-tural Engineers, St. Joseph, MI.
Ashley, R.O., W.H. Neibling, and B.A. King. 1996. Irrigation scheduling using water-use tables. CIS 1039. University of Idaho, College of Agriculture.
King, B.A. and D.C. Kincaid. 1997. Optimal performance from center pivot sprinkler systems. Bulletin 797. Univer-sity of Idaho, College of Agriculture.
ABOUT THE AUTHORS
Bradley A. King is an irrigation research engineer in the Biological and Agricul-tural Engineering Department at the University of Idaho Aberdeen Research and Extension Center. Jeffrey C. Stark is chair of UI's Division of Plant Sci-ence and professor of crop management at the UI Aberdeen Research and Ex-tension Center. Dennis C. Kincaid is an agricultural engineer for the USDA Ag-ricultural Research Service at the North-west Irrigation and Soils Research Labo-ratory in Kimberly, Idaho.