R E S E A R C H
Open Access
Impact of land use/land cover changes on
ecosystem services in the Nenjiang River
Basin, Northeast China
Zhiliang Wang
1,2,3*, Zongming Wang
1, Bai Zhang
1, Chunyan Lu
1,2and Chunying Ren
1Abstract
Introduction:The Nenjiang River Basin is an important foodstuff base and eco-environmental fragile area in Northeast China. With the rapid rise in human population, human-induced changes in land use/land cover form an important component of regional environment and ecosystem service change. At the local and regional level, the ecosystem service concept can act as a decision support tool for a stakeholder to reach sustainable land use management. However, the prevailing ecosystem service evaluation would produce a biggish warp when it is applied to concrete area. So, it is essential to evaluate ecosystem service change according to the local actuality.
Method:According to 1:250,000 land use/land cover maps of China and the adjusted equivalent value per unit area of ecosystem services in the Nenjiang River Basin, we evaluated the ecosystem service change of the river basin from 1980 to 2005.
Results:The forest and wetland, which are mainly located in the upstream mountainous area of the Nenjiang River Basin, were the two valuable land cover types, accounting for more than three quarters of the total ecosystem service value of the river basin. As for individual ecosystem service, besides the food production, all of the ecosystem service values declined from 1980 to 2005. The total decline of 2.43 billion USD was mainly due to the cultivation of grassland (14.34 % of the area in 1980) and wetland (4.62 % of the area in 1980) in the downstream plain.
Conclusions:Due to the increase in population and the concomitant requirement of grain, the inconsistency between decision-making at the macro-level, and the objective of agricultural production at the micro-level, cultivated land was increased through zealous reclamation of grassland, marginal woodland, and even fallow land. Tremendous land use/land cover changes had caused great damages to the ecological environment such as land degradation and ecosystem service recession. So, the policies of the Grain for Green and Construction of Ecological Province projects should be well-implemented to optimize land use/land cover.
Keywords:Land use/land cover changes; Ecosystem services; Equivalent value; NDVI; Nenjiang River Basin
Introduction
The Nenjiang River, previously be called the Nonni River at the beginning of the Qing Dynasty, means“The Green River” in Mongolian. The river basin used to be the haven of water birds for the wild spreading wetland which was bred by tens of rivers from the Da and Xiao Xing’anling Ranges. But after a hundred years of cultiva-tion, there emerged thousands of large-scale farms
accommodating 15.9 × 10⁶population (Dong, 2013). Es-pecially after the reform era of the late 1970s, the old collective production brigade farming system was aban-doned in favor of the household responsibility system to unleash farmers’ incentives for higher productivity and more income (Liu et al. 2004). Large-scale state farms had been established as an important “grain base” through zealous reclamation of grassland, marginal woodland, and wetland. With the rapid rise in human population, human-induced changes in land use/land cover form an important component of regional envir-onment and ecosystem service change. Whereas, at the * Correspondence:jodver@163.com
1Northeast institute of Geography and Agroecology, Chinese Academy of
Sciences, Changchun 130102, China
2University of Chinese Academy of Sciences, Beijing 100101, China
Full list of author information is available at the end of the article
local and regional level, the ecosystem service concept can act as a decision support tool for a stakeholder to reach sustainable land use management (Anna and Sabine 2011). The ecosystem service value assessment should be carried out as soon as possible. In China, the ecosystem service values of large-scale basins all have been evaluated (Liu et al. 2006; Wu et al. 2009; Hou et al. 2013; Bai et al. 2011; Liu et al. 2014). So, it is
necessary to evaluate the ecosystem service change of the Nenjiang River Basin to constitute accurate policy for sustaining development. In this study, on the basis of land use/land cover changes and the achievements of other researchers from 1980 to 2005, the ecosystem ser-vice value of the Nenjiang River Basin was evaluated through the equivalent value per unit area of Chinese terrestrial ecosystem and the normalized difference
vegetation index (NDVI). Especially, we hope to achieve three objectives: (1) to reveal the dynamics of land use/ land cover changes in the Nenjiang River Basin and its driving forces, (2) to evaluate the ecosystem service change of the river basin from 1980 to 2005, and (3) to map the ecosystem services of the Nenjiang River Basin.
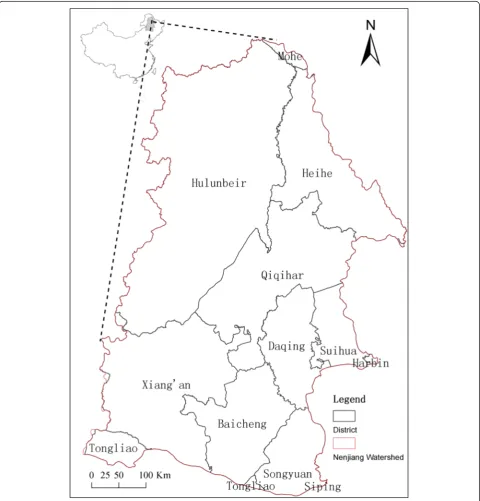
Methods Study area
The Nenjiang River Basin is located in the midwest of Heilongjiang Province, Northeast China. The Nenjiang River, which originates from the Yilehuli mountain of the Da Xing’anling Ranges, is the northern source of the Songhua River (Sun and Bai 2005). The length of the river is 1370 km with a catchment area of 29.4 × 10⁴ km2, accounting for 53.8 % of the total Songhua River Basin (total area is 54.6 × 10⁴km2).
The basin (Fig. 1) lies on the northern margin of the East Asian monsoon region and has a cold and semi-humid continental monsoon climate with long, cold winters and short, rainy summers. The average annual temperature ranges from −4 to 6 °C. Rivers are frozen from late October to early November and melt in early April (Li et al. 2014). However, spatial and temporal dif-ferences in rainfall and temperature vary greatly throughout the basin for its unique geographical pos-ition, shape, and terrain features.
Data
The basic data used in this study include (1) 1:250,000 land use/land cover maps of China in 1980 and 2005, which were obtained from data sharing infrastructure of Earth System Science (http://www.geodata.cn/). There are 6 level I categories and 25 level II categories of land use/land cover types. In our study, in order to calculate
ecosystem service value for each land cover type identi-fied in Xie et al.’s (2003) ecosystem service valuation model, six level I categories were reclassified as forest, grassland, farmland, wetland, lakes/rivers, and barren land. Wetland and water body was divided into two cat-egories, and residential land and desert were united as barren land; (2) equivalent value per unit area of ecosys-tem services for terrestrial ecosysecosys-tem in China (Xie et al.
2003); (3) 1-km2 resolution of NOAA/AVHRR NDVI
index around China in 1998, which was obtained from the Thematic Database for Human-Earth System (http:// www.data.ac.cn).
Revising the equivalent value per unit area of Chinese terrestrial ecosystem
For evaluating the global ecosystem value, Costanza et al. (1997) defined the theory and methodology of eco-system service evaluation clearly from scientific purport. However, it was controversial in China, with some eco-system services poorly valued or ignored (Zhang et al. 2013). When it was applied to concrete area, the methods would produce biggish warp due to (1) the value of ecosystem services reflected the economic level of developed countries such as the United States and European countries, rather than developing countries such as China; (2) although wetland ecosystems provide significant functions, their value per unit area was over-valued (Zhang et al. 2013). So, to adjust Costanza et al.’s (1997) value coefficients, Xie et al. (2003) constituted the equivalent value per unit area of ecosystem services for Chinese terrestrial ecosystem based on questionnaire investigation from about 200 ecological scholars and some achievements (Table 1).
The equivalent value per unit area of ecosystem ser-vices is the latent ability of the ecosystem serser-vices
Table 1Equivalent value per unit area of ecosystem services for terrestrial ecosystem in China
Item Forest Grassland Farmland Wetland Lakes/rivers Barren
Gas regulation 3.50 0.80 0.50 1.80 0 0
Climate stabilitya 2.70 0.90 0.89 17.10 0.46 0
Water regulation and supply 3.20 0.80 0.60 15.50 20.38 0.03
Soil generation and fertilityb 3.90 1.95 1.46 1.71 0.01 0.02
Waste treatment 1.31 1.31 1.64 18.18 18.18 0.01
Biodiversity protectionc 3.26 1.09 0.71 2.50 2.49 0.34
Food production 0.10 0.30 1.00 0.30 0.10 0.01
Raw materials 2.60 0.05 0.10 0.07 0.01 0
Recreation, cultural 1.28 0.04 0.01 5.55 4.34 0.01
Sum 21.85 7.24 6.91 62.71 45.97 0.42
a
Climate stability includes climate regulation and disturbance regulation
b
Soil generation and fertility includes soil formation, nutrient cycling, erosion control, and sediment retention
c
produced by unit area of ecosystem. One equivalent value was defined as the economic value produced by 1-ha farmland in China. Thus, Table 1 could be trans-formed into a table of economic value of ecosystem ser-vices for the same year. However, it just provides an average equivalent value per unit area of ecosystem ser-vices in China. Proverbially, there exist affinities between ecosystem service value and biomass. The bigger the
biomass, the higher the ecosystem service value it has. In addition, NDVI could be used as an indicator of rela-tive biomass and greenness (Boone and Galvin 2000; Freitas and Mello 2005; Loris and Damiano 2006; Zhang et al. 2007). Various authors have related this index to vegetation structures, such as vegetation cover, biomass, and leaf area index, as well as some functional character-istics, such as primary production and carbon balance
(Running et al. 1999; Stoms and Hargrove, 2000; Huete et al. 2002; Kerr and Ostrovsky, 2003), some of which are important features in ecosystem service analysis (Roces-Díaz et al. 2014). So, we could assume a linear relationship between ecosystem service value and NDVI, then, revise the equivalent value per unit area of ecosys-tem services in the Nenjiang River Basin as follows:
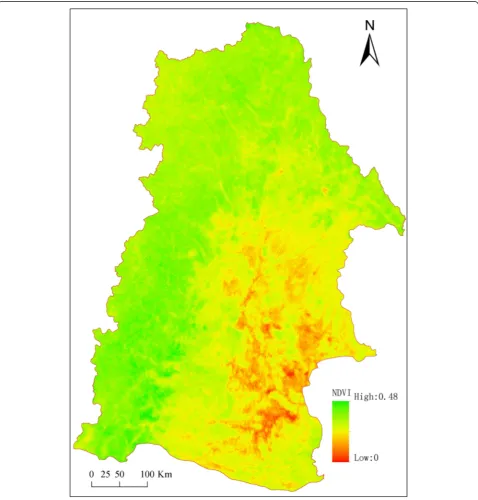
Eij¼NDVIm
NDVIneij ð1Þ
Where Eij is the equivalent value per unit area of i ecosystem service for j ecosystem type after revisal; NDVIm is the average NDVI value of the Nenjiang River Basin (Fig. 2, Table 2), and NDVInis the average NDVI value of China (Zhang et al. 2007); eij the equivalent value before revisal;i= 1, 2, 3,⋯9, separately denote the ecosystem services; andj= 1, 2, 3,⋯6, separately denote the land use types.
Evaluating the ecosystem service value
Through contrast analysis by Xie et al. (2003), one equivalent value per unit area equals one seventh of the average foodstuff market value in China. We could
calculate the ecosystem service value of one equivalent value per unit area of ecosystem as follows:
C¼1=7X n
i¼1
V
M ð2Þ
Where C is the economic value of one equivalent
value per unit area of ecosystem services,V is the eco-nomic value of its crop produced by every farm, M the area of its crop, andnthe categories of crop.
For lack of data, we took Hu et al.’s (2006) research as reference, of which the Chinese average economic value per unit area of farmland in 2005 was 3629.43 yuan · ha−1; subtracting the unit area investment (930.33 yuan · ha−1, including labors, fertilizer, mechanics, and others) and the rent shadow price (2250 yuan · ha−1), one equivalent value per unit area of ecosystems in China equaled to 449.10 yuan · ha−1(58.5 USD · ha−1) (Xie et al. 2008). Pre-suming a linear relationship between ecosystem service value and biomass, the biomass factor of China was 1, while the biomass factor of Heilongjiang province was 0.66 (Xie et al. 2005). So, we could set one equivalent value per unit area in the Nenjiang River Basin to 296.41 yuan · ha−1(38.61 USD · ha−1) in 2005.
By all accounts, we could calculate the total economic value in the Nenjiang River Basin by the following equation:
ESV¼X
9
i¼1
X6
j¼1
AjEijC ð3Þ
Where ESV is the total value of ecosystem services, and Aj is the area of j ecosystem type in the Nenjiang River Basin.
Ecosystem service sensitivity analysis
Because there are uncertainties about the equivalent value per unit area of each ecosystem service for each ecosystem as well as the veracity of Costanza et al.’s (1997) value coefficients, we conducted sensitivity ana-lysis to examine the dependence of our ecosystem ser-vice value estimation on the applied equivalent value Table 2The average NDVI of China and the Nenjiang River
Basin
Month China Nenjiang River Basin
Jan. 0.014 0.031
Feb. 0.015 0.031
March 0.017 0.081
April 0.022 0.066
May 0.039 0.233
Jun. 0.052 0.205
Jul. 0.059 0.343
Aug. 0.059 0.310
Sep. 0.054 0.316
Oct. 0.032 0.205
Nov. 0.023 0.029
Dec. 0.016 0.019
Table 3Total area and area change of land use/cover from 1980 to 2005 (104km2)
Land use 1980 Percent Rank 2005 Percent Rank Change Percent Rank Trend
Forest 10.20 34.66 1 9.87 33.54 2 −0.33 −3.24 5 ↓
Farmland 9.09 30.88 2 10.11 34.39 1 1.02 13.46 1 ↑
Grassland 4.78 16.24 3 4.13 14.06 3 −0.65 −11.32 2 ↓
Wetland 3.39 11.51 4 3.28 11.17 4 −0.11 −3.11 6 ↓
Barren land 1.47 4.98 5 1.56 5.32 5 0.09 9.52 3 ↑
Lakes/rivers 0.51 1.73 6 0.46 1.52 6 −0.05 −6.72 4 ↓
per unit area of ecosystem services. The equivalent value for each ecosystem was adjusted by 50 % (Wang et al. 2006). The coefficient of sensitivity (CS) was cal-culated as:
CS¼ ðESVj−ESViÞ=ESVi
Ej−Ei
ð Þ=Ei
ð4Þ
Where ESV is the estimated value of ecosystem ser-vices, E the equivalent value per unit area of ecosystem services, and i and j represent the initial and revisal value, respectively. CS > 1 indicates that ecosystem ser-vice value estimation is elastic to the equivalent value, while CS < 1 means inelastic to the equivalent value and accuracy of the equivalent value.
Results
Land use/land cover changes
As shown in Table 3, the two largest land use types were forest (10.20 × 10⁴ km2, about 34.66 % of total area in 1980; 9.87 × 10⁴ km2, about 33.54 % in 2005) and farmland (9.09 × 10⁴ km2, about 30.88 % of total area in 1980; 10.11 × 10⁴ km2, about 34.39 % in 2005) in this region.
From 1980 to 2005, the most notable changes of land use/land cover were an increment in farmland and a de-cline in grassland. In 1980, grassland covered 4.78 × 10⁴ km2, about 16.24 % of the total area; it decreased 11.32 %, about 6430 km2, which is about 257 km2 per year by 2005. The area of lakes/rivers, forest, and wetland all decreased from 1980 to 2005. Meanwhile, farmland in-creased 13.46 %, about 1.02 × 10⁴ km2, which is about 411 km2 per year. Barren land also increased 985 km2, which is about 39 km2per year.
Results of the transition matrix in Table 4 indicated the area increment or decline of each land use type. It was clear that between 1980 and 2005, the transition replacement rates of grassland and lakes/rivers were higher at 19.05 and 12.57 %, respectively. About 14.34 % of grassland and 4.62 % of wetland in 1980 were transformed to farmland; 7.72 % of lakes/rivers was changed to wetland, because of 5 years of continu-ing drought after the big flood of the Nenjiang River in 1998 (Dong, 2013).
Changes in ecosystem services
According to Table 1 and Eq. (1), we calculated the equivalent value per unit area of ecosystem services in Table 4Transition matrix of land use types from 1980 to 2005 (transition probabilities in %)
Land use type in 1980
Land use type in 2005
Grassland Farmland Barren Forest Wetland Lakes/rivers Sum
Grassland 80.96 14.34 1.41 2.00 1.20 0.10 19.05
Farmland 0.26 98.80 0.12 0.59 0.19 0.04 1.20
Barren land 0.04 0.15 99.72 0.02 0.02 0.05 0.28
Forest 1.93 2.75 0.01 95.26 0.04 0.01 4.74
Wetland 1.06 4.62 0.69 0.08 93.39 0.16 6.61
Lakes/rivers 2.24 2.52 0.06 0.03 7.72 87.43 12.57
Table 5Equivalent value per unit area of ecosystem services in the Nenjiang River Basin
Item Forest Grassland Farmland Marsh Water Barren
Gas regulation 16.28 3.72 2.33 8.37 0.00 0.00
Climate stability 12.56 4.19 4.14 79.52 2.14 0.00
Water regulation and supply 14.88 3.72 2.79 72.08 94.77 0.14
Soil generation and fertility 18.14 9.07 6.79 7.95 0.05 0.09
Waste treatment 6.09 6.09 7.63 84.54 84.54 0.05
Biodiversity protection 15.16 5.07 3.30 11.63 11.58 1.58
Food production 0.47 1.40 4.65 1.40 0.47 0.05
Raw materials 12.09 0.23 0.47 0.33 0.05 0.00
Recreation, cultural 5.95 0.19 0.05 25.81 20.18 0.05
the Nenjiang River Basin, and the results were listed in Table 5.
Based on Eq. (3), we calculated the changes of ecosys-tem service value in 1980 and 2005 (Table 6). From Table 6, the two valuable land use types were forest (40.00 billion USD, about 40.03 % of the total value in 1980; 38.71 billion USD, about 39.70% of the total value in 2005) and wetland (38.14 billion USD, about 38.16 % of the total value in 1980; 37.90 billion USD, about 37.90 % of the total value in 2005) in this region, ac-counting for more than three quarters of the total basin ecosystem service value.
Although the area of farmland ranked the second and wetland ranked the fourth in Table 3, the total ecosys-tem value of farmland ranked below wetland’s, obviously, because of its lower equivalent value per unit area. Dur-ing the past 25 years, the total economic value of grass-land decreased the most, about 13.46 % of the total value in 1980, as well as lakes/rivers, forest, and wetland. Meanwhile, the total economic value of farmland and barren land increased 11.30 and 5.88 %, respectively, be-cause of their increasing total area.
On the whole, the land use/land cover changes in the Nenjiang River Basin had led to a total net decline of 2.43 billion USD, about 97.2 million USD per year in ecosystem service value from 1980 to 2005.
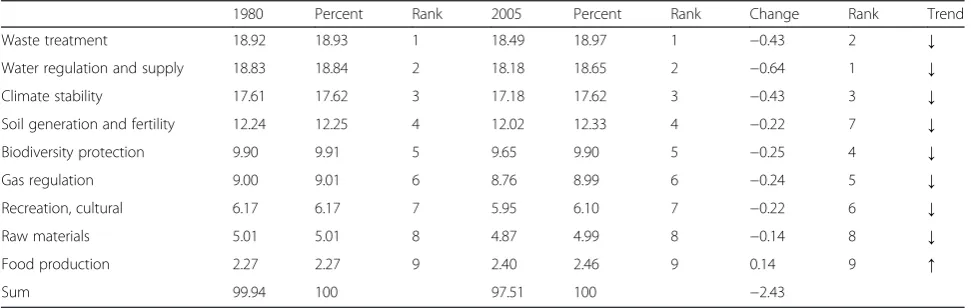
We also calculated the effects of land use/land cover changes to individual ecosystem services during the past 25 years (Table 7). Except for the economic value of food production, all kinds of ecosystem service values declined from 1980 to 2005. The most notable value decline was water regulation and supply service, about 0.64 billion USD; the next were waste treatment service and climate stability, because the warming and drying trend of the basin has influenced seasonal streamflow and altered the annual hydrograph of the basin; the decrease of streamflow in the lower basin (mainly alluvial plains) has caused wetland degradation, desertification, and soil salinization (Zhang and Guo 2008; Du et al. 2009).
Ecosystem service sensitivity analysis
When the equivalent value for each ecosystem was ad-justed by 50 %, respectively, changes of total values in the Nenjiang River Basin and coefficient of sensitivity (CS) for each land use type were calculated (Table 8).
As shown in Table 8, the 50 % adjustment to equiva-lent value of forest had the most impact on the total es-timated ecosystem service value, the total value changed ±20.00 billion USD · a−1and ±19.07 billion USD · a−1 on the initial result of 1980 and 2005 respectively, Table 6Total economic value of each ecosystem from 1980 to 2005 (billon USD)
1980 Percent Rank 2005 Percent Rank Change Percent Rank Trend
Forest 40.00 40.03 1 38.71 39.70 1 −1.29 −3.24 5 ↓
Wetland 38.14 38.16 2 36.95 37.90 2 −1.18 −3.11 6 ↓
Farmland 11.27 11.28 3 12.55 12.87 3 1.28 11.32 2 ↑
Grassland 6.21 6.21 4 5.37 5.51 4 −0.84 −13.46 1 ↓
Lakes/rivers 4.21 4.21 5 3.81 3.91 5 −0.40 −9.52 3 ↓
Barren land 0.11 0.11 6 0.12 0.12 6 0.01 6.72 4 ↑
Sum 99.94 100.00 97.51 100.00 −2.43 −2.43
Table 7Total economic value of each ecosystem service from 1980 to 2005 (billion USD)
1980 Percent Rank 2005 Percent Rank Change Rank Trend
Waste treatment 18.92 18.93 1 18.49 18.97 1 −0.43 2 ↓
Water regulation and supply 18.83 18.84 2 18.18 18.65 2 −0.64 1 ↓
Climate stability 17.61 17.62 3 17.18 17.62 3 −0.43 3 ↓
Soil generation and fertility 12.24 12.25 4 12.02 12.33 4 −0.22 7 ↓
Biodiversity protection 9.90 9.91 5 9.65 9.90 5 −0.25 4 ↓
Gas regulation 9.00 9.01 6 8.76 8.99 6 −0.24 5 ↓
Recreation, cultural 6.17 6.17 7 5.95 6.10 7 −0.22 6 ↓
Raw materials 5.01 5.01 8 4.87 4.99 8 −0.14 8 ↓
Food production 2.27 2.27 9 2.40 2.46 9 0.14 9 ↑
while the CS fluctuated between 0.4003 and 0.3970, cor-respondingly; the next was wetland. Adjustment to farm-land, grassfarm-land, lakes/rivers, and barren land had little impact and the CS ranged from 0.0011 to 0.1287.
Overall, the CS of these analyses were less than 1 under all scenarios, which indicated that the total eco-system service value of study area were relatively inelas-tic with respect to the given equivalent value per unit area of ecosystem services in the Nenjiang River Basin. The equivalent value and ecosystem service evaluation in this study were acceptable.
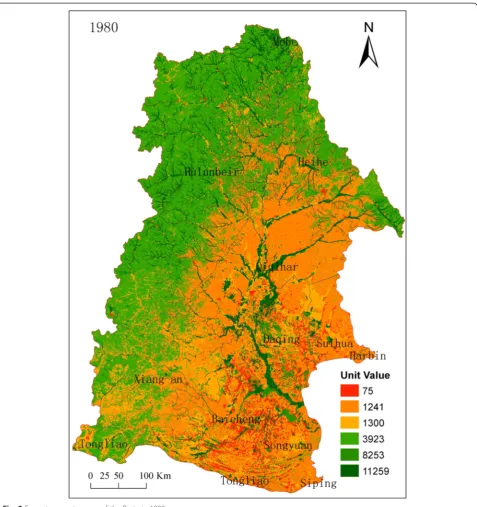
Ecosystem service space distribution
In order to show the space distribution of ecosystem ser-vices in the Nenjiang River Basin, the maps of ecosystem services in 1980 (Fig. 3) and 2005 (Fig. 4) were drawn, and the average ecosystem service value of each city was calculated in Table 9.
From Figs. 3 and 4 and Table 9, we could get that the average ecosystem service value in the Nenjiang River Basin decreased gradually from the northwestern up-stream mountainous area to the southeastern down-stream plain. The higher valuable area are located in the Da and Xiao Xing’anling Ranges, such as Mohe, Hulun-beier, and Heihe city, while the lower valuable area are Baicheng, Songyuan, and Suihua city in the downstream plain. However, the Xing’an League, which also belongs to the Da Xing’anling mountainous area, is of a lower average ecosystem service value due to four great grass-land reclamation activities from the 1950s (Pan et al. 2002; Su et al. 2005). According to statistics, the area of
farmland in the Xing’an League increased about
44.21 % from 1996 to 2000 and 6.63 % from 2001 to 2005 (Ying, 2009).
The average ecosystem service value all decreased from 1980 to 2005, except for Mohe and Tongliao city. The highest decline happened in Qiqihar city, from 25.96 USD · ha−1 in 1980 to 24.13 USD · ha−1 in 2005, decreasing about 1.82 USD · ha−1· a−1. Next were Heihe and Daqing city, where large-scale farms were built in the past.
Discussion
Driving forces of land use/land cover and ecosystem service change
The Nenjiang River Basin is an important foodstuff base and eco-environmental fragile area in Northeast China. Because temperature shows an increasing trend of 0.3 °C per decade in the recent 50 years in Northeastern China (Luan et al. 2007; Ju et al. 2007), exceeding the warming amplitude of global average temperature obviously (Liu, 2007), the 1 °C isotherm of average annual temperature gradually shifted northward during 1986–2000 (Wang et al. 2009); the growing season was so prolonged that rice could be cultivated in more northern areas than ever before. The previous wetland or grassland, even non-irrigated dry fields, was reclaimed as paddy field under encouragement policy, resulting in the dramatic decrease of grassland or wetland and increment of farmland.
However, annual and seasonal precipitation in Northeastern China shows slightly decreasing trends, especially in summer precipitation (Ren et al. 2000; Lu, 2009). In the Nenjiang River Basin, the warming and drying trend has influenced the seasonal streamflow and altered the annual hydrograph of the basin. The decrease of streamflow in the lower basin (mainly allu-vial plains) has caused wetland degradation, desertifi-cation, and soil salinization (Zhang and Guo 2008; Du et al. 2009; Feng et al. 2011).
Land use and land cover changes are particularly re-lated to the increase of population and intensive agri-culture (Verburg et al. 1999). Due to the increase in population and the concomitant requirement of grain, the building of farmland not only accelerated deforest-ation and cultivdeforest-ation of grassland and wetland but also resulted in damages to the ecological environment such as land degradation and ecosystem service recession.
According to the study by Han et al. (2005) in Zhao-guang Farm, which was the first mechanical farm built in Heihe city in late 1950s, the vegetation has changed from natural vegetation to cropweed, to rotation of corn-soybean-wheat, or to rotation of corn-soybean. Table 8The magnitude of changes in total economic values and CS (billion USD · a−1)
Change of equivalent value Change of total values CS
1980 2005 1980 2005
Forest E ± 50 % 119.94 ~ 79.94 116.86 ~ 78.16 0.4003 0.3970
Grassland E ± 50 % 103.04 ~ 96.84 100.20 ~ 94.82 0.0621 0.0551
Farmland E ± 50 % 105.58 ~ 94.30 103.78 ~ 91.24 0.1128 0.1287
Wetland E ± 50 % 119.01 ~ 80.87 115.99 ~ 79.03 0.3816 0.3790
Lakes/rivers E ± 50 % 102.05 ~ 97.83 99.42 ~ 95.60 0.0421 0.0391
The most important meadow soil has suffered sub-stantial degradation after cultivation. If we took the soil C pool at the depth of 1 m in natural soil under the Steppified herbosa vegetation as control, the soil C pool under crops decreased by 7.76, 12.93, 14.66, 17.24, 20.26, and 23.71 % after 2, 8, 15, 30, 50, and 100 years cultivation, respectively (Fig. 5). Similarly, the soil N pool decreased by 6.5, 9.6, 11.3, 12.4, 12.5, and 13 %, respectively, in contrast to the increased trend
of the soil N pool in the 0- to 50-cm-deep natural meadow soil.
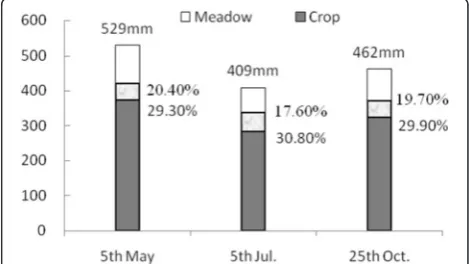
For the same weather condition, in contrast to water storage in the 1-m-deep natural meadow soil, the water storage of soil after cultivation would decrease from 20.40 to 29.30 % in spring, 17.60 to 30.80 % in summer, and 19.70 to 29.90 % in Autumn (Fig. 6).
Deforestation and destruction of grassland has se-verely altered water distribution on land surface.
Instead of infiltration and percolation, most of the sur-face runoff enters the channel directly during heavy rain, carrying soil from denuded farmland with it (Liu et al. 2005).
In short, it is land use/land cover changes that make tremendous influence on water and soil losses, but there is a little relationship of water and soil losses with the cultivation time. The effect of soil use/cover is bigger than the time effect (Han et al. 2005).
The effect of policy
Similar to the rest of China, policies of the central government put direct and important effects on land use/land cover changes in the Nenjiang River Basin. In the early 1980s, the decentralized decision-making in agricultural production of the household contract re-sponsibility system afforded farmers more freedom in looking after their own interest. But, the central gov-ernment attached great importance to food
sufficiency; as users of the land (but not its owners), farmers still had to honor grain production quotas im-posed by the government (Wang et al. 2009). Due to the inconsistency between decision-making at the macro-level and the objective of agricultural produc-tion at the micro-level, cultivated land was increased through zealous reclamation of grassland, marginal woodland, and even fallow land (Liu et al. 2005).
By the late 1990s, after market-oriented reforms in-troduced to the agrarian sector, northeast-grown maize and soybean were not as profitable as rice in the market. Thus, large-scale farms were transformed into paddy fields; such changes have caused a severe short-age of water resources and the shrinkshort-age of lakes/rivers along with climate change. These years, although the ecological functions of woodland, grassland, and wet-lands were recognized widely and ecological projects such as “Grain for Green” and “Construction of Eco-logical Province” were adopted, driven by the short-term economic interests, in the less developed county, the reclamation of reserve resources still caused a
substantial increase of farmland, and the amount of agricultural labor grew steadily (Liu and Li 2010).
Conclusions
According to the above calculation and analysis, in the Nenjiang River Basin, the two most valuable land use types were forest (40.00 billion USD, about 40.03 % of the total value in 1980; 38.71 billion USD, about 39.70 % of the total value in 2005) and wetland (38.14 billion USD, about 38.16 % of the total value in 1980; 37.90 bil-lion USD, about 37.90 % of the total value in 2005), which are mainly located in the upstream Da and Xiao Xing’ anl-ing mountainous area, such as Mohe, Hulunbeier, and Heihe city. The economic value of land use types de-creased obviously from 1980 to 2005, especially in the grassland of the downstream plain, such as Qiqihar and Daqing city, where large-scale grassland and wetland were reclaimed as farms in the past.
As for individual ecosystem service, besides the food pro-duction, all of the ecosystem service values declined from 1980 to 2005, of which water regulation and supply de-creased the most for the human-induced cultivation and the warming and drying trend in the Nenjiang River Basin. Table 9Total area and economic value of each city from 1980 to 2005 (USD · ha−1· a−1)
Citya Area (ha) 1980 Rank 2005 Rank Change Rank Trend
Mohe 150,119 58.85 1 59.54 1 0.68 7 ↑
Hulunbeier 10,017,875 45.84 2 45.78 2 −0.06 10 ↓
Heihe 3,228,976 38.74 3 37.07 3 −1.67 2 ↓
Tongliao 565,079 30.71 4 30.96 4 0.25 8 ↑
Daqing 1,705,401 30.28 5 28.73 5 −1.55 3 ↓
Xiang’an 4,396,439 27.53 6 26.75 6 −0.77 6 ↓
Qiqihar 4,134,101 25.96 7 24.13 7 −1.82 1 ↓
Baicheng 2,453,927 23.14 8 22.12 8 −1.02 5 ↓
Songyuan 1,387,153 18.70 9 17.23 9 −1.47 4 ↓
Suihua 1,026,414 16.40 10 16.22 10 −0.18 9 ↓
a
Cities of small area belonging to the Nenjiang River Basin were not included, such as Siping, Changchun, and Harbin
Fig. 5Time variation of soil C pool and N pool in meadow soil after cultivation.BRbefore cultivation;2YR,8YR,15YR,30YR,50YR,100YR years after cultivation
In a word, the economic value of ecosystem services in the Nenjiang River Basin decreased 2.43 billion USD, about 97.2 million USD per year from 1980 to 2005, due to tremendous land use/land cover changes under the encouragement policy during the past decade. So, the policies of Grain for Green and Construction of Eco-logical Province projects should be well-implemented to optimize land use/land cover.
Competing interests
The authors declare that they have no competing interests.
Authors’contributions
ZLW, ZW, and BZ designed the research; ZLW, CL, and CR conducted the research and analyzed the data; ZLW drafted the manuscript; ZW, BZ, and CR revised the manuscript. All authors read and approved the final manuscript.
Author details 1
Northeast institute of Geography and Agroecology, Chinese Academy of Sciences, Changchun 130102, China.2University of Chinese Academy of
Sciences, Beijing 100101, China.3ScienceCollege of Qiqihar University, Qiqihar 161006, China.
Received: 16 December 2014 Accepted: 7 June 2015
References
Anna H, Sabine S, Thomas W (2011) The concept of ecosystem services regarding landscape research: a review. Living Rev Landscape Res 5(1):5–25 Bai Y, Ouyang ZY, Zheng H, Xu WH, Jiang P, Fang Y (2011) Evaluation of the
forest ecosystem services in Haihe River Basin, China. Acta Ecol Sin 31(07):2029–2039
Boone RB, Galvin KA (2000) Generalizing EI Nino effects upon Maasai livestock using hierarchical clusters of vegetation patterns. Photogramm Eng Remote Sens 66(6):737–744
Costanza R, dArge R, de Groot R, Farber S, Grasso M, Hannon B, Limburg K, Naeem S, Oneill RV, Paruelo J, Raskin RG, Sutton P, van den Belt M (1997) The value of the world’s ecosystem services and natural capital. Nature 387:253–260
Dong LQ (2013) Effects of climate change on wetland hydrology and water resources and the adaptation strategies in Nenjiang River Basin. University of Chinese Academy of Sciences, Beijing (China)
Du SM, Gong WF, Du C, Du CX (2009) Spatiotemporal change of desertification in lower reaches of Nenjiang River: a remote sensing analysis based on MODIS data. J Nat Disasters 18(5):131–137
Feng XQ, Zhang GX, Yin XR (2011) Hydrological responses to climate change in Nenjiang River Basin, Northeastern China. Water Resour Manag 25(2):677–689 Freitas SR, Mello C (2005) Relationships between forest structure and vegetation
indices in Atlantic Rainforest. For Ecol Manag 218(1):353–362
Han XZ, Wang SY, Song CY, Qiao YF (2005) Effects of land use and cover change on ecological environment in black soil region. Sci Geol Sin 25(2):203–207 Hou W, Wang Y, Ma XP, Wu D, Xu CB, Hu C, Li X (2013) Changes of temporal-spatial pattern and services evaluation of the ecosystem in the Liaohe river basin. J Meteorology Envi 29(4):71–76
Hu RF, Leng Y (2006) A study on input and output of main grain crops in China. J Agrotechnical Econ 3:2–81
Huete A, Didan K, Miura T, Rodriguez EP, Gao X, Ferreira LG (2002) Overview of the radiometric and biophysical performance of the MODIS vegetation indices. Remote Sens. Environ. 83:195–213
Ju H, Xiong W, Xu YL, Lin ED (2007) Climate change and its impacts in Northeast China. Chin AgricSci Bull 23(4):345–349
Kerr MF, Ostrovsky M (2003) From space to species: ecological applications for remote sensing. Trends Ecol Evol 18(6):299–305
Li HY, Wang XY, Jia LN, Wu YN, Xie M (2014) Runoff characteristics of the Nen River Basin and its cause. J Mt Sci 11(1):110–118
Liu CM (2007) Study on water and eco-environmental problems and protection strategy. Science Press, Beijing
Liu YS, Li YR (2010) Spatio-temporal coupling relationship between farmland and agricultural labor changes at county level in China. Acta Geograph Sin 65(12):1602–1612
Liu YS, Gan H, Gao J, Deng XS (2004) The causes and environmental effects of land use conversion during agricultural restructuring in Northeast China. J Geogr Sci 14(4):488–494
Liu YS, Wang D, Gao J, Deng W (2005) Land use/cover changes, the environment and water resources in Northeast China. Environ Manag 36(5):691–701 Liu MC, Li DQ, Wen YM, Luan XF (2006) Function and value of water-holding in
Sanjiangyuan region. Res Envi Yangtze Basin 15(3):405–408
Liu JW, Jin TT, Liu GH, Li ZS, Yang RJ (2014) Changes in land use and soil and water conservation of the upper and middle reaches of Heihe river basin during 2000–2010. Acta Geograph Sin. doi:10.5846/stxb201303010328 Loris V, Damiano G (2006) Mapping the green herbage ratio of grasslands using
both aerial and satellite-derived spectral reflectance agriculture. Ecosys Envi 115:141–149
Lu AG (2009) Spatial precipitation variation across China during 1951–2002. Ecol Environ Sci 18(1):46–50
Luan ZQ, Zhang GX, Deng W, Hu JM, Zhou DM (2007) Studies on changes of air temperature and precipitation for last 50 years in Songnen Plain. Chin J Agrometeorol 28(4):355–358
Pan JW, Zhong HP, Yun XJ (2002) Natural grassland reclamation and its ecological impaction in recent 50 years. Grassland of China 24(5):69–72 Ren GY, Wu H, Chen ZH (2000) Spatial patterns of change trend in rainfall of
China. Q J Appl Meteorol 11(3):322–330
Roces-Díaz JV, Díaz-Varela RA, Álvarez-Álvarez P, Recondo C, Díaz-Varela ER (2014) A multiscale analysis of ecosystem services supply in the NW Iberian Peninsula from a functional perspective. Ecol Indic 50:24–34
Running SW, Baldocchi DD, Turner DP, Gower ST, Bakwin PS, Hibbard KA (1999) A global terrestrial monitoring network integrating tower fluxes, flask sampling, ecosystem modeling and EOS satellite data. Remote Sens Environ 70(1):108–127
Stoms DM, Hargrove WW (2000) Potential NDVI as a baseline for monitoring ecosystem functioning. Int J Remote Sens 21:401–407
Su H, Liu GX, He T (2005) Reclamation of grassland and its harm. Grassland China 27(6):61–63
Sun YG, Bai RH (2005) Main meteorological disaster in Songhua river and Nen river. Meteorological Press, Beijing
Verburg PH, Veldkamp A, Bouma J (1999) Land-use change under conditions of high population pressure: the case of Java. Glob Environ Change 9(4):303–312 Wang ZM, Zhang B, Zhang SQ, Li XY, Liu DW, Song KS, Li JP, Li F, Duan HT (2006)
Changes of land use and of ecosystem service values in Sanjiang plain, Northeast China. Environ Monit Assess. doi:10.1007/s10661-006-0312-5 Wang ZM, Liu ZM, Song KS, Zhang B, Zhang SM, Liu DW, Ren CY, Yang F (2009)
Land use changes in Northeast China driven by human activities and climatic variation. Chin Geogra Sci 19(3):225–230
Wu X, Shen ZY, Liu RM, Gong YW (2009) Effects of land use change on ecosystem services value of the upper reaches of the Yangtze River. Transact CSAE 25(8):236–241
Xie GD, Lu CX, Leng YF, Zheng D, Li SC (2003) Ecological assets valuation of the Tibetan Plateau. J Nat Res 18(2):189–196
Xie GD, Xiao Y, Zhen L, Lu CX (2005) Study on ecosystem services value of food production in China. Chinese J Eco-Agri 13(3):10–13
Xie GD, Zhen L, Lu CX, Xiao Y, Chen C (2008) Expert knowledge based valuation method of ecosystem services in China. J Nat Res 23(5):911–919
Ying G (2009) Negative effect of cultivation in Xiang-an League since foundation of the country. Inner Mongolia normal university, Huhehot
Zhang GX, Guo YD (2008) Study on the wetland ecological and hydrological functions and their degradation mechanisms and counter measures in the middle and lower reaches of Nenjiang River. J Arid Land Resour Environ 22(1):122–128
Zhang WG, Hu YM, Zhang J, Liu M, Yang ZP (2007) Assessment of land use change and potential eco-service value in the upper reaches of Minjiang River, China. J For Res 18(2):97–102