49
Using Pictorial Maps to Scaffold Problem
Solving in Primary-Grade Arithmetic
Massalin Sriutaia, Surapon Boonluea, Jariya Neanchaleaya and Elizabeth Murphyb Corresponding author: Massalin Sriutai ([email protected])
aFaculty of Industrial Education and Technology, King Mongkut’s University of Technology Thonburi,
126 Pracha Uthit Rd., Bangmod, Thung Khru, Bangkok 10140, Thailand
bFaculty of Education, Memorial University of Newfoundland, St. John’s, Newfoundland and Labrador, Canada
A1B 3X8
Keywords: visual representation, problem-solving, primary grades, arithmetic, pictorial maps
International Journal of Innovation in Science and Mathematics Education, 26(5), 49–65, 2018.
Abstract
In this study, primary-grade students learned to solve and create arithmetic word problems using a three-phase process of visual representation. The study compared an experimental group (n=32) of third graders in Thailand using pictorial maps with a control group (n=31) using text-based problems. The visual representations called pictorial maps are unique in that they focus on place (location) in order to situate math problems in authentic contexts. In phase 1, students were given a pictorial map with imprinted objects representing keywords to help them solve a word problem. In phase 2, they used a blank pictorial map on which they could place plastic chips with imprinted images representing the problem’s keywords. In phase 3, they used a blank sheet with cut-outs of images representing keywords that they could use to represent their own word problems. Results revealed significantly higher post-test scores for the experimental group. Implications point to the value of mathematics’ teachers working with art teachers in their school to identify ways to use drawing to support representations of keywords and of other elements in word problems.
Introduction
Performance in mathematics at the primary grades is important given that achievement at this level is a strong predictor of achievement in schooling in later years (Stern, 2009) and can affect future socio-emotional well-being (McCloskey, 2007). Yet, this performance may be of “particular concern for educators” given that scores tend to be lower than in other curriculum areas (Pearce, Bruun, Skinner, & Lopez-Mohler, 2013, p. 3). Peltier and Vannest (2017) found in their analysis of national assessment data in the USA that 60% of fourth-graders and 67% of eighth-graders failed to reach mathematical proficiency. Low scores are particularly common in the area of problem solving.
50
In general, visual representations such as pictures “appear to enhance intuition and understanding in many areas of mathematics” (Blatto-Vallee, Kelly, Gaustad, Porter, & Fonzi, 2007, p. 434). Representations are important in general in terms of effective communication, in terms of problem solving and to “elicit student understandings” (Hill, Sharma, Obyrne, & Airey, 2014, p. 23). They are “an integral part of learning mathematics” particularly because of the intangible and invisible nature of math (Bobis & Way, 2018, p. 57). The National Council of Teachers of Mathematics (NCTM, 2000) emphasised the need for access to and creation of mathematical representations in order to “expand their [students’] capacity to model and interpret physical, social, and mathematical phenomena” (p. 4). The NCTM further recommended that students “create and use representations to organize, record, and communicate mathematical ideas… to model and interpret physical, social, and mathematical phenomena” (NCTM, 2000, p. 64).
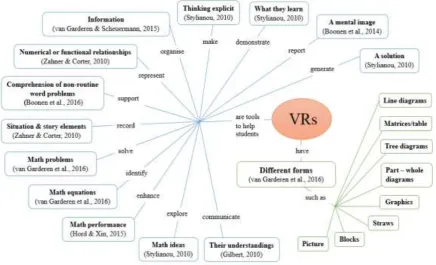
Although the use of representations has played a role in mathematics education since classical Greece, symbolic reasoning and representation gradually dominated and it was not until this century with the use of computer-generated images that interest in visual representations in mathematics began to become important again (Stylianou & Silver, 2004). Figure 1 summarises visual representations in mathematics.
Figure 1: Summary of visual representations
51
observed the lack of research on student-generated representations and recommended that researchers study representations (drawings) that students create themselves in order to gain insight into their thinking and understanding. Past research has tended not to focus on students’ own visual representations but on “the impact of different types of illustrations, provided by the experimenter or another external source, on word problem solving” (Boonen et al., 2014, p. 23).
Purpose and objectives
This gap in the literature provided the motivation for this study. In this study, the researchers first designed pictorial maps to support problem solving in arithmetic. These visual representations are unique in that they focus on place (location) in order to situate math problems in authentic contexts. The focus on place through pictorial maps allowed grade 3 students to ‘map’ out or depict the problem in relation to a location. The study used three phases whereby students were first given a pictorial map with visual representations of keywords to help them solve a problem. In the next phase, they were given a blank pictorial map on which they could place plastic chips with imprinted images related to the problem’s keywords. In the final phase they used a blank sheet to represent the problem along with cut-out figures and objects representing the keywords.
The specific research question was as follows:
1. Does use of the maps improve students’ ability to problem solve?
Review of the literature
The review focused on studies conducted within the last five years (2013-2018). It was limited in scope to those studies conducted in mathematics within the primary grades (1-3). The review aimed to present a variety of types of visual representation.
Table 1: Studies of visual representation in mathematics in primary
Study VR type Location Grade N Types of
student Data collection van Lieshout & Xenidou-Dervou (2018) Pictures (e.g., birds, children) Nether - lands
1 60 High & low mathematics achievers Experimental. Liggett (2017) Plastic unifix cubes
Canada 2 43 Regular Experimental with pre & post-test.
Morin et al. (2017)
Bar model drawings
USA 3 6 Difficulty in
Mathematics
Survey, Experimental with pre & post-test. Driver & Powell (2015) Symbolic equations & non-symbolic with picture
USA 2 413 With & without Mathematics difficulty
52 Mulligan et al. (2013) Vertical & horizontal grid lines of graphs/bars
Australia 1 21 High socio-economic backgrounds & range of cultural/ ethnic groups
Observations & evaluation notes taken by the researchers.
Siew et al. (2013)
Tangrams Malaysia 3 221 Regular Experimental with pre & post-test.
Results of these six studies all showed gains for participating students. Van Lieshout and Xenidou-Dervou (2018) found that a combination of pictorial representation with “auditory
information” increased learners’ accuracy by decreasing cognitive load. Liggett’s (2017) study revealed significantly higher test scores for the experimental group using manipulatives versus the control group. Morin et al. (2017) combined schematic-based and cognitive strategy instruction with bar model drawing (unit bars) to solve word problems. They concluded that students’ bar model drawing in the younger grades can be built upon for use in solving more complex problems in later grades. Driver and Powell (2015) focused on use of pictures as a non-symbolic form for solving non-standard equations. They concluded that use of pictures may be particularly relevant in improving scores of students with mathematical difficulty. The authors recommended use of symbolic as well as non-symbolic representations in mathematics. Mulligan, Hodge, Mitchelmore, and English’s (2013) focus on graphing skills revealed that students took different approaches to representing elements such as gridlines and icons. The authors also noted progressive refinement of skills and that there are basic structural features that students need to learn. Siew, Chong and Abdullah (2013) combined phases of learning with tangrams to improve grade 3 students’ ability to move from visualisation to analysis in geometric thinking. Siew et al. found that low-ability students benefited from the approach more than the other students.
These studies have in common with the present study an underlying premise of a need to provide cognitive scaffolds in the form of representation to overcome the abstract and symbolic nature of mathematics. What is unique about this study is its focus on the notion of place or location as a basis for moving from the symbolic to the authentic. Also different in this study is the three-phase approach designed to ultimately allow students to create their own representations of problems. Finally, a unique approach taken in this study is the visual representation of keywords on plastic chips for use by students.
Context of the study
53
mathematics with other disciplines; and creative thinking.” Thailand participated in the 4th
grade Trends in International Mathematics and Science Study (TIMSS) in 1995, and in 2011 (National Center for Education Statistics, n.d.). Prakitipong and Nakamura (2006) noted regarding the 1995 results that Thai students were “fifth from the bottom among 26 participating countries” (p. 111). Students were particularly weak in problem solving. Testing in 2002 for grade three students (see Office of the National Education Council, 2004, p. 160) showed a mean of 15.7/30. Prakitipong and Nakamura (2006) concluded that those who performed poorly “had linguistic and conceptual comprehension problems” (p. 120). Phonapichat, Wongwanich and Sujiva (2014) interviewed Thai math teachers to identify “problem solving difficulties.” Their findings revealed difficulties reading “keywords appearing in problems” (p. 3172).
Methods
Non-student participants
A graphic designer was responsible for transforming the storyboards created by the researcher into pictorial maps. Two participants, one with a Ph.D. in mathematics and another with a Masters in mathematics, provided input on the content and on the pre- and post-test. One participant with a Ph.D. in elementary education also provided input on the design, content and testing. There were also three participants with a Ph.D. in Educational Technology who provided input and suggestions on the design in terms of its educational effectiveness.
Student participants for prototype testing
The prototype was tested twice. For the first testing, participants were 30 learners in one grade-three class from a school in north-eastern Thailand. For the second testing, the 12 learners were from a school in Bangkok.
Prototype creation
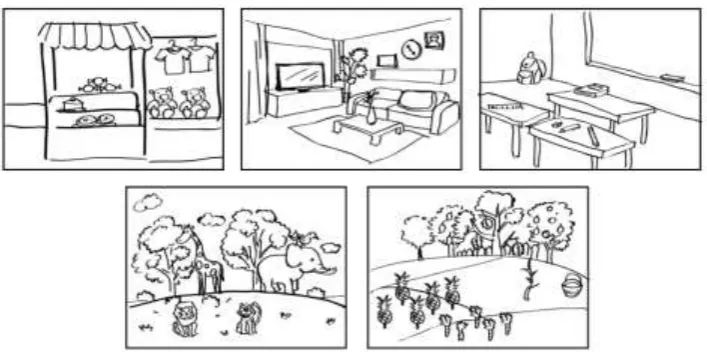
The first step in the creation of the prototype involved drawing the storyboard. The (principal investigator) PI drew by hand a prototype that represented a place-based situation. Next, the PI used a digital design tool (smart pen & drawing pad) to redesign the same images. The PI sent the storyboard to a graphic designer who used Adobe Illustrator to create a digitised final version. Figure 2 shows a prototype of maps with objects (keywords). Figure 3 shows a prototype of maps without objects (keywords).
54
Figure 3: Prototype of maps without objects (keywords)
The design also included the creation of round plastic chips which represented both objects, persons, symbols and numbers that students could use to place on blank maps in order to represent keywords. Figure 4(a) 4(b) shows the initial design.
Figure 4: Initial design of chips (keywords)
Procedures
After the design, the PI sent the five pictorial maps and chips to the specialists mentioned in the previous section. They assessed the match between contents and language use and gave suggestions. The first prototype testing took place at the school during the students’ regular mathematics’ period. Testing took place one hour per day for three days. The regular teacher and PI were both present and could observe as students were working. The first prototype test involved assessing students’ ability to integrate information, understand the content and use graphical representations, appropriate font size and figures. The students were also evaluated regarding the overall time required to complete tasks.
55
Implementation participants Participants for implementation were 38 boys and 25 girls (ages 8-9) (N=63) from two (one
experimental and one control) grade-three classes in a public primary school in Bangkok. The students were from the same school where the second prototype testing took place. This school was chosen because the teacher had already established ethics’ permission to carry out the study in this school and had established a rapport with its teachers.
Implementation procedures
Implementation lasted 12 weeks. The PI worked with each of the control and experimental groups for three hours per week, one hour at a time. The PI gave both the control and experimental groups of students the same arithmetic problems (subtraction or addition) within the same length of time. The problem for both groups was situated in one of five locations: home, market, school, zoo and garden. An example is: Lin, Jane and Amy were at the market. Lin bought 19 donuts. Amy bought 40 donuts. Jane bought 12 more donuts than Amy. How many more donuts did Jane buy than Lin?
The teacher was present and the PI followed the procedures that the teacher normally followed to teach about problem solving. For the control group, students read the word problem. They were instructed as usual to find keywords in the problem. For the experimental group, there were three phases. For phase 1, the PI gave the experimental group a pictorial map related to the problem. On the map were pictures of the keywords related to the problem. The pictorial maps were a direct visual representation of the problem. The student was given the problem and could see it visually before solving it.
For phase 2, after students had been instructed in and given practice with this phase 1 approach, the PI then gave them pictorial maps on which there were no items corresponding to the keywords. Instead, the keywords were designed as images and imprinted onto plastic chips. For example, if there was an elephant in the problem, students could choose a chip with the elephant. Students could also use math symbols and number chips. They could then create visual sentences by placing chips on the maps.
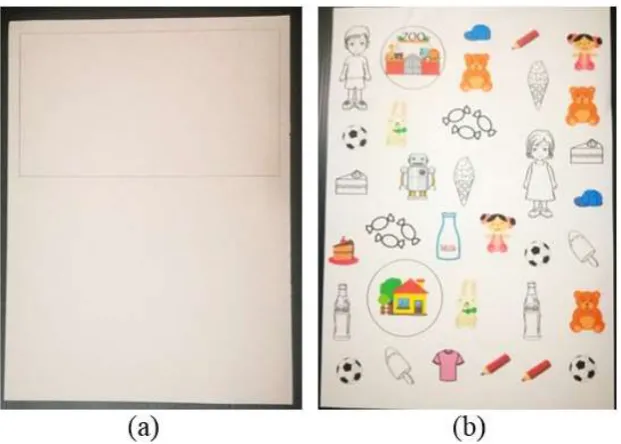
For phase 3, the PI gave students large sheets of paper with an area delimited for drawing. They were also given a sheet with premade cut-outs for keywords so that they could create their own problems and depict them using pictorial maps.
Testing participants
Participants for the testing were the same as those students for the implementation. Testing procedures
56 Table 2: Summary of testing
Weeks Contents Test
1 A, B, C, D Pre-
2-3 A. Compare and order numbers in word problems Pre- Post-
4-6 B. Addition word problems Pre- Post-
7-9 C. Subtraction word problems Pre- Post-
10-11 D. Complex word problems Pre- Post-
12 A, B, C, D Post-
Instrument
The pre- and post-tests were evaluated by the mathematics’ and education specialists described in the previous section. The tests were competed in the classroom by students using paper and pencil and the Thai language. The tests were adapted from heuristics in mathematics by Goh (2015). One example is: Paul and Jack go to the market. They bought 1200 marbles. Paul received 150 marbles more than Jack. How many marbles did Jack have?
Data analysis
Analysis of the pre-test and post-test scores involved independent two-sample t-tests to evaluate the difference between the means of two independent or unrelated groups. The testing was conducted to compare the significance of scores between the experimental group (learning with pictorial maps) and the control group (learning with text).
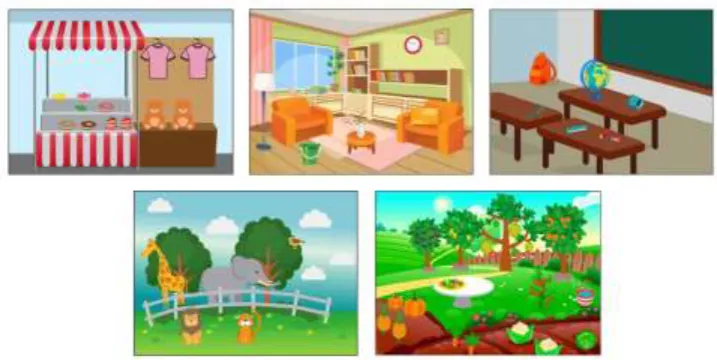
The design of the maps
The final design resulted in the creation of five maps. These maps were used in phase 1 of the implementation to get students used to understanding visual representations of problems. The maps include the objects representing keywords from the problems. Figure 5 shows these maps.
57
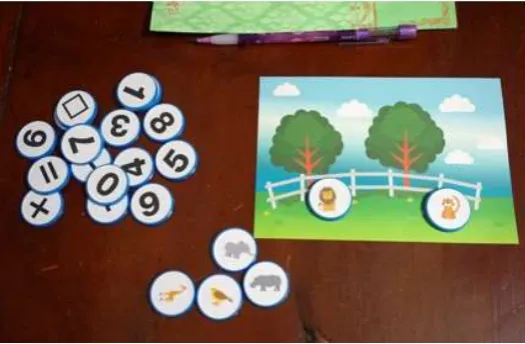
Figure 6 shows the blank maps used in phase 2. Figure 7 shows the chips to be used with the maps for representing keywords from the problems.
Figure 6: Phase 2: Pictorial maps without objects representing keywords
Figure 7: Phase 2: Use of chips with blank maps
58
Figure 8. Phase 3: Blank sheets and cut-out items
Figure 9. Phase 3: Student’s use of the blank sheets with cut-out items
Results
59
Table 3: Results of comparing and ordering numbers in word problems
*P<0.05
Table 4 shows the results for addition word problems. The mean for the pre-test with the experimental group was 5.50 (SD = 0.950) and the control group was 5.06 (SD = 0.727). The mean for the post-test with the experimental group was 7.50 (SD = 0.950) and the control group was 6.16 (SD = 0.969). The analysis of the test data indicated significant treatment effects, controlling for pre-test and post-test, p = 0.000. These results indicate that the use of pictorial maps was more effective for addition word problems than text alone.
Table 4: Addition word problem results
*P<0.05
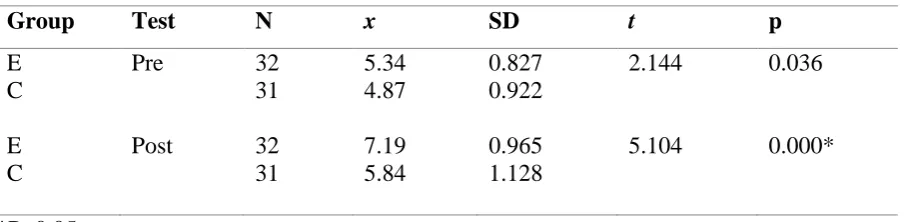
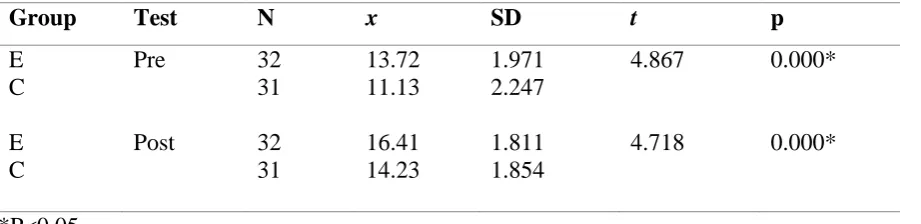
Table 5 shows results for subtraction word problems. The mean for the pre-test with the experimental group was 5.34 (SD = 0.827). The control group was 4.87 (SD = 0.922). The mean for the post-test with the experimental group was 7.19 (SD = 5.84) and for the control group, 5.84 (SD = 1.128). The analysis of the test data indicated significant treatment effects, controlling for pre-test and post-test, p = 0.000. These results indicate that the use of pictorial maps was more effective for subtraction word problems than text alone.
Table 5: Subtraction word problems results
*P<0.05
Table 6 shows the t-test results for complex word problems. The mean for the students’ pre-test with the experimental group was 5.13 (SD = 0.871). The control group was 4.97 (SD =
Group Test N x SD t p
E Pre 32 4.53 0.803 2.237 0.029
C 31 3.97 1.169
E Post 32 6.28 0.888 3.442 0.001*
C 31 5.35 1.226
Group Test N x SD t p
E Pre 32 5.50 0.950 2.038 0.046
C 31 5.06 0.727
E Post 32 7.50 0.950 5.535 0.000*
C 31 6.16 0.969
Group Test N x SD t p
E Pre 32 5.34 0.827 2.144 0.036
C 31 4.87 0.922
E Post 32 7.19 0.965 5.104 0.000*
60
1.048). The mean for the post-test with the experimental group was 7.06 (SD = 1.014) and the control group was 6.06 (SD = 0.929). Results indicate significant treatment effects controlling for pre-test and post-test, p = 0.000. These results indicate that the use of pictorial maps was more effective for complex word problems than text alone.
Table 6: Complex word problems results
*P<0.05
Table 7 shows the results of the independent t-test used to determine the difference between the means of the pre-test and post-test of the experimental group. The overall pre-test mean for the experimental group was 13.72 (SD = 1.971) and the control group was 11.13 (SD = 2.247). The overall mean for the post-test with the experimental group was 16.41 (SD = 1.811) and the control group was 14.23 (SD = 1.854). The analysis of the data indicated significant overall treatment effects, controlling for pre-test and post-test, p = 0.000.
Table 7: Results for initial and final pre- post-test for all areas
*P<0.05
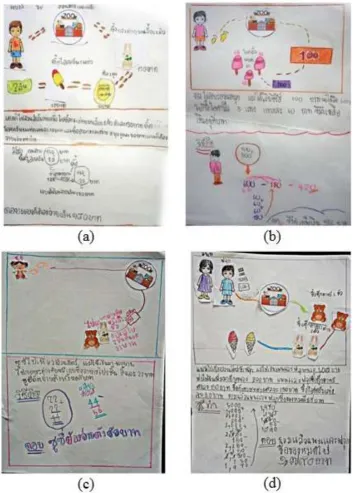
For phase 3, results revealed that students in the experimental group could easily create pictorial maps. They could integrate information into the pictorial maps and create questions relevant to problem solving. They could also systematically arrange the story elements in chronological order. For example, Figure 10 (a, b, c & d) shows the student going to the zoo. Figure 10a shows that, at the zoo, he saw a rabbit. He bought the rabbit for 150 baht. Then, he brought it to his house. Later, he bought food for the rabbit (20 baht) and ice cream (10 baht) for himself. Underneath (Figure 10a), he wrote the math problem. In Figure 10b, another boy shows that he went to the zoo. He bought three ice creams. In the description, he explains that, before he went to the zoo, his mother gave him 100 baht. Then, his father gave him 500 baht. Each ice-cream cost 60 baht. He diagrammed the addition and subtraction problem to show that he had 420 baht remaining.
Group Test N x SD t p
E Pre 32 5.13 0.871 0.649 0.519
C 31 4.97 1.048
E Post 32 7.06 1.014 4.070 0.000*
C 31 6.06 0.929
Group Test N x SD t p
E Pre 32 13.72 1.971 4.867 0.000*
C 31 11.13 2.247
E Post 32 16.41 1.811 4.718 0.000*
61
Figure 10: Students’ depictions of problems using their own maps
Discussion
62
solve. This study focused on gradually building students’ ability to create their own visual representations. It also focused on visual representation of keywords.
The study relied on a three-phase process to scaffold students’ problem solving. The process moved from the more to the least abstract representations. In the first phase, students used a pictorial map of a place in which the problem was situated. The keywords related to the problem were already featured on the map. The map was designed to give the student a visual, concrete representation to support solving it. In phase 2, students once again used the pictorial maps. However, in this phase, there were no items corresponding to the keywords. Instead, students could choose to place on the maps, keywords, math symbols and numbers in the form of pictures on plastic chips. They could then create visual depictions of the problems by placing chips on the maps. For phase 3, students were responsible for creating their own pictorial maps using large sheets of paper with an area delimited for drawing a scene. They could use premade drawings depicting the keywords then place them on their own drawings to represent a word problem that was relevant to them and that they created themselves.
Results revealed significantly higher post-test scores for the experimental group. The success of the pictorial maps is consistent with the findings of studies of other forms of visual representation such as those reported in this paper’s review of the literature. That success is likely due to the cognitive scaffolding that representation offers. It may be due as well to linguistic support for visual representation of keywords. One of the unique contributions of this study is the use of the ‘chips’ to represent keywords. As noted in this paper’s introduction, reading has been recognised as a barrier to students’ ability to solve word problems. Use of the visual keywords on chips offers scaffolds and reinforcement to the process of solving the word problems.
Other explanations may relate to the findings of Rasmussen and Bisanz (2005). In their study, pre-schoolers doing arithmetic relied on “visual–spatial working memory” (p. 137). Chu, Rittle-Johnson and Fyfe’s (2017) explanation of the role of representation in mathematics is in terms of grounding content in “familiar experiences [that] connect with learners’ prior knowledge” (p. 285). Hoogland and Pepin (2018) referred to the value in problem solving to depictive approaches using real-life images versus descriptive approaches for representing “the problem situation” (p. 37). The authors explained that descriptions using words tend to put students in an “answer-getting mind-set” whereas visual depiction requires more “sense-making” on the part of students so that they are “more likely [to] adopt a problem-solving attitude” (p. 38).
63
Conclusions
This study has highlighted the value of visual approaches to representing word problems in arithmetic. Specifically, it highlights the value of supports for reading and for understanding keywords by turning them into objects that students can manipulate and use to depict problems. The significant gains made by the experimental versus the control group provide evidence for approaches that concretise and situate learning in real contexts. This study relied on pictorial maps with chips for keywords. Those interested in replicating the study’s approach in other contexts may wish to use different types of pictorial maps and not necessarily chips.
In terms of implications for practice, what is important is devising a means to move the problem-solving process away from the abstract and symbolic towards more concrete, authentic forms. This study was premised on the argument that place and location provide an effective means to do this. Furthermore, the study was premised on the need to find alternate ways of allowing students to work with keywords such as with chips or other means. Mathematics’ teachers working in interdisciplinary contexts or in project-based learning contexts may wish to work with Art teachers in their school to identify ways to use drawing to support representations of keywords and of other elements in word problems. Other approaches to visualization in mathematics’ education involve use of digital technologies (see Birt & Cowling, 2017) that offer opportunities for “interactive, sensory-rich, experimental activities with greater opportunities for student input and creativity” (p. 1).
The study was limited to only one context in Thailand that may not be representative of other countries. It is up to the reader to identify the relevance to his or her context. However, given the poor performance of many primary students in many other contexts besides those of this study, it is likely that this approach would be relevant outside of the setting in which it was conducted. The study was conducted in the primary grades but its results may also be relevant at the elementary level through activities and visual representations that are appropriately designed for the grade level. The results reveal that the control group is a lower performing group than the experimental group since it obtained lower results for each pre-test. The results may need to be interpreted with this difference in mind. The differences obtained, although significant, cannot be completely attributed to the effect of the intervention, as there is room to think that the composition of the two groups could be the cause of a part of the difference. Given that the experimental group has higher pre-test scores than the control group, it would be of value for other researchers to try to replicate the study in other contexts with other groups of students.
References
Birt, J., & Cowling, M. (2017). Toward future ‘mixed reality’ learning space for STEAM Education.
International Journal of Innovation in Science and Mathematics Education, 25(4), 1–16. Blatto-Vallee, G., Kelly, R., Gaustad, M., Porter, J., & Fonzi, J. (2007). Visual–spatial representation in
mathematical problem solving by deaf and hearing students. The Journal of Deaf Studies and Deaf Education, 12(4), 432–448. doi:10.1093/deafed/enm022.
Bobis, J., & Way, J. (2018). Building connections between children’s representations and their conceptual development in mathematics. In V. Kinnear et al. (Eds.), forging connections in early mathematics teaching and learning. Singapore: Springer.
Boonen, A., van Wesel, F., Jolles, J., & van der Schoot, M. (2014). The role of visual representation type, spatial ability, and reading comprehension in word problem solving: An item-level analysis in elementary school children. International Journal of Education, 68, 15–26. doi:10.1016/j.ijer.2014.08.001.
64
Chu, J., Rittle-Johnson, B., & Fyfe, E. (2017). Diagrams benefit symbolic problem-solving. British Journal of Educational Psychology, 87(2),273–287. doi:10.1111/bjep.12149.
Driver, M., & Powell, S. (2015). Symbolic and nonsymbolic equivalence tasks: The influence of symbols on students with mathematics difficulty. Learning Disabilities Research & Practice, 30(3), 127–134. doi:10.1111/ldrp.12059.
Fuchs, L., Fuchs, D., Compton, D., Powell, S., Seethaler, P., Capizzi A., Schatschneider, C., & Fletcher, J. (2006). The cognitive correlates of third-grade skill in arithmetic, algorithmic computation, and arithmetic word problems. Journal of Educational Psychology, 98(1), 29–43. doi:10.1037/0022-0663.98.1.29.
Gilbert, J. (2010). The role of visual representations in the learning and teaching of science: An introduction.
Asia-Pacific Forum on Science Learning and Teaching, 11(1), 1-19. Retrieved from https://www.eduhk.hk/apfslt/download/v11_issue1_files/foreword.pdf.
Goh, M. (2015). Heuristics in maths. Singapore: Education Publishing House Pte Ltd.
Hill, M., Sharma, M., Obyrne, J., & Airey, J. (2014). Developing and evaluating a survey for representational fluency in science. International Journal of Innovation in Science and Mathematics Education, 22(5), 22– 42. Retrieved from https://openjournals.library.sydney.edu.au/index.php/CAL/article/view/7484/8465 Hoogland, K., & Pepin, B. (2018). Word problems versus image-rich problems: An analysis of effects of task
characteristics on students’ performance on contextual mathematics problems. Research in Mathematics Education, 20(1), 37–52. doi:10.1080/14794802.2017.1413414.
Hord, C., & Xin, Y. (2015). Teaching area and volume to students with mild intellectual disability. Learning Disabilities Research and Practice, 49, 118-128. doi:10.1177/0022466914527826.
Liggett, R. (2017). The impact of use of manipulatives on the math scores of grade 2 students. Brock Education Journal, 26(2), 87–101. Retrieved from https://eric.ed.gov/?id=EJ1160704.
McCloskey, M. (2007). Quantitative literacy and developmental dyscalculias. In D. Berch & M. Mazzocco (Eds.), Why is math so hard for some children? The nature and origins of children’s mathematical learning
difficulties and disabilities (pp. 415–429). Baltimore, MD: Brookes.
Morin, L., Watson, S., Hester, P., & Raver, S. (2017). The use of a bar model drawing to teach word problem solving to students with mathematics difficulties. Learning Disability Quarterly, 40(2), 91–104.
doi:10.1177/0731948717690116.
Mulligan, J., Hodge, K., Mitchelmore, M., & English, L. (2013). Tracking structural development through data modelling in highly able grade 1 students.In V. Steinle, L. Ball, & C. Bardini (Eds.), Proceedings of the 36th Annual Conference of the Mathematics Education Research Group of Australasia: Mathematics Education: Yesterday, Today and Tomorrow (pp. 530–537). Adelaide: MERGA.
Mullis, I., Martin, M., Goh, S., & Cotter, K. (Eds.) (2016). TIMSS 2015 Encyclopedia: Education policy and curriculum in mathematics and science. Retrieved from http://timssandpirls.bc.edu/
timss2015/encyclopedia/.
National Center for Education Statistics. (n.d.). TIMSS participating countries. US Department of Education. Retrieved from https://nces.ed.gov/timss/countries.asp.
National Council of Teachers of Mathematics. (2000). Executive summary: Principles and standards for school mathematics.Retrieved from https://www.nctm.org/uploadedFiles/Standards_and_Positions/
PSSM_ExecutiveSummary.pdf.
Nordin, N., Tengah, K., Shahrill, M., Tan, A., & Leong, E. (2017). Using visual representations as an alternative in teaching simultaneous equations. Paper presented at the Proceeding of the 3rd International Conference on Education, Kuala Lumpur, Malaysia. doi:10.17501/icedu.2017.3121.
Office of the National Education Council. (2004). Education in Thailand 2004. Bangkok: Amarin Printing and Publishing Public Company Limited.
Özsoy, G., Kuruyer, H., & Çakiroglu, A. (2015). Evaluation of students’ mathematical problem solving skills in relation to their reading levels. International Electronic Journal of Elementary Education, 8(1), 113–132. Retrieved from https://files.eric.ed.gov/fulltext/EJ1078853.pdf.
Pearce, D., Bruun, F., Skinner, K., & Lopez-Mohler, C. (2013). What teachers say about student difficulties solving mathematical word problems in grades 2-5. International Electronic Journal of Mathematics Education, 8(1), 3–19. Retrieved from http://www.iejme.com/makale/79.
Peltier, C., & Vannest, K. (2017). Using the concrete representational abstract (CRA) instructional framework for mathematics with students with emotional and behavioral disorders. Preventing School Failure, 1–10. doi:10.1080/1045988X.2017.1354809.
Phonapichat, P., Wongwanich, S., & Sujiva, S. (2014). An analysis of elementary school students’ difficulties in
mathematical problem solving. Paper presented at the 5th Conference on Educational Sciences. Amsterdam: Elsevier. doi:10.1016/j.sbspro.2014.01.728.
65
Rasmussen, C., & Bisanz, J. (2005). Representation and working memory in early arithmetic. Journal of Experimental Child Psychology, 91(2), 137–157. doi:10.1016/j.jecp.2005.01.004.
Siew, N., Chong, C., & Abdullah, M. (2013). Facilitating students’ geometric thinking through van Hiele’s phase-based learning using tangram. Journal of Social Sciences, 9(3), 101–111.
doi:10.3844/jsssp.2013.101.111.
Stern, E. (2009). Development of mathematical competencies: Source of individual differences and their developmental trajectories. In W. Schneider & M. Bullock (Eds.), Human development from early childhood to early adulthood (pp. 221–238). New York: Psychology Press.
Stylianou, D., & Silver, E. (2004). The role of visual representations in advanced mathematical problem solving: An examination of expert–novice similarities and differences. Mathematical Thinking and Learning, 6(4), 353-387. doi:10.1207/s15327833mtl0604_1.
Stylianou, D. (2010). Teachers’ conceptions of representation in the context of middle school mathematics.
Journal of Mathematics Teacher Education, 13, 325–343. doi:10.1007/s10857-0109143-y.
Stylianou, D. (2011). An examination of middle school students’ representation practices in mathematical problem solving through the lens of expert work: Towards an organizing scheme. Educational Studies in Mathematics, 76, 265–280. doi: 10.1007/s10649-010-9273-2.
van Garderen, D., & Scheuermann, A. (2015). Diagramming word problems: A strategic approach for instruction. Intervention School and Clinic, 50(5), 282-290. doi: 10.1177/1053451214560889.
van Garderen, D., Scheuermann, A., Poch, A., & Murray, M. (2016). Visual representation in mathematics: Special Education teachers’ knowledge and emphasis for instruction. Teacher Education and Special Education, 41(1), 7–23. doi:10.1177/0888406416665448.
van Lieshout, E., & Xenidou-Dervou, I. (2018). Pictorial representations of simple arithmetic problems are not always helpful: A cognitive load perspective. Educational Studies in Mathematics, 98, 39-55.
doi:10.1007/s10649-017-9802-3.
Vilenius-Tuohimaa, P., Aunola, K., & Nurmi, J. (2008). The association between mathematical word problems and reading comprehension. Educational Psychology, 28(4), 409–426. doi:10.1080/01443410701708228. Zahner, D., & Corter, J. (2010). The process of probability problem solving: Use of external visual