Issues
ISSN: 2146-4138
available at http: www.econjournals.com
International Journal of Economics and Financial Issues, 2019, 9(4), 137-147.
Public Debt and Stability in Economic Growth: Evidence for
Latin America
#1José Mauricio Gil León
1*, John William Rosso Murillo
2, Edgar Alonso Ramírez Hernández
31Department of Economic, Universidad Pedagógica y Tecnológica de Colombia, Tunja, Colombia, 2Department of Business
Administration, Universidad Pedagógica y Tecnológica de Colombia, Tunja, Colombia, 3Departament of Economic, Universidad de
Los Andes, Bogotá, Colombia. *Email: josemauricio.gil@uptc.edu.co
Received: 04 May 2019 Accepted: 08 July 2019 DOI: https://doi.org/10.32479/ijefi.8167
ABSTRACT
We study the effect of public indebtedness on economic growth in Latin American economies. Our main findings indicate that a Public Debt-GDP ratio of 75% leads to a deceleration in growth. On the other hand, a ratio of 35% increases the growth volatility. By using a Panel VAR we also found that external shocks, such as the foreign capital flows and the terms of trade, influence in the public debt effect on the economic growth. Clearly, the higher the level of public debt, the more vulnerable the economy can be in the short term; however, in the long term the growth is relevant for fiscal sustainability.
Keywords: Public Debt, Economic Growth, GDP Volatility, Macroeconomic Stability, Current Account
JEL Classifications: E60, E62, H63, O47
# This work was supported by the Universidad Pedagógica y Tecnológica de Colombia, project number 2110 of Vicerrectoría de Investigación y Extensión.
1. INTRODUCTION
There is no doubt that the level of public indebtedness is a current policital debate, not only for developed countries, but also for emerging economies. From an academic point of view, there are several different positions. An important one is Reinhart and
Rogoff (2010), who analized 44 countries and found that higher debt levels (above 90%) were linked to episodes of low growth (even negative values of GDP); therefore, public debt is a source
of macroeconomic vulnerability. Public debt has been one of the
key variables explaining the economic growth after the financial crisis of 2008.
Recent literature relates high levels of indebtedness with scenarios
of high growth volatility. Pescatori et al. (2014) states that monetary and fiscal policies turn public debt into a determinant of the output gap. Likewise, Hausmann and Panizza (2011) points
out that debt, particularly such in foreign currency, produce a lack of response to external shocks and to variations in growth. In this paper, we empirically evaluate the relationship between the level of public debt and the stability of economic growth for eight countries in Latin America (Colombia, Peru, Chile, Argentina,
Mexico, Brazil, Ecuador and Bolivia), from 1990 to 2015.
Our contention relies on the debt overhang hypothesis (Sachs,
1988), according to which private investment is the channel of
interaction between public debt and economic growth. Sachs argues that an increase in the amount of public debt is a future tax; it discourages private investment, and as consequence economic growth drops and macroeconomic vulnerability increases.
However, it is important to mention that the level of public debt
that affect economic growth depends on the country. Financial conditions and the risk of the economy determine the capacity of indebtedness. For example, in emerging economies debt
intolerance implies that level of public debt relative to GDP is
lower than the one at advanced economies (Reinhart and Rogoff,
2010; Reinhart et al., 2003).
Our main contribution is an illustration of the relationship between public debt and economic growth in Latin America emerging countries. We are able to estimate the average threshold
that identifies the turning point of economic growth due to the
indebtness level. We also describe the dynamics of the relationship
between the public debt to GDP ratio and stability of economic
growth. In this regard, we estimate the role of external shocks on
economic growth by current account to GDP ratio channel.
The rest of the paper is organized as follows. In section two, we
review the literature regarding the relationship between public debt, economic growth and macroeconomic vulnerability in developed and emerging economies. In the third section, we
explain our methodology and outline some stylized facts. In the fourth section, we discuss our main findings. Finally, in the fifth
section, we conclude.
2. LITERATURE REVIEW
There are several empirical tests carried out in order evaluate the link between sovereign debt and economic growth, according
to the literature in debt overhang hypothesis (Baum et al., 2013; Jacobo and Jalile, 2017; Siddique et al., 2016; Ward et al., 2002). Most researches have focused on looking at the relationship of
groups of countries that have used extensive time series and those that have experienced the nonlinear effect of debt on growth. Likewise, a different group of papers use panel data econometric techniques. In sum, the hypothesis states that low levels of debt
have a positive influence on growth; however, after certain level
of debt, the effect becomes negative and precipitates decline in
economic growth. Such findings have enabled an estimation of
optimal levels of indebtedness, even controlling by the use of variables derived from the debt-growth relationship.
Other authors have conducted empirical studies for specific countries; for example, Borensztein (1990) in Philippines; Ojeda and Montes (2003) and Salamanca and Monroy (2009) in Colombia; Mitze and Matz (2015) in Germany; Spilioti and Vamvoukas (2015) in Greece; Lartey et al. (2018) in African countries; and Bal and Rath (2014) in India. These findings
indicate a non-linear relationship between optimal public debt
and economic growth. In the case of Malaysia, Baharumshah et al. (2017) establish a threshold of the debt to GDP ratio around
54.71%, which does not affect economic activity.
Research eximining either groups of countries or specific cases, ratify the hypothesis of debt overhang. Most of the studies use explanatory variables such as private investment, the primary fiscal deficit, the real interest rate, the degree of economic openness, the
terms of trade, the unemployment rate and the rate of population
growth. The study conducted by Woo and Kumar (2015), which
uses a database of 38 advanced and emerging economies between
1970 and 2007, found that high levels of public debt have an impact on economic growth. This can be explained by the fact that a 10%
increase in the ratio of public debt to GDP reduces GDP per capita by 0.2% per year. However, in advanced economies this impact is lower (0.15%). Likewise, in terms of thresholds, a debt level of around 90% of the GDP has a negative effect on economic growth.
Within the empirical results, it is important to mention the work
of Fincke and Greiner (2014), since they focus on emerging economies. Through the estimation of a model of fixed and random
effects, they found a positive relationship between public debt and economic growth. This is due to the fact that emerging economies undergo expansions in public spending related to infrastructure and high rates of growth. The main explanation for the result is
that the proportion of public debt to GDP is higher in advanced
economies than in emerging economies.
However, Cordella et al. (2005) suggest that in countries with high
levels of indebtednes, there is a negative relationship between the
ratio of debt to GDP and to growth. Nevertheless, this is not the
case in countries with low or extremely high levels of debt. This behavior depends on given characteristics of the country such as better institutions, better policies, and ease of access to private capital. The conclusions are consistent with the results of Calderón
and Fuentes (2013) study, which examined several economies between 1970 and 2010, and note that the quality of institutions, the development of the financial market and the level of GDP per
capita can improve the negative impact of the debt on growth.
In contrast, in their study, which uses instrumental variables and
corrections for endogenity, Panizza and Presbitero (2014) state that there is not enough statistical evidence to confirm a causal effect
between debt and growth in advanced economies. In addition, these authors suggest that in the case of developing economies, public debt could have a negative effect on economic growth as
the hypothesis of debt overhang suggests (Sachs, 1988).
Another important element is taken up by Chudik et al. (2015). Their study used an unbalanced panel of 40 countries between 1965 and b2010 and threshold effects tests. It showed the level of
debt tolerance for growth, taking into account that the trajectory of long-term debt can affect the latter. For this reason, countries with increases in their debt have low growth rates.
The empirical evidence aims to establish a threshold of public debt related to low growth rates, as shown in the different works cited. Likewise, the most well-known approach to the debt
overhang hypothesis is that of Sachs (1988). Using this approach, authors such as Reinhart et al. (2012) identified 26 episodes of
debt overhang in advanced economies where the level of debt as
a proportion of GDP was over 90%.
Nonetheless, Baum et al. (2013) found that the positive impact
of the debt has no effect after 67% in a study taking 12 countries
of the euro zone and using a threshold panel methodology. They point out that growth is negatively affected when the debt to GDP ratio is around 95%. In other studies, the influence of public debt
has been controlled by other indicators. For example, Pattillo and
Similarly, the exercise was carried out for 93 developed economies
and it was found that the debt to GDP ratio between 30% and 40%
has a negative effect on economic growth.
On the other hand, although the hypothesis of debt overhang is the most accepted, the studies previously discussed focused largely on the causal behavior of debt towards growth, but have not explored the effects and channels that produce the relationship
mentioned. Poirson et al. (2004) point out that the channels through
which debt can affect growth are mainly the accumulation of capital and the productivity of the factors. In their work different econometric techniques are used (OLS, instrumental variables,
fixed effects, the MMG, among others) using a database for 61
developed economies from 1969 to 1998. The main results show that a third of the contribution to economic growth occurs through the accumulation of physical capital and two thirds through the increase in factor productivity.
With these results, it is evident that there is no general consensus on the causal relationships between debt and growth and,
according to Panizza and Presbitero (2013), it is necessary to
consider the heterogeneity of the countries. That is, not only should the relationships between their economies be considered, but the internal conditions in each country. It is also necessary to distinguish the effects of non-linearity and the asymmetry on the effects of debt and economic growth in the short and long
term. The studies by Chang and Chiang (2012) have considered
heterogeneity between countries, distinguishing between long and short term effects through panel smooth econometric techniques. In addition, they point out how a certain economic policy position
(e.g., institutional factors) can affect the performance of the
economy.
In contrast, regarding public debt as a factor of macroeconomic vulnerability can allow us to elucidate new elements in the discussion of debt and growth; this can help to understand what
it represents in situations of financial crisis. In this respect, Pescatori et al. (2014) point out that high levels of public debt are related to increases in GDP volatility, measured as the deviation
of the output gap. They established that after 56% debt, countries tend to experience high volatility. According to the authors, the
relationship can be explained by fiscal and monetary policy decisions, such as fiscal consolidations or short-term increases in inflation, events induced by high amounts of debt that increase the
output gap. Another aspect that demonstrates how public debt can be translated into product volatility is presented in Eichengreen
and Hausmann (2005) and in Hausmann and Panizza (2011), who
point out that debt in foreign currency can be correlated with variation in growth. Therefore, it may decrease a country’s ability to implement countercyclical policies; this leads to increases in volatility and reductions in growth.
Regarding the analysis using the VAR panel methodology, we
can find the studies carried out for Nigeria by Onafowora and Owoye (2017) where, through the estimation of a structural
VAR, they manage to capture the negative long-term effects of the external debt on growth. Through a decomposition analysis of the structural variance we ratify what is found in the impulse
response functions. On the other hand, Täuscher and Abdelkafi (2018) use the structural vector error correction model and the
causality of granger to end the bidirectional causality between economic growth, public debt and monetary policy in the case of Tunisia. Among its main results are the independence between these variables, and in turn, increases in public debt can have
effects on inflation expectations and macroeconomic volatility. Saad (2012) examines this relationship for the case of Lebanon,
the causality between service to external debt, growth and exports,
based on a VECM model and Granger’s causality analysis. Within
its results it shows the bidirectional relationship between debt and growth, the causality from public debt to exports, as well as these towards growth and the causality of the exchange rate on economic growth.
In constrat, for Alfonso et al. (2018) public debt has a positive
effect on the growth of the particular product linked to high financial stress scenarios. Likewise, using a threshold VAR
determines a negative effect on growth due to a crisis of financial stress, where as a result the fiscal situation worsens. Similarly, in the case of Switzerland in the period of 1894-2014, Guex and Guex (2018) find that it had no effect on economic growth and
did not increase long-term interest rates.
3. DATA AND STYLIZED FACTS
3.1. Collection of Data
In order to identify the role of public debt in macroeconomic stability we gathered data from the World Bank data index,
corresponding to eight countries: Brazil, Mexico, Chile, Colombia, Argentina, Ecuador, Bolivia and Peru or a time span from 1990 to 2015. Selected countries are emerging economies exposed to external shocks such as: outflows of capital, deterioration in terms
of trade and the effect of crises in advanced economies. Variables
used and the messurement method are summarized in Table 1.
The economic growth of the selected countries was 3,7% in average for the referred period. The minimum registered growth
was for Argentina in 2002 (during recession), as well as the
maximum value in 1991 (Table 2). On the other hand, public debt as proportion of GDP shows high variance, with a mean
of 37.8% during the period, and a maximum value for Peru in
1990 (177.9%).
These countries have notable differences in public debt, perhaps due to their own policies in macroeconomic adjustment. Chile
shows lowest level (around 20% of GDP in 90’s and below such level for successive periods). On the other hand, Brazil has the highest public indebtedness in Latin America, above 50% of GDP. However, during political and economic instability, some countries
have presented higher levels of indebteness, e.g., ecuador, bolivia
and peru, which ones exceeded 50% of GDP during 90’s.
For the next decade (2000-2009) the level of indebtedness raised
for some countries, probably as a reaction to different crises at the
end of the 90’s and the beginning of the 21stcentury (Figure 1).
Argentina is a good example, while Bolivia, Brazil and Colombia
3.2. Stylized Facts
Several economic crises occurred at the end of the 90’s and at the beginning of the first decade of the 21st century in emerging
economies. Evidence shows that the public debt rose considerably in that period, and it is a source of macroeconomic vulnerability.
High levels of indebtedness led to a need to refinance the debt and a search for external resources to cover account deficits. A good example of such financial vulnerability were Argentina’s default in 2002 and, in the same year, the closing of the Brazilian market for new debt placements (Frenkel, 2003).1
The level of public indebtedness stabilized after 2002, at the same
time that economic growth in the emerging economies increased.
Such recovery was explained by the boom in capital inflows to
emerging countries and stability in macroeconomic indicators
(Banco de la República, 2013). However, there was a rough drop in growth in 2008 and 2009, due to the international economic crisis; this period was characterized by an increase in volatility of
revenues in foreign currency, which reduced with lesser exports
and lower inflow of capital flows. Investor uncertainty for both
1 According to Ocampo et al. (2014) the increase in public debt in emerging countries at the end of the 1990s occurred in an environment in which countries could not borrow in local currency and it was necessary to resort to financing in dollars, which would be recognized as “original sin.”
foreign and domestic markets also increased. Undoubtedly, the rising of the level of public debt was a symptom of macroeconomic vulnerability.
We compared the growth of the countries according to their level
of debt as proportion of GDP (Figure 2), by using three categories: countries with debt levels below 30%, between 30% and 60% and between 60% and 90%. Between 72% and 74% of the time, the first
and second categories exhibited higher growth than countries of
the third category. However, when comparing the average growth of countries of the second category relative to the first one, there
Table 1: List of variables used
Variable Measurement
gdp_growth Annual GDP variation rate at constant 2010 prices
var_gdp_growth Variance of the annual GDP variation of each of the countries, defined as the square of the difference between the growth rate of GDP in each year and the average growth between 1990 and 2015 in each country
pubdebt_to_gdp Public debt of central governments with respect to annual nominal GDP privextdebt_to_gdp Relationship between private external debt and nominal GDP in dollars gcf_to_gdp Gross capital formation with respect to GDP at constant prices Inflation Annual inflation rate of each country
ca_to_gdp Current account in local currency with respect to GDP trade_terms Index of terms of trade of each country scaled in 2010=1
real_interest Difference between the nominal interest rate minus the rate of inflation fdi_net Foreign direct investment in local currency with respect to nominal GDP gdp_pc Natural logarithm of the GDP in relation to the population in dollars PPA Source: World Bank data
Table 2: Descriptive statistics
Variable Obs Mean±Standard
deviation Min. Max.
growth_gdp 208 0.0367±0.0338 −0.1089 0.1267 debtpub_to_gdp 205 0.3783±0.2555 0.039 1.7790 debtprivext_to_gdp 206 0.2452±0.2104 −0.5060 0.8430 gcf_to_gdp 208 0.2051±0.0358 0.1102 0.2847 inflation 206 1.0121±6.1400 −0.0117 74.8166 ca_to_gdp 208 −0.0150±0.0352 −0.0946 0.1213 trade_terms 208 0.7825±0.1917 0.3577 1.1809 real_interest 204 0.1415±0.1749 −0.2337 0.7762 gdp_pc 208 8.6374±0.5991 7.2139 9.6096 Source: Own calculations with data from the World Bank
Source: Own calculations with data from the World Bank
is no difference2. Therefore, in the relationship between debt and
growth, there is a threshold of public debt that leads to a lower growth of the economies.
External shocks are a source of macroeconomic vulnerability in
Latin America, due to periodical current account deficits and, then, the dependence on external financing. This problem is related
to a low level of savings. Therefore, an increase in public debt
implies greater demand for external financing. In such cases, this
phenomenon absorbs domestic savings; therefore, the correction of the current account obeys to a contraction of economic activity.
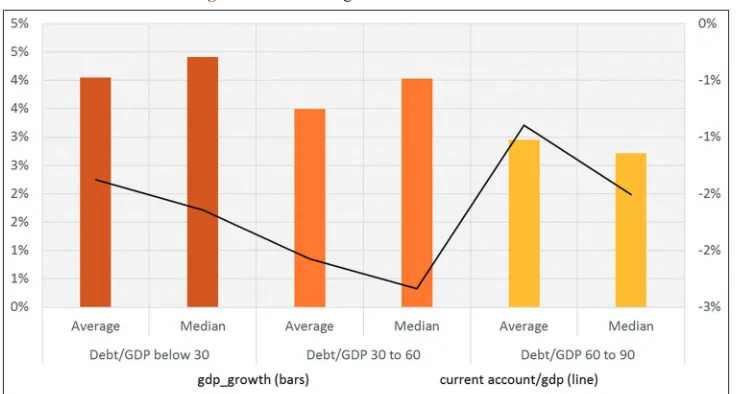
Figure 3 shows the relationship between public debt, economic growth and current account. Countries with public debt lower than
30% (random threshold), have higher growth relative to higher levels of debt. Moreover, the current account tends toward deficit, which implies higher inflows than outflows of capital. On the other hand, the current account reaches its maximum level of deficit
2 51% of the time the growth is greater when the debt level is lower than 30% relative to debt levels between 30% and 60%, so 49% represents the opposite situation; thus, no negative effect can be shown.
when public debt is between 30% and 60%, and there is evidence of increasing volatility. From a threshold of 60% (i.e., Maastricht criterion), the capital flows diminish and the current account raises.
Accordingly, a high level of public debt reduces the growth and
causes a contraction in foreign financing. This is the reason why
macroeconomic vulnerability occurs in environments of high
public debt, in line with Tirole (2006) for firms.
Results are consistent with contentions of Reinhart and Reinhart
(2008), who state that a bonanza of capital flows are antecedents to
economic crises. This is why crises have a V shape behavior in the
current account. The growing current account deficit is explained by an expansion in capital flows. However, when these flows
recede, there is an improvement of the current account because the aggregate demand becomes weak.
Our hypothesis is that high public debt causes greater
macroeconomic vulnerability; it is possible to find a relationship between capital flows and economic growth at different ranges of the public debt to GDP ratio. Therefore, foreign financial
restrictions increase the public debt making economic growth
Source: *Average economic growth and the debt to GDP ratio of the eight countries of Latin America. Own calculations with data from the World Bank
Figure 3: Economic growth and current account
Source: *Average economic growth and the debt to GDP ratio of the eight countries of Latin America. Researcher calculations with data from the World Bank
unstable, which is why there is a threshold in the emerging economies of Latin America.
4. ECONOMETRIC ANALYSIS
4.1. Panel Data
Growth models usually involve the accumulation process of production factors and technical progress. However, fluctuations
of economy in the mid term are determined by the process of accumulation of factors such as capital, and also by rigidities in
the economy, such as financing restrictions. In this line, variables such as the level of indebtedness, the inflation and the real interest
rate are relevant to understand the dynamics of growth.
We use the following equation in order to explain economic growth non-linearly by using public debt:
gdp growth to pubdebt to GDP
pubdebt
_ _ _ _ _
_
it = +α θgcf gdpit+β it+
β
1
2 tto GDP
gdp growth _
_
it it n
n it i it
X
2+ +
+
∑
−γ
δ µ
(1)
Where β1 is the first moment of the effect of public debt on GDP,
and β2 is the second one. An opposite sign of β1 and β2 is evidence of a curvature in such relationship. A non-linear relationship is
expected, as shown by Cecchetti et al. (2011); Checherita-Westphal and Rother (2012); Panizza and Presbitero (2013). Non-linearity
is supported by the debt overhang arguments stated by Krugman
(1988); Sachs, (1988) and Reinhart and Rogoff (2010), when defining a debt threshold that leads to a decline in growth. The
hypothesis of a non-linear relationship between growth and public debt, supports that high levels of public debt as a proportion of
GDP leads to a relatively less stable economy.
In order to determine the threshold of the public debt, we use the derivative of the growth with respect to the public debt:
∂
∂ =
gdp growth pubdebt to GDP
_ _ _
it it
0
It means that:
β β12
2
is the highest level of debt that causes a deceleration of GDP; it is
called the debt level threshold. In this sense, the hypothesis states that β1 > 0 and β2 > 0.
In our base model, the economic growth (GDP) is determined by the investment in a magnitude θ. We assume that financial constraints
depend on each country’s debt conditions; thus, public debt has a
positive effect on growth under a sustainable and confident fiscal environment. In this case, investment is able to be financed by
current expenditure as well as by government expenditure. When
Government increases the level of indebtedness, the availability of sources of private sector finance is reduced and it generates an
unconfident environment for investors. Such conditions create financial constraints with several adverse consequences. Tirole (2006) states that high leverage ratios are connected to falling
asset prices and low investment and economic activity.
We select control variables (Xit) discussed in the literature to
explain medium-term economic growth, as follows:
• Private external debt relative to GDP explains the pressures
exerted by external payments according to a country’s income
(Ward et al., 2002). Therefore, the sign will define the role of restrictions in foreign currency (Cohen and Sachs, 1986). • High inflation in emerging economies creates uncertainty,
thus the relationship with economic growth is negative. This
is in line with Barro (2013, 1995); Guerra and Dorta (1999); Khan and Ssnhadji (2001); Pollin and Zhu (2006); Uribe (1994). Therefore, price stability is related to the stability of
economic growth.
• The real interest rate has a negative effect on economic growth
due to its effect on the consumption and investment decisions
of the agents in an economy (Albu, 2006).
• The terms of trade of Latin American countries have a positive influence on economic growth, since their exports
are concentrated in commodities and are exposed to cyclical
prices (Mendoza, 1997).
• According to the theory of convergence, if within a group of countries, there is one with a per capita GDP greater than
those of the other countries, its economic growth will be lesser
and the coefficient in the equation should be negative (Quah, 1996).
We focus on estimating the relationship between government debt
to GDP ratio and the stability of growth. We build an unbalanced
panel data (where t the year and i is the country), which allows us to analyze the non-linear average effect of debt levels on variables
associated with macroeconomic stability (such as economic
growth and growth volatility). We examine the selected countries
from a cross-sectional and time series approach. We include a non-linear relationship between the level of debt and economic growth
(equation 1). The unbiased and consistent coefficients allow us to measure a level of debt that is defined as a threshold.
An additional estimation identifies the role of public debt levels in
the volatility of growth. The hypothesis is that an increase of public
debt reduces the volatility of growth. If financial markets agents are funding the fiscal deficit then investors prefer to carry out their projects, only under a confident fiscal environment, promoting
a stable growth. Nevertheless, if thereshold is overpassed, this situation could lead to a greater volatility of economic growth. Consequently, the estimated level of debt determines the turning
point of GDP volatility, considered as the point of growth
vulnerability. The equation to estimate is:
vargdp growth pubdebt to GDP pubdebt
to GDP _ _ _ _ _ it it it = + + + α γ
δ1 δ2
2
nnXit+µit
In Pescatori et al. (2014) and Godoy and Malone (2016), the
using the fixed effects method and deduce the level threshold of
public debt by:
pubdebt to GDP_ _ it = δ δ12
2
At lower levels, when public debt increases volatility decreases.
However, when the threshold is reached, volatility increases and
debt also does. We assume δ1 < 0 and δ2 > 0. Our control variables are: Foreign direct investment (FDI), the current account with respect to GDP and the GDP per capita. The first two variables
are associated with external shocks.
4.2. Panel VAR
The panel data VAR methodology combines the traditional VAR approach, which treats all the variables in the system as endogenous, with the panel-data approach, which allows for unobserved individual heterogeneity. The general form of our model is:
Yit =Γ0+Γ1Yit j− +Ci+ +Tt it (2)
Where Yit is a vector of three variables: gdp_growth (growth of
GDP), pubdebt_to_GDP (public debt as a proportion of GDP) and Current account to gdp (that counts for external shocks).
Fixed effect in the model, denoted Ci, captures all unobservable time-invariant factors at a country level, which is important for our purposes. Panel data allows common time effects, Tt, which are added to model to capture any global macroeconomic shocks that
may affect all countries in the same way (Love and Zicchino, 2006).
Fixed effects presents an estimation challenge, due to the lags of the dependent variables; correlation problems are corrected with
mean-differencing procedure, but it produces biased coefficients. To avoid this problem, we use a generalized method of moments
system, in order to use lagged regressors as instruments and
estimate the coefficients (Love and Zicchino, 2006).
The VAR system evaluates the shock impact of one variable on another variable, while keeping all other variables constant
(orthogonal shocks). The impulse response functions describe
the reaction of one variable to the innovations in another variable
within the system, while holding all other shocks equal to zero (Hamilton, 1994).
In the identification process we adopt the following recursive
ordering:
current account to gdp→pubdebt_to_gdp → gdp_growth or current account to gdp → gdp_growth → pubdebt_to_gdp
We place the current account at the very beginning of the ordering
because external shocks affect government financing and, then, to
economic growth3. When economic growth determines the size of public debt, there is a problem of fiscal sustainability (negative relationship of growth to debt).
3 It refers to the identification of the relationship between public debt and
macroeconomic vulnerability
We define three types of shocks: (1) The demand shock due to economic growth; (2) The fiscal shock for the public debt; and (3) The external shock by the current account. The role of shocks is analyzed with impulse response functions, and we provide an estimate of their confidence intervals. We generate the confidence
intervals for impulse responses using monte carlo simulations.
5. RESULTS
5.1. Relationship between Public Debt and Growth
Table 3 shows the results of three estimations: (1) The determinants of growth without considering public debt; (2) The inclusion of a linear form of public debt; and (3) The non-linear relationship
between public debt and growth. The specification of the model improves in the third estimation, because the correlation between the explanatory variables and the error reduces and the
determination coefficient increases. In the first estimation, the coefficients are over-estimated with respect to the third one; in
the second estimation, the linear form of the public debt is not
statistically significant, while the inclusion of the non-linear form in statistically significant.
From third estimation, an increase in the level of public debt
as a proportion of GDP leads, initially, to a higher growth, but
after a certain level of indebtedness growth becomes weaker and macroeconomic vulnerability appears (Table 3). In that sense, for each 1% of increase of debt participation on the GDP, the growth is 0.055% higher, and with the same squared variable, it is reduced 0.0366%.
The estimated threshold of the ratio of public debt to GDP for
economic growth is 75.45%; hence, after this level, the higher the debt the lower the growth. Consequently, there is evidence on the non linear relationship between public debt and growth. Levels of public debt above 75% deteriorates the economic growth. Then, Latin American countries are more fragile than developed countries; in spite of the fact that the latter have higher proportions
of public debt over the GDP (Reinhart et al., 2012).
The effect of the capital accumulation process indicates that a
1% of increase in the participation of the investment in the GDP produces a 0.423% of increase in economic growth. Therefore,
investment is the most relevant variable to explain growth of these countries. In addition, real interest rate have a negative effect on
GDP (consistent with the IS-LM model). Inflation has a negative
relationship with growth; there is an adverse effect of high levels
of inflation (some economies under analysis had inflations above 100% in the 90’s, even hyperinflations).
On the other hand, greater external financing needs of the private
sector have a negative effect on growth, determining vulnerability conditions due to its negative sign. Regarding the terms of trade, they are relevant for the formation of the economic cycle of the countries, because they are exposed to shocks in the prices of commodities. Finally, the trend towards the convergence of Latin American economies and ceteris paribus is evident, given
the negative sign of the relationship between GDP per capita and
Our results provide evidence on the form that public debt affects
the GDP, even in a financial crisis. A direct measure of instability in economic growth is volatility (i.e., the variance), as determined
by a non-linear form of public debt (similar to the estimation [3] in Table 3). In this case, a threshold of public debt level is not found; instead, we find a point of public debt from which volatility
starts raising.
Public debt as a proportion of GDP reduces volatility, initially, but
after a threshold, volatility begins to increase (Table 4). In selected
Latin American countries, the level of public debt as proportion
of GDP consider that increases the volatility 34.7%. Therefore,
empirical results are consistent with our proposed hypothesis, and contrast with the threshold debt level for growth of 75%, from where it reduces growth. We estimate the point at which the debt begins to generate macroeconomic vulnerability with its associated
volatility, until it holds back growth (first data obtained). Then we
estimate the range of debt that generates instability.
FDI positively affects the volatility of growth. The arrival of this type of investment depends on the expectations of international investors and on favorable economic signs. It helps the economy to grow above the trend and viceversa (it is known as procyclicality
of the FDI). On the other hand, the current account as a proportion of GDP has a positive relationship with the volatility of economic growth. Thus, during periods of sudden reductions in net flows
of foreign capital, the current account tends to be positive and the macroeconomic vulnerability tends to increase. The current account is higher when a country force to reduce domestic demand
and causes an unexpected contraction of the economy. Finally, countries with a higer per capita income, reduce growth volatility.
5.2. Impulse Response Analysis
We start by identifying the statistical relationship between variables, through the granger causality test for the panel. At a
minimum level of significance of 10%, it follows that:
Table 3: Economic growth and public debt
Dependent variable: gdp growth Method: Fixed effects
Cross section: 8 countries Time series: 26 years Standard error ( )
Independent variables [1] [2] [3]
Constant 0.59045*** 0.57615*** 0.55229***
(0.1589) (0.15978) (0.1589)
Public debt to gdp 0.0097 0.05523**
(0.0106) (0.0252)
Public debt to gdp squared −0.0366**
(0.01846)
External private debt to gdp −0.0365*** −0.0379*** −0.03314**
(0.01313) (0.01323) (0.0133)
Gross capital formation to gdp 0.416*** 0.43446*** 0.42328***
(0.0814) (0.08377) (0.0833)
Inflation −0.0015*** −0.00162*** −0.00111**
(0.00038) (0.0004) (0.00048)
Trade terms 0.04012** 0.0385** 0.03864***
(0.01564) (0.01923) (0.0191)
Real interest rate −0.05121*** −0.05625*** −0.06386***
(0.01564) (0.0166) (0.0169)
gdp_pc −0.0757*** −0.0747*** −0.07283***
(0.0198) (0.0198) (0.0197)
R-squared 0.28 0.2832 0.2981
Corr (u, X)
Observations −0.8994202 −0.8970202 −0.8946202
***P < 0.01, **P < 0.05, *P < 0.1. Source: Reseacher calculations
Table 4: Economic volatility and public debt
Dependent variable: gdp growth variance Method: Fixed effects
Cross section: 8 countries Time series: 26 years Standard error ( )
Independent variables Coefficients
Constant 0.0169124***
(0.006202)
Public debt to gdp −0.0034665***
(0.001165) Public debt to gdp squared 0.0049998***
(0.0007865) Foreign Domestic Investment Net 0.0167783***
(0.0063683)
Current account to gdp 0.0100217***
(0.0035361)
gdp_pc −0.0018562***
(0.0007181)
R-squared 0.37
Corr (u, X)
Observations −0.584205
current account to gdp→pubdebt_to_gdp χ2:9.074
P: 0.011
gdp_growth→ pubdebt_to_gdp χ2:8.144
P: 0.017
current account to gdp→gdp_growth χ2: 8.326
P: 0.016
pubdebt_to_gdp→gdp_growth χ2:4.619
P: 0.099
gdp_growth→current account to gdp χ2:7.587
P: 0.023
Provided that there is consistency in the relationship between variables, we run a graphic analysis impulse-response. All graphs
show responses for the first 10 years and most of them, if not all, converge to zero in this time frame. The two lines on each side of the impulse-response represent a confidence level of 95%; we constructed them by using Monte Carlo simulations with 200
repetitions.
Figure 4 presents impulse responses for the sample of 8 economies.
Three types of shocks are identified: an external shock, a fiscal
shock and a demand shock. The positive external shock means the improvement in the balance of the current account and, at the
same time, the deterioration of the financial account. Given the
conditions of low savings level in Latin American economies we
denotes the reversion of the current account by a “sudden stop,” or a contraction, of domestic demand. The fiscal shock is the increase in public debt due to the higher level of fiscal deficit.
The demand shock is associated with unexpected variations of
GDP within the model.
Positive external shock causes almost an immediate increase in
government financing, in other words, an accumulation of public
debt. In the same year of the shock, public debt becomes negative,
either due to the lower access to foreign capital flows or to the
contraction in government spending (i.e., pro-cyclical stance of
fiscal policy). For instance, when public debt increases (if it is independent there is a positive fiscal deficit shock), the financing
restrictions become stronger and the cost of debt increases. As a result, the economic growth shrinks during 2 years after the increase of debt (the estimated threshold implies that after a
level of 75% public debt accelerates the decline in growth). In sum, the growth response to public debt converges to zero after
the 5th year.
External shock also negatively affects the economic growth (Figure 4), and 2 years later, the effect becomes positive, until the answer reaches zero (after 5 years). Certainly, there
is a short-term impact of the contraction in capital flows
(i.e., positive shock of the current account) on growth, due to lower external financing and the contraction of Foreign Investment (i.e., variables that affect the volatility of growth).
Therefore, there is evidence of sudden stops on macroeconomic stability in emerging Latin American economies after 2 years of shock the performance of the economy recovers, and the effects of the impulse disappear.
Figure 4: Impulse-response functions
From the point of view of the fiscal sustainability, the negative
effect of the demand shock on public debt is caused by a reduction
in the ratio between public debt and GDP, when the denominator (i.e., economic growth) increases faster than the real interest rate (associated with the risk premium of sovereign debt). However,
the important negative effect occurs after 5 years of the demand
shock, and disappears until 10 years after. The results allow us
to conclude that an increase in public debt makes growth more unstable in the short term; but in the long term, growth is necessary
for fiscal sustainability.
6. CONCLUSIONS
Emerging economies are unique because the influence of the
public debt level on growth is different from developed countries.
For the latter, debt levels above 90% of the GDP are problematic
for sustained economic growth, but in emerging countries, these levels do not exceed 75%. Then, after a certain level, public debt becomes a problem for macroeconomic stability. In this line, it is important to discover the public debt threshold that affects
growth. We estimate the level of public debt that defines maximum
growth, by assuming the hypothesis of debt overhang, and a non-linear relationship between economic growth and the level of public debt. In addition, we also identify the level at which the volatility of growth begins to increase and becomes a warning of macroeconomic vulnerability.
We confirm the consistency of the estimated threshold level of
public debt. Consequently, public debt levels of the economies are higher than those obtained in the estimates carried out; especially higher than the levels that lead to the increase in growth volatility. The volatility of growth increases with public indebtedness of
35% on the GDP. Based on the result indicated, the countries of Latin America starts being vulnerable and, therefore, the fiscal authority must establish mechanisms to reduce the level of deficit with respect to GDP.
The current account follows a trajectory according to fiscal
variables; economic crisis scenarios lead to the government’s
external debt having a greater impact on capital flows. In a
recession, sudden stops of foreign capital are common, making such impact more severe. In this sense, when public debt exceeds the threshold, the current account tends to increase, thus, the
capital flows outcomes increase as well. This is identified in the
estimated Panel VAR model, where the inclusion of the current
account is necessary to find a relationship between stability in
growth and public debt.
In Latin America, the level of public debt that stabilizes
economic growth is lower than that of developed countries, given that the debt capacity is lower (considering per capita
income). For foreign and domestic investors risk is higher.
Therefore, as long as countries advance in their economic development, this level can be higher and, in the same way, the level that leads to an increase in volatility (they are less unstable countries). The comparation between volatility in
growth between developed and emerging economies, is an open
research field for future studies.
REFERENCES
Albu, L.L. (2006), Trends in the interest rate-investment-GDP growth relationship. Journal for Economic Forecasting, 3(3), 5-13. Alfonso, A., Baxa, J., Slavík, M. (2018), Fiscal developments and
financial stress: A threshold VAR analysis. Empirical Economics, 54(2), 395-423.
Baharumshah, A.Z., Soon, S.V., Lau, E. (2017), Fiscal sustainability in an emerging market economy: When does public debt turn bad? Journal of Policy Modeling, 39(1), 99-113.
Bal, D.P., Rath, B.N. (2014), Public debt and economic growth in India: A reassessment. Economic Analysis and Policy, 44(3), 292-300. Banco de la República. (2013), Flujos de Capitales, Choques Externos
y Respuestas de Política en Países Emergentes. Bogota: Banco de la República Colombia.
Barro, R.J. (1995), Inflation and Economic Growth (No. W5326). National Bureau of Economic Research. Econ Papers.
Barro, R.J. (2013), Inflation and economic growth. Annals of Economics and Finance, 14(1), 121-144.
Baum, A., Checherita-Westphal, C., Rother, P. (2013), Debt and growth: New evidence for the euro area. Journal of International Money and Finance, 32, 809-821.
Borensztein, E. (1990), Debt Overhang, Debt Reduction and Investment: The Case of the Philippines. IMF Working Paper.
Calderón, C., Fuentes, J.R. (2013), Government Debt and Economic Growth. Inter-American Development Bank, IDB-Working Paper-424.
Cecchetti, S., Mohanty, M., Zampolli, F. (2011), Achieving growth amid fiscal imbalances: The real effects of debt. In: Economic Symposium Conference Proceedings.Vol. 352. Kansas City: Federal Reserve Bank. p145-196.
Chang, T., Chiang, G. (2012), Transitional behavior of government debt ratio on growth: The case of OECD countries. Journal for Economic Forecasting, 15(2), 24-37.
Checherita-Westphal, C., Rother, P. (2012), The impact of high government debt on economic growth and its channels: An empirical investigation for the Euro area. European Economic Review, 56(7), 1392-1405.
Chudik, A., Mohaddes, K., Pesaran, M.H., Raissi, M. (2017), Is there a debt-threshold effect on output growth? Review of Economics and Statistics, 99(1), 135-150.
Cohen, D., Sachs, J. (1986), Growth and external debt under risk of debt repudiation. European Economic Review, 30(3), 529-560.
Cordella, M.T., Ricci, M.L.A., Ruiz-Arranz, M. (2005), Debt Overhang or Debt Irrelevance? Revisiting the Debt Growth Link. International Monetary Fund. IMF Working Paper 05/223.
Eichengreen, B., Hausmann, R. (2005), Original Sin. Other People’s Money: Debt Denomination and Financial Instability in Emerging Market Economie. Chicago: University of Chicago Press. p266. Fincke, B., Greiner, A. (2015), Public debt and economic growth in
emerging market economies. South African Journal of Economics, 83(3), 357-370.
Frenkel, R. (2003), Globalización y Crisis Financieras en América Latina. Santiago: Revista de la CEPAL.
Godoy, J., Malone, S. (2016), Government Debt, Macroeconomic Growth and Volatility: A Global VAR Approach. Thesis Doctoral. Ch. 3. Guerra, J., Dorta, M. (1999), Efectos de la Inflación Sobre el Crecimiento
Económico de Venezuela. Serie Documentos de Trabajo, (20). Banco Central de Venezuela.
Jersey: Princeton University Press. p690-696.
Hausmann, R., Panizza, U. (2011), Redemption or abstinence? original sin, currency mismatches and counter cyclical policies in the new millennium. Journal of Globalization and Development, 2(1), 1-35. Jacobo, A.D., Jalile, I.R. (2017), The Impact of Government Debt on
economic Growth: An Overview for Latin America (No. 28/2017). Working Paper, Università di Perugia, Dipartimento Economia. Khan, M.S., Ssnhadji, A.S. (2001), Threshold effects in the relationship
between inflation and growth. IMF Staff Papers, 48(1), 1-21. Krugman, P. (1988), Financing vs. forgiving a debt overhang. Journal of
Development Economics, 29(3), 253-268.
Lartey, E.Y., Musah, A., Okyere, B., Yusif, A.N. (2018), Public debt and economic growth: Evidence from Africa. International Journal of Economics and Financial Issues, 8(6), 35-45.
Love, I., Zicchino, L. (2006), Financial development and dynamic investment behavior: Evidence from panel VAR. The Quarterly Review of Economics and Finance, 46(2), 190-210.
Mendoza, E.G. (1997), Terms-of-trade uncertainty and economic growth. Journal of Development Economics, 54(2), 323-356.
Mitze, T., Matz, F. (2015), Public debt and growth in German federal states: What can Europe learn? Journal of Policy Modeling, 37(2), 208-228.
Ocampo, J.A., Stallings, B., Bustillo, I., Velloso, H., Frenkel, R. (2014), La Crisis Latinoamericana de la Deuda Desde la Perspectiva Histórica. Santiago: CEPAL.
Ojeda-Joya, J.N., Montes-Uribe, E. (2003), Deuda Externa, Inversión y Crecimiento en Colombia, 1970 y 2002. Colombia: Banco de la República Documentos de Trabajo.
Onafowora, O., Owoye, O. (2019), Impact of external debt shocks on economic growth in Nigeria: a SVAR analysis. Economic Change and Restructuring, 52, 1-23.
Panizza, U., Presbitero, A.F. (2013), Public debt and economic growth in advanced economies: A survey. Swiss Journal of Economics and Statistics, 149(2), 175-204.
Panizza, U., Presbitero, A.F. (2014), Public debt and economic growth: Is there a causal effect? Journal of Macroeconomics, 41, 21-41. Pattillo, C., Ricci, L.A. (2011), External debt and growth. Review of
Economics and Institutions, 2(3), 30.
Pescatori, A., Sandri, D., Simon, J. (2014), Debt and Growth: Is there a Magic Threshold? International Monetary Fund Working Paper. No. 14-34. Poirson, M.H., Ricci, M.L.A., Pattillo, M.C.A. (2004), What are the
Channels through which External Debt Affects Growth? International
Monetary Fund Working Papers No. 4-15.
Pollin, R., Zhu, A. (2006), Inflation and economic growth: A cross-country nonlinear analysis. Journal of Post Keynesian Economics, 28(4), 593-614.
Quah, D.T. (1996), Empirics for economic growth and convergence. European Economic Review, 40(6), 1353-1375.
Reinhart, C., Rogoff, K., Savastano, M. (2003), Debt Intolerance NBER Working Paper No. 9908.
Reinhart, C.M., Reinhart, V.R. (2008), Capital Flow Bonanzas: An Encompassing view of the Past and Present. National Bureau of Economic Research Working Paper. No. 14321.
Reinhart, C.M., Reinhart, V.R., Rogoff, K.S. (2012), Public debt overhangs: Advanced-economy episodes since 1800. Journal of Economic Perspectives, 26(3), 69-86.
Reinhart, C.M., Rogoff, K.S. (2010), Growth in a time of debt. American Economic Review, 100(2), 573-78.
Saad, W. (2012), Causality between economic growth, export, and external debt servicing: The case of Lebanon. International Journal of Economics and Finance, 4(11), 134-143.
Sachs, J. (1988), The Debt Overhang of Developing Countries, in Debt, Stabilization, and Developments Essays in Memorr of Carlos. Oxford: Diaz Alejandro.
Salamanca, A., Monroy, V. (2009), Deuda externa pública e inversión en Colombia 1994-2007: Evidencia de un modelo no-lineal TAR. Cuadernos de Economía, 28(51), 205-243.
Siddique, A., Selvanathan, E.A., Selvanathan, S. (2016), The impact of external debt on growth: Evidence from highly indebted poor countries. Journal of Policy Modeling, 38(5), 874-894.
Spilioti, S., Vamvoukas, G. (2015), The impact of government debt on economic growth: An empirical investigation of the Greek market. The Journal of Economic Asymmetries, 12(1), 34-40.
Täuscher, K., Abdelkafi, N. (2018), Scalability and robustness of business models for sustainability: A simulation experiment. Journal of Cleaner Production, 170, 654-664.
Tirole, J. (2006), The theory of corporate finance. New Jersey: Princeton University Press.
Uribe, J.D. (1994), Inflación y Crecimiento Económico en Colombia. Borradores de Economía. Colombia: Banco de la República. Ward, H.P., Ricci, L.A., Pattillo, C.A. (2002), External Debt and Growth.
International Monetary Fund Working Paper No. 02/69.