ISSN 2324-805X E-ISSN 2324-8068 Published by Redfame Publishing URL: http://jets.redfame.com
Is Teacher Professional Development an Effective Way to Mitigate
Teachers’ Gender Differences in Technology? Result from a Statewide
Teacher Professional Development Program
Yi Li
Correspondence: Yi Li, Faculty of Education, Southwest University, No.2 Tiansheng Road, BeiBei District, Chongqing, 400715, P.R. China
Received: October 8, 2015 Accepted: October 19, 2015 Online Published: October 21, 2015
doi:10.11114/jets.v4i2.1124 URL: http://dx.doi.org/10.11114/jets.v4i2.1124
Abstract
This study analyzed data from a statewide professional development (PD) program to investigate whether gender difference towards technology usage was mitigated after participation in the program. Teachers responded to pre- and post-questionnaires regarding their perceptions and use of technology before and after participating in PD courses. Findings showed (a) male teachers held more positive attitudes and confidence in using technology than did females; however, this difference became insignificant after the PD; (b) female teachers exhibited an enhanced level of integrating technology in the classroom after participation in PD courses, while males did not; and (c) no significant gender differences were found regarding lower-level use of technology (e.g., access to website, bookmarking). Results support previous findings (Zhou & Xu, 2007; Yildirim, 2000) that (a) technology experience is gender-based; (b) PD training can remedy gender differences in technology use in the classroom; and (c) differing needs of teachers, by gender, should be considered for future PD programs.
Keywords: teacher professional development, online training, gender difference
1. Theoretical Framework & Objectives
1.1 Existing Gender Differences
The rapid evolution of new technologies influencing education in the last two decades is changing the ways teachers are teaching and how students are learning. Teachers’ perceptions and attitudes towards these new technologies play important roles in the effective use of such technologies within the teaching and learning process (Groff & Mouza, 2008).
However, a large number of studies have documented teachers’ gender disparity in the perception and use of technology within different settings. For example, Zhou & Xu (2007) surveyed a large number of full-time faculty and instructors at a large Canadian university and found that females had lower confidence and less experience in using computers as a part of their teaching strategies. Yuen & Ma (2002) surveyed 186 pre-service teachers based on the framework of the Technology Acceptance Model and found that the level of perceived usefulness, perceived ease-of-use, and intention to use computers in the classroom was much lower for females than for male teachers. Markauskaite (2005) investigated gender differences in self-reported experiences to instructional and computer technology (ICT) use and ICT literacy among first-year teachers. Questionnaires were given to 151 female and 66 male teachers. In this study, the researcher found that male teachers tended to be more confident in their ability to use computers in the classroom than were female teachers. Zogheib (2006) investigated computer use among pre-service teachers related to experience with technology, demographic factors, motivation for use, personality factors and learning styles. Zogheib’s study utilized a mixed-method design collecting quantitative data via surveys and qualitative data via interviews. Data resulting from this study showed that female pre-service teachers used computers less than their male counterparts.
teachers may learn technology in different ways.
Campbell and Varnehagen (2002) surveyed 423 teachers at a large Canadian university and found that male teachers tended to learn technology skills before applying them to teaching, whereas females tended to focus on pedagogy before technology. In a similar vein, Zhou & Xu (2007) indicated that females tended to learn how to use technology from others, whereas males were more likely to learn from their own experiences.
The majority of research in pre-service and in-service teachers’ education related to technology use investigated female and male teachers’ technology anxiety and acceptance level of technology. Few studies, however, have addressed how gender differences related to in-service and pre-service teachers’ use of and attitudes toward instructional technology have been or could be changed through professional development.
1.2 The Statewide Professional Program
The professional development (PD) program is a web-based platform that supports summer face-to-face professional development sessions, through the establishment of academic year-long online learning communities. Trained facilitators monitor the online learning groups. Using an Internet platform, participants interact with their learning community members or with other learning community groups during the PD program. One of the goals of this project is to increase teachers’ use of technology in classroom instruction and increase students’ use of the Internet as a resource. The PD program is supported by the state.
1.3 Research Objectives
The purpose of this study is to examine how the professional development program affected females’ versus males’ perceptions toward technology as well as to compare teachers’ use and integration of technology in the classroom. The goal of the study was to provide data which supports the development and design of future technology training PD programs.
Specifically, the study explored: (1) whether there is gender difference in attitude, belief, and degree of confidence towards technology; and if so, whether the PD program helped mitigate this gap; and (2) whether there is gender difference in higher-level use of technology (e.g. integration of technology in the classroom) and lower-level use of technology (e.g. accessing of websites without specific teaching-oriented purpose); and if so, how the PD program helped change this situation.
2. Methods
2.1 Participants
In this study, data was collected by an external evaluator as part of the evaluation of the teacher professional development program (2011-2012). Data from the evaluation survey were collected from 1,020 teachers from public schools in the state. Survey sample included regular mathematics and science teachers and special education, resource, or inclusion teachers who taught at least one regularly scheduled class in Grades K-12. Excluded from the sampling were teachers’ aids, assistants, school or district administrators/ supervisors, and counselors. The gender ratios of female to male teacher respondents in pre- and post- survey are listed in Table 1.
Table 1. Percentages of Female vs. Male Participants
Pre-questionnaire Post-questionnaire
n Percent n Percent
Female 862 84.51 712 86.62
Male 158 15.49 110 13.38
2.2 Measures
Pre- and Post-Surveys were administered through the PD homepage. Participants completed the questionnaire as part of their first and final assignment for the course, across one academic year. Unique identifiers were used to link participants’ pre- and post-questionnaire responses. The pre-surveys were administered in August of 2011 and 2012. The post-surveys were administered in December of 2011 and 2012.
Cronbach’s alpha. Each response has been standardized with mean of zero and standard deviation of one in this analysis since responses are not consistent with one scale.
Table 2. Factors and Their Related Survey Questions
Factors Questions
Teachers' attitudes, belief and degree I am comfortable using technology to learn of confidence I am comfortable using the Web to learn and teach (Alpha=0.87) I value Web-based professional development
I have a good understanding of how to use technology effectively in the classroom Integration technology in classroom Use the Internet to find lesson plans
(Alpha=0.83) Use the Internet to find content references to enhance my lessons.
Use the Internet to find resources to help me teach topics that I am less prepared to teach. Use the Internet to find appropriate content
references for others (e.g., parents, guardians, tutors, etc.).
How many teaching related websites have you book marked on your Internet browser? Lower level use of technology Have you accessed the ORC website?
(Alpha=0.67) How frequently did you access the ORC website during the past school year? 3. Results
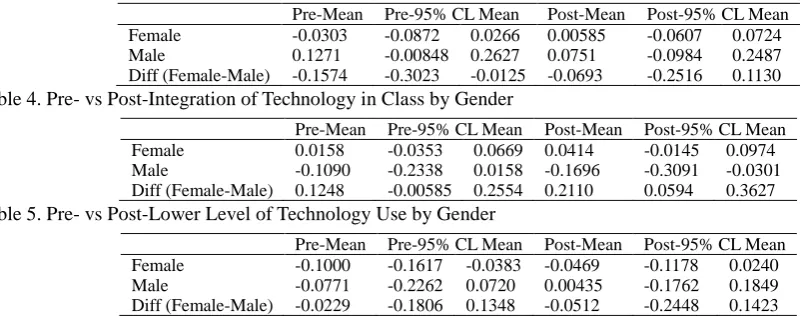
Mean scores and standard deviations of all the related survey items and their correlations are listed in the Appendices A and B. A significance level of p ≤ .05 was used in this study. Table 3 indicates that male teachers held a more positive attitude, belief, and higher amount of confidence towards technology use in the classroom than did females, initially. The standardized mean score for female teachers was -0.03, compared to 0.13 for males.. After the online training course, female teachers’ attitude towards technology increased from -0.03 to 0.006. The gap in technology attitude and degree of confidence between female and male teachers closed.
Table 4 shows that female teachers seemed to incorporate more technology in class than did male peers. At the beginning, female and male teachers reported utilizing the technology at the same level in their teaching. After the program, female teachers significantly exceeded male teachers in utilizing the Internet (a) to help find lesson plans, (b) to help find information about the content being taught, and (c) to help find materials or resources to use in the classroom. Females also were more likely to check out teaching related websites. The composite mean scores of female teachers’ pre- and post- survey responses were 0.02 versus 0.04, as opposed to -0.11 versus -0.17 for male teachers. Table 5 does not show any gender difference in lower-level technology use either before or after the PD program. One possible explanation is that the lower-level of technology use assesses whether or not teachers use a resource website but not “how” the website was used for teaching and learning. Also, this may not have been a goal of the PD program.
Table 3. Pre- vs Post-Technology Attitude and Confidence by Gender
Pre-Mean Pre-95% CL Mean Post-Mean Post-95% CL Mean Female -0.0303 -0.0872 0.0266 0.00585 -0.0607 0.0724 Male 0.1271 -0.00848 0.2627 0.0751 -0.0984 0.2487 Diff (Female-Male) -0.1574 -0.3023 -0.0125 -0.0693 -0.2516 0.1130 Table 4. Pre- vs Post-Integration of Technology in Class by Gender
Pre-Mean Pre-95% CL Mean Post-Mean Post-95% CL Mean Female 0.0158 -0.0353 0.0669 0.0414 -0.0145 0.0974 Male -0.1090 -0.2338 0.0158 -0.1696 -0.3091 -0.0301 Diff (Female-Male) 0.1248 -0.00585 0.2554 0.2110 0.0594 0.3627 Table 5. Pre- vs Post-Lower Level of Technology Use by Gender
Pre-Mean Pre-95% CL Mean Post-Mean Post-95% CL Mean Female -0.1000 -0.1617 -0.0383 -0.0469 -0.1178 0.0240 Male -0.0771 -0.2262 0.0720 0.00435 -0.1762 0.1849 Diff (Female-Male) -0.0229 -0.1806 0.1348 -0.0512 -0.2448 0.1423 4. Educational Importance of Findings
The professional development program successfully mitigated the gender difference in attitude and amount of confidence towards technology use for teaching purposes. The program also successfully introduced knowledge regarding how teachers integrate technology within their classrooms; helpful practices and experiences regarding how to improve female teachers' perceptions and self-confidence in using technology in the classroom; and on the continual support system provided to teachers during the professional development.
were reported by other researchers. Research conducted by Shashaani & Khalili (2001) showed that females admitted that they had little confidence in using technology for learning as compared to males. Literature suggests the reasons for such gender inequality in the use of technology. Joiner et al. (2011) indicated that gender inequality were due to socially construction. For example, some parents and teachers may believe technology should belong to male’s domain. So such misunderstanding may influence children on career choice and confidence in learning with technology.
The finding in of this study indicated that, after participation in the PD courses, female teachers not only improved their perceptions about technology but also were successfully provided with knowledge and experience in using technology for teaching. However, even though male teachers held more positive perceptions towards technology initially, they failed to gain as much as female counterparts regarding higher-level technology use in the classroom.
These findings resonate with Campbell and Varnehagen’s (2002) study. Based on several surveys, Campbell and Varnehagen claimed that male and female teachers may learn technology in different ways. Males tend to learn a technology first, and then consider its application in teaching, whereas females tended to start by focusing on instructional needs for integrating technology. In other words, female teachers considered the technology as an assistant for their pedagogy, while males focused on the technology itself. From this stance, Campbell and Vernehagen (2002) suggested different models of professional development for males and females. They argued that female teachers may prefer pedagogically-based training where relevant technologies are presented; while, males might prefer training featuring a technology where instructional practices are taught along the way. Similarly, Zhou & Xu (2007) recommended that professional development for females should involve more real-word connections and interactions between teachers and PD facilitators, while training for males would be more appropriate if it provided more hands-on activities.
5. Conclusions
This paper used data collected from an ongoing teacher professional development program to show that this type of professional development training program appears to benefit female teachers more than male teachers in terms of technology use in the classroom. Even considering that male students had more positive perceptions towards technology prior to and in the beginning of the PD program, the expectation is that they would still improve their skills to some degree regarding integration of technology in the classroom after participating in related PD training. The findings of this research recommend that a different focus in designing these types of professional development program may be warranted. That is, future PD program designs and corresponding curriculum should be developed to take into account the particular needs of female and male teachers in order to help facilitate equality and effectiveness in these types of PD programs.
6. Limitations
One limitation of this study is that it only involved analysis and findings from one state-level professional development program. Should a similar future study be conducted, it would need to synthesize findings from multiple professional development programs in order to reveal a better understanding of gender differences and male and female teachers' changes in perceptions and use of technology before and after PD programs. Moreover, another limitation is that this study used only the evaluation survey data. This survey only generally collected data on teachers' views of use of technology. This may have limited finding on the difference between general technology (e.g. Internet) and specific instructional technology (e.g. Blackboard) usage in the classroom. Future studies would need to consider more systematic and a more specifically designed set of data collection instruments which could assess gender difference issues in teacher professional development programs. Additional qualitative techniques, such as interviews and focus groups, can be used to explore other reasons why female student have less confidence in using technology for learning than do their peers. Then, the professional development programs have guidance to be designed in practice.
Acknowledgements
The research is supported by Chongqing Federation Social Science Plan Funds (2014BS120) and the Scientific Research Plan Funds for the Faculty of Education at Southwest University (2014YBXM20).
References
Campbell, K., & Varnhagen, S. (2002). When faculty use instructional technologies: Using clark’s delivery model to understand gender differences. The Canadian Journal of Higher Education, 32(1), 1-29.
Groff, J., & Mouza, C. (2008). A framework for addressing challenges to classroom technology use. AACE Journal,
16(1), 21-46.
Markauskaite, L. (2005). Exploring differences in trainee teachers' ICT literacy: Does gender matter? Proceedings of the 22nd ASCILITE Conference, Brisbane, Australia.
Shashaani, L., & Khalili, A. (2001). Gender and computers: Similarities and differences in Iranian college students’ attitudes toward computers. Computers & Education, 37(3), 363-375.
http://dx.doi.org/10.1016/S0360-1315(01)00059-8
Yildirim, S. (2000). Effects of an educational computing course on preservice and inservice teachers: A discussion and analysis of attitudes and use. Journal of Research on Computing in Education, 32(4), 479-495.
http://dx.doi.org/10.1080/08886504.2000.10782293
Yuen, H. K. A., & Ma, W. K. W. (2002). Gender differences in teacher computer acceptance. Technology and Teacher Education, 10(3), 365-382.
Zhou, G., & Xu, J. (2007). Adoption of educational technology: How does Gender Matter? International Journal of Teaching and Learning in Higher Education, 19(2), 140-153.
Zogheib, S. (2006). Explaining computer use among preservice teachers: Towards the development of a richer conceptual model incorporating experience, demographic, motivation, personality, and learning style clusters of variables (Unpublished doctoral dissertation). University of Windsor, Ontario, Canada.
Appendix A: Means & Standard Deviations of Related Items
PRE Questions N Mean St.d Min Max
Q1 Have you accessed the ORC website? 1045 0.7 0.46 0 1
Q2 How frequently did you access the ORC website during the past school year?
919 2.35 1.24 1 6
Q3 In my teaching, I use the Internet to find lesson plans. 1043 3.46 1.05 1 5 Q4 In my teaching, I use the Internet to find content references to enhance
my lessons.
1047 3.82 0.9 1 5
Q5 In my teaching, I use the Internet to find resources to help me teach topics that I am less prepared to teach.
1038 3.82 0.91 1 5
Q6 In my teaching, I use the Internet to find appropriate content references for others (e.g., parents, guardians, tutors, etc.).
1042 3.37 0.98 1 5
Q7 How many teaching related websites have you bookmarked on your Internet browser
1051 3.04 0.97 1 4
Q8 I am comfortable using technology to learn. 1051 4.15 0.76 1 5
Q9 I am comfortable using the Web to learn and teach. 1041 4.13 0.77 1 5
Q10 I value Web-based professional development. 1049 4.2 0.7 1 5
Q11 I have a good understanding of how to use technology effectively in the classroom.
773 3.9 0.78 1 5
POST
Q1 Have you accessed the ORC website? 900 0.99 0.12 0 1
Q2 How frequently did you access the ORC website during the past school year?
905 2.89 1 1 6
Q3 In my teaching, I use the Internet to find lesson plans. 906 3.54 0.98 1 5 Q4 In my teaching, I use the Internet to find content references to enhance
my lessons.
904 3.9 0.88 1 5
Q5 In my teaching, I use the Internet to find resources to help me teach topics that I am less prepared to teach.
902 3.87 0.91 1 5
Q6 In my teaching, I use the Internet to find appropriate content references for others (e.g., parents, guardians, tutors, etc.).
904 3.39 0.98 1 5
Q7 How many teaching related websites have you bookmarked on your Internet browser?
912 3.14 0.91 1 4
Q8 I am comfortable using technology to learn. 911 4.19 0.72 1 5
Q9 I am comfortable using the Web to learn and teach. 916 4.21 0.72 1 5
Q10 I value Web-based professional development. 913 4.27 0.65 1 5
Q11 I have a good understanding of how to use technology effectively in the classroom.
Appendix B: Pearson Correlation Coefficients
Number of Observations
Pre Post
Q1 Q2 Q3 Q4 Q5 Q6 Q7 Q8 Q9 Q10 Q11 Q1 Q2 Q3 Q4 Q5 Q6 Q7 Q8 Q9 Q10 Q11
pre
Q1 1 0.5 0.21 0.12 0.14 0.18 0.11 0.13 0.14 0.15 0.16 0.13 0.14 0.16 0.07 0.11 0.11 0.07 0.15 0.14 0.1 0.13 1045 912 1037 1041 1032 1036 1042 1043 1033 1041 767 824 828 829 827 825 827 834 833 838 835 828 Q2 0.5 1 0.25 0.18 0.16 0.19 0.17 0.1 0.09 0.17 0.13 0.11 0.51 0.17 0.15 0.17 0.14 0.16 0.12 0.14 0.2 0.11 912 919 911 915 908 910 916 918 910 916 669 724 729 728 729 725 728 732 732 736 734 726 Q3 0.21 0.25 1 0.62 0.63 0.54 0.31 0.22 0.25 0.21 0.2 0.04 0.2 0.61 0.4 0.42 0.38 0.29 0.16 0.22 0.21 0.16 1037 911 1043 1042 1034 1038 1040 1041 1031 1039 769 823 828 829 827 825 827 834 832 837 834 827 Q4 0.12 0.18 0.62 1 0.7 0.55 0.36 0.34 0.4 0.31 0.33 0.03 0.13 0.43 0.58 0.45 0.38 0.35 0.26 0.3 0.23 0.26 1041 915 1042 1047 1037 1041 1044 1045 1035 1043 770 827 832 833 831 829 831 838 836 841 838 831 Q5 0.14 0.16 0.63 0.7 1 0.57 0.33 0.27 0.32 0.27 0.24 0.03 0.13 0.47 0.49 0.54 0.39 0.31 0.25 0.28 0.23 0.2 1032 908 1034 1037 1038 1033 1035 1036 1026 1035 766 818 823 824 822 820 822 829 827 832 829 822 Q6 0.18 0.19 0.54 0.55 0.57 1 0.27 0.29 0.33 0.24 0.34 0.05 0.11 0.35 0.37 0.38 0.49 0.21 0.26 0.27 0.2 0.24 1036 910 1038 1041 1033 1042 1039 1040 1030 1038 766 824 829 830 829 826 828 835 833 838 835 828 Q7 0.11 0.17 0.31 0.36 0.33 0.27 1 0.26 0.25 0.18 0.23 -0.05 0.13 0.22 0.29 0.26 0.22 0.66 0.27 0.25 0.2 0.18 1042 916 1040 1044 1035 1039 1051 1048 1038 1047 772 828 832 833 831 829 831 838 837 842 839 832 Q8 0.13 0.1 0.22 0.34 0.27 0.29 0.26 1 0.8 0.56 0.68 0 0.06 0.17 0.27 0.2 0.25 0.28 0.54 0.49 0.3 0.49 1043 918 1041 1045 1036 1040 1048 1051 1040 1047 771 830 834 835 833 831 833 840 839 844 841 834 Q9 0.14 0.09 0.25 0.4 0.32 0.33 0.25 0.8 1 0.59 0.66 0.01 0.05 0.21 0.31 0.23 0.28 0.26 0.51 0.5 0.31 0.45 1033 910 1031 1035 1026 1030 1038 1040 1041 1037 765 822 826 827 825 823 825 832 831 836 833 826 Q10 0.15 0.17 0.21 0.31 0.27 0.24 0.18 0.56 0.59 1 0.47 0.07 0.14 0.19 0.24 0.21 0.25 0.2 0.36 0.37 0.42 0.35 1041 916 1039 1043 1035 1038 1047 1047 1037 1049 770 827 831 832 830 828 830 837 836 841 838 831 Q11 0.16 0.13 0.2 0.33 0.24 0.34 0.23 0.68 0.66 0.47 1 -0.04 0.04 0.18 0.3 0.2 0.29 0.24 0.47 0.46 0.24 0.52 767 669 769 770 766 766 772 771 765 770 773 600 606 604 604 602 604 608 608 612 609 603
Appendix B: Pearson Correlation Coefficients (Cont.) Number of Observations
Pre Post
Q1 Q2 Q3 Q4 Q5 Q6 Q7 Q8 Q9 Q10 Q11 Q1 Q2 Q3 Q4 Q5 Q6 Q7 Q8 Q9 Q10 Q11
pos
t Q1 0.13 0.11 0.04 0.03 0.03 0.05 -0.05 0 0.01 0.07 -0.04 1 0.1 0.04 0.01 0.09 0.07 0 0.04 0.05 0.04 0.06 824 724 823 827 818 824 828 830 822 827 600 900 889 889 887 885 887 895 894 899 896 889 Q2 0.14 0.51 0.2 0.13 0.13 0.11 0.13 0.06 0.05 0.14 0.04 0.1 1 0.27 0.17 0.22 0.19 0.2 0.08 0.11 0.14 0.1 828 729 828 832 823 829 832 834 826 831 606 889 905 895 893 891 893 901 899 904 901 893 Q3 0.16 0.17 0.61 0.43 0.47 0.35 0.22 0.17 0.21 0.19 0.18 0.04 0.27 1 0.59 0.62 0.48 0.34 0.21 0.25 0.22 0.2 829 728 829 833 824 830 833 835 827 832 604 889 895 906 900 898 900 903 900 905 902 894 Q4 0.07 0.15 0.4 0.58 0.49 0.37 0.29 0.27 0.31 0.24 0.3 0.01 0.17 0.59 1 0.69 0.48 0.4 0.34 0.38 0.24 0.34 827 729 827 831 822 829 831 833 825 830 604 887 893 900 904 898 900 901 898 903 900 892 Q5 0.11 0.17 0.42 0.45 0.54 0.38 0.26 0.2 0.23 0.21 0.2 0.09 0.22 0.62 0.69 1 0.56 0.35 0.29 0.32 0.26 0.25 825 725 825 829 820 826 829 831 823 828 602 885 891 898 898 902 899 899 897 901 898 891 Q6 0.11 0.14 0.38 0.38 0.39 0.49 0.22 0.25 0.28 0.25 0.29 0.07 0.19 0.48 0.48 0.56 1 0.29 0.28 0.31 0.26 0.29 827 728 827 831 822 828 831 833 825 830 604 887 893 900 900 899 904 901 899 904 901 893 Q7 0.07 0.16 0.29 0.35 0.31 0.21 0.66 0.28 0.26 0.2 0.24 0 0.2 0.34 0.4 0.35 0.29 1 0.3 0.31 0.2 0.25 834 732 834 838 829 835 838 840 832 837 608 895 901 903 901 899 901 912 906 911 908 900 Q8 0.15 0.12 0.16 0.26 0.25 0.26 0.27 0.54 0.51 0.36 0.47 0.04 0.08 0.21 0.34 0.29 0.28 0.3 1 0.81 0.49 0.71 833 732 832 836 827 833 837 839 831 836 608 894 899 900 898 897 899 906 911 911 908 901 Q9 0.14 0.14 0.22 0.3 0.28 0.27 0.25 0.49 0.5 0.37 0.46 0.05 0.11 0.25 0.38 0.32 0.31 0.31 0.81 1 0.53 0.68 838 736 837 841 832 838 842 844 836 841 612 899 904 905 903 901 904 911 911 916 913 905 Q10 0.1 0.2 0.21 0.23 0.23 0.2 0.2 0.3 0.31 0.42 0.24 0.04 0.14 0.22 0.24 0.26 0.26 0.2 0.49 0.53 1 0.43 835 734 834 838 829 835 839 841 833 838 609 896 901 902 900 898 901 908 908 913 913 902 Q11 0.13 0.11 0.16 0.26 0.2 0.24 0.18 0.49 0.45 0.35 0.52 0.06 0.1 0.2 0.34 0.25 0.29 0.25 0.71 0.68 0.43 1
828 726 827 831 822 828 832 834 826 831 603 889 893 894 892 891 893 900 901 905 902 905