OLAP in the Data Warehouse
Introduction
Before the advent of data warehouse, tools were available for business data analysis. One of these is structured query language or SQL for query processing. However, SQL is typically limited to a single processing at a time - real-time query processing one after another to understand
relationship of a business matrix with various dimensions is not possible.
Managers also use spreadsheets to understand business functionality through two-dimensional data, charts, an graphs. Addition of a page in a spreadsheet program helps to analyze business data up to three
dimensions, but no more.
However, data warehouses store data for multiple business dimensions. It provides an opportunity to perform analysis on the business data from multiple dimensions. On-Line Analytical Processing (OLAP) provides the tools necessary for such multi-dimensional data analysis.
OLAP Definitions and Rules
The term OLAP or on-line analytical processing was introduced by Dr. E. F. Codd, the father of the relational database. He had defined 12 rules or guidelines for an OLAP system. Later on, six additional guidelines were added. The OLAP Council, which provides membership, sponsors
research, and promotes the use of OLAP, provides a definition of OLAP:
One-Line Analytical Processing (OLAP) is a category of software technology that enables analysts, managers, and executives to gain insight into data through fast, consistent, interactive access in a wide variety of possible views of information that has been transformed from raw data to reflect the real dimensionality of the enterprise as understood by the user.
The main ingredients of the definition are: speed, consistency, interactive access, and multi-dimensional views. If this not clear, we can say that OLAP is fancy term for multi-dimensional analysis.
Guidelines of OLAP
The initial twelve guidelines as proposed by Dr. Codd, as well as the additional guidelines proposed by others, are briefly as follows:
• Multi-Dimensional Conceptual Views: Provides a multi-dimensional data model like Star schema that is intuitively analytical and easy to use.
• Transparency: Make the technology, underlying data repository, computing architecture, and the diverse nature of source data totally transparent to the users.
• Accessibility: Provides access only to the data that is actually needed to perform the specific analysis, presenting a single, coherent, and consistent view to the users.
• Consistent Reporting Performance: Ensure that the users do not experience any significant degradation in reporting performance as the number of dimensions or the size of the database increases.
• Client-Server Architecture: Conform the system to the principles of client-server architecture for optimum performance, flexibility,
adaptability, and interoperability.
• Generic Dimensionality: Ensure that every data dimension is equivalent in both structure and operational capabilities.
• Dynamic Sparse Matrix Handling: Adapt the physical schema to the specific analytical model being created and loaded that optimizes sparse matrix (missing data in the fact table) handling.
• Multi-user Support: Provide support for end users to work concurrently with either the same analytical model or to create different models from the same data. In short, provide concurrent data access, data integrity, and access security.
• Unrestricted Cross-dimensional Operations: Provide ability for the system to recognize dimensional hierarchies and automatically
perform roll-up and drill-down operations within a dimension or across dimensions.
• Intuitive Data Manipulation: Enable consolidation path reorientation (pivoting), drill-down, and roll-up, and other manipulations to be
accomplished intuitively and directly via point-and-click and drag-and-drop actions on the cells of the analytical model.
• Flexible Reporting: Provide capabilities to the business users to arrange columns, rows, and cells in a manner that facilitates easy manipulation, analysis, and synthesis of information.
• Unlimited Dimensions and Aggregation Levels: Accommodate at least fifteen, preferably twenty, data dimensions within a common analytical model.
• Drill-through to Detail Level: Allow a smooth transition from the multidimensional, pre-aggregated database to the detail record level of the source data warehouse repository.
• OLAP Analysis Models: Support Dr. Codd’s four analysis models: exegetical (or descriptive), categorical (or explanatory),
contemplative, and formulaic.
• Treatment of Non-normalized Data: Prohibit calculations made within an OLAP system from affecting the external data serving the source.
• Storing OLAP Results: Do not deploy write-capable OLAP tools on top of transactional systems.
• Missing Values: Ignore missing values, irrespective of the source. This may apply to unbalanced dimensions also.
• Incremental Database Refresh: Provide for incremental refreshes of the extracted and aggregated OLAP data.
• SQL Interface: Seamlessly integrate the OLAP system into the existing enterprise environment.
OLAP Features
The guidelines mentioned above are typically implemented through the following features in an OLAP system:
Multidimensional Analysis
The core of the OLAP system is multidimensional analysis. Here we review the dimensional model and cube. We
start with a simple STAR schema of a retail store consisting of three business dimensions and a fact table containing sales. The dimensions are product, store, and time, and the fact table contains only one measure, sales. As shown below, a cube can be used to show three dimensions along the three axes of the cube. The intersection of
three dimensional values gives a sales fact.
Note, the cube is just a concept, but users typically read data in rows and columns. For example, to display sales data for each month for a single store, we can have products as columns and months as rows. We then create a similar page fro each store. This way we can cover all three dimensions.
However, this methodology will not work if we have more than one measure in the fact table or there are more than three dimensions. Furthermore, for each hierarchy in any dimension we have to have a
separate table. Thus simple spreadsheet-like methodology will not work for multiple dimensions and for displaying hierarchical values.
Hypercubes
As discussed before, businesses typically not only keep track of sales facts, but also some other metrics such as fixed cost, variable cost, and profit margin. If we want to display these facts for a particular product for each month, we can use columns for metrics and rows for months. We then have a similar page for each product.
Instead of the above approach, as shown below right, we hide the fact values and display the attributes of dimensions and facts along three vertical lines to represent the multi-dimensional model. This method of representation is sometimes called as “multidimensional domain structure” or MDS. We can independently move up or down along the straight lines.
We now add another business dimension to the model, such as store. The result is the three business dimensions plus the metrics data. These four groups can not be represented in a three-dimensional cube - the metaphor of a physical cube to represent data breaks down.
This is where the MDS diagram comes in handy. All we have to do is draw four straight lines displaying each dimensional data. This intuitive
representation is a hypercube, a representation that accommodates more than three dimensions. A hypercube is a general metaphor for representing multi-dimensional data. In the lower level, it may very well represent a
cube.
We now have a way of representing four dimensions as hypercube. The next question relates to the displaying of these four dimensional data. As shown below, we can combine products and metrics in columns, time in rows, and stores in pages.
Let us move up to six dimensions, consisting of product, time, store, promotion, demographics, and metrics (measures). The MDS is shown below. Figure below also illustrates how we can combine various
dimensions . For example, product and metrics are combined in columns, and store and time are combined as rows, and demographics and
promotion as pages.
OLAP Capabilities
As mentioned before, OLAP systems provide various ways to look at the data, especially the data in various hierarchical levels. We consider our simple example of a store with three dimensions and a single sales fact. The dimensions are product, time, and store.
The attributes of the product dimension form hierarchies such as product, sub-category, category, product line, and department. Similarly, the time dimension forms a hierarchy of date, month, quarter, and year. The store dimension forms a hierarchy of store name, territory, and region.
OLAP systems provide drill-down, roll-up, slice-and-dice, and other operations.
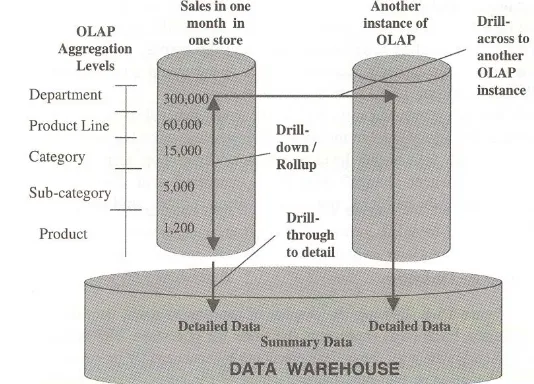
Drill-Down and Roll-Up
Figure right illustrates the drill-down and roll-up operations along the product dimension. It shows the rolling up of sales data among various levels of
aggregation, as well as drilling down of the data to lower levels of detail. The sales data
represent the values at a
particular level of aggregation for a particular month for a particular store.
The figure also shows the drill-across to another OLAP summarization using a different set of hierarchies of other dimensions. Also note the drill-through actions to the lower levels of granularity, as stored in the data warehouse repository.
Whether we are rolling up or drilling down, the data display is always two-dimensional. For example, if we want to roll up to the sales by month by product sub-category, the columns represent sub-category and the rows represent months.
Slice-and-Dice or Rotation
Slicing and dicing or rotation can be better explained through our simple example of retail store with three dimensions of products, time, and store. Figure below illustrates the sales fact for various products for various months in a particular store.
Similar pages represent data for other stores. Each page is a slice or two-dimensional plane of the cube. In particular, the slice above is a plane perpendicular to the store dimension but parallel to the products and time dimensions. Figure below (leftmost) illustrates this page.
We then rotate the cube such that products, time, and store are in different axes. Now we consider a slice perpendicular to the products (and parallel to the other two dimensions), and we see that the values rotate (middle table). A further change of axes gives another slice as well as rotation of the data. This way, the users can see data from different angles.
OLAP Models
In the OLAP world, there are mainly two different types: Multidimensional OLAP (MOLAP) and Relational OLAP (ROLAP). Hybrid OLAP (HOLAP) refers to technologies that combine MOLAP and ROLAP.
MOLAP
This is the more traditional way of OLAP analysis. In MOLAP, data is stored in a multidimensional cube. The storage is not in the relational database, but in proprietary formats.
Advantages:
• Excellent performance: MOLAP cubes are built for fast data retrieval, and is optimal for slicing and dicing operations.
• Can perform complex calculations: All calculations have been pre-generated when the cube is created. Hence, complex calculations are not only doable, but they return quickly.
Disadvantages:
• Limited in the amount of data it can handle: Because all calculations are performed when the cube is built, it is not possible to include a large amount of data in the cube itself. This is not to say that the data in the cube cannot be derived from a large amount of data. Indeed, this is possible. But in this case, only summary-level information will be included in the cube itself.
• Requires additional investment: Cube technology are often proprietary and do not already exist in the organization. Therefore, to adopt MOLAP technology, chances are additional investments in human and capital resources are needed.
ROLAP
This methodology relies on manipulating the data stored in the relational database to give the appearance of traditional OLAP's slicing and dicing functionality. In essence, each action of slicing and dicing is equivalent to adding a "WHERE" clause in the SQL statement.
OLAP in the Data Warehouse Mohammad A. Rob 13 Advantages:
• Can handle large amounts of data: The data size limitation of ROLAP technology is the limitation on data size of the underlying relational database. In other words, ROLAP itself places no limitation on data amount.
• Can leverage functionalities inherent in the relational database: Often, relational database already comes with a host of functionalities. ROLAP technologies, since they sit on top of the relational database, can
therefore leverage these functionalities.
Disadvantages:
• Performance can be slow: Because each ROLAP report is essentially a SQL query (or multiple SQL queries) in the relational database, the query time can be long if the underlying data size is large.
• Limited by SQL functionalities: Because ROLAP technology mainly relies on generating SQL statements to query the relational database, and SQL statements do not fit all needs (for example, it is difficult to perform complex calculations using SQL), ROLAP technologies are therefore traditionally limited by what SQL can do. ROLAP vendors have mitigated this risk by building into the tool out-of-the-box complex
functions as well as the ability to allow users to define their own functions.
HOLAP