A Stud
Corresponden
Received: Dec doi:10.11114/j
Abstract The aim of t environments validity and r consisted of te teacher candid education facu of Kaiser-Mey factor analysis scale regulated been determin factors. From measurement Keywords: at 1. Introductio In science edu education nee much easier f memorize the students assoc will be much environments Authentic lear product to be learning envir teachers can p environments activities. Thi is seen, teach knowledge w problems that problems (Bek In authentic l teaches the to the student. In classroom env make a detail members or single-handed
dy of Dev
nce: Murat Çet
cember 25, 20 jets.v6i4.2887
the research i and evaluatio reliability of th
eacher candida dates being tra ulty. A descrip yer-Olkin (KM s of the obtain d according to ned as 0.931. the results of is a valid and ttitude, authent on
ucation, in-cla eds to be asso for the student e theoretical kn
ciate the theore easier. It is th where perman rning is real l
shared with th ronments that e positively influ appropriate fo s process will hers have gre ill be the mos t can be encou
ktaş and Horzu learning, the te opic of heat ins n authentic lea vironment. Th led analysis o the people a dly and if need
veloping
Env
inkaya, Unye V
17 Acc U
is to improve on attributes of he scale devel ates at educati ained in 2nd a ptive factor ana MO) and Bartl ned data. In ad o the results of Confirmatory f the analysis,
reliable. tic learning, ev
ass theoretical ciated with its ts to interpret nowledge rath etical learning hought that the nent learning is
ife learning. I heir world and enable individ uence their stu or the class. In play an effect eat responsibi st important fa untered in ever
um, 2010). eacher gives t sulation theore arning, the tea
ese tasks are e of the heat ins around them w
ed, he/she may
an Attitu
vironmen
Mur Vocational Scepted: March 2 URL: https://do
e a valid and f the science t loped to evalu ion faculty of O and 3rd class o alysis has been lett has been i ddition, an anti the analysis h
factor analys it is expresse
valuation, valid
learning is of s reflection in the informati her than interp g in school with
e use of authen s provided (Fo It is a style of d thus providin duals to learn b
udent attitudes n authentic lea tive role in help lities in creat factor in plann ryday life. Her
the students so etically very w cher gives the expected to be sulation of the when fulfillin y ask for help.
ude Scale
nts and Ev
rat Çetinkaya hool, Departm
20, 2018 oi.org/10.11114
reliable attri teacher candid uate the authen Ordu Universi of science, ma n carried out to implemented t i-image correl as been forme is has been ap ed that the att
dity, reliability
f vital importa n everyday life on. Students w pret it. Such s
h their daily li ntic learning e ook and Sidhu, f learning that ng meaningful by living and to
s, behaviors an arning, studen
ping students t ting authentic ning the proce reby, they may
ome tasks rela well in the clas
e students with e directly relate
eir houses. Th ng the task. T
After fulfillin
Jo I
Towards
valuation
ment of Compu
Online Publ 4/jets.v6i4.288
ibuting scale dates. The stud
ntic learning e ity (n=202). Th athematics, and o ensure the str
to check the r ation matrix h d. The reliabil pplied to the s itude scale cre
y
ance. As well e. Once this re who cannot es ituation is und ives, interpreta environments w
, 2010). t encourages s l and permane o make a conn nd achieveme nts actively per
to develop and learning env ess. Teachers n y be a guide to
ated to real lif ssroom, this m h non-class tas ed to everyday he students ma The process s ng the duty (tas
ournal of Educa Vol SSN 2324-805X
Published URL
s Authent
n
uter, Ordu Univ
lished: March 2 87
which identif dy has been de environments.
he study has b d elementary t ructural validit reliability for has been check
lity coefficient scale which w eated for the a
as in-class fo elationship is stablish this co desirable in sc ation of new an will be effectiv
students to cre ent learning. It nection with re ents if they cre rform collabor d use high-leve vironments. T need to have o their students
fe. For examp may not get a m
sks as well as y life. The stu ay get inform should be pla sk) given by th
ation and Trainin l. 6, No. 4; Ap X E-ISSN 2
by Redfame P L: http://jets.redf
tic Learni
versity, Ordu,
23, 2018
fies authentic esigned on the
The research been carried ou
teaching classr ty of the scale.
the sampling ked. The latest t (Cronbach Al was determined
authentic learn
ormal learning, established, it onnection will cience teachin and the related ve in creating
eate a tangible t is necessary eal life. In this eate authentic rative problem el thinking ski Teachers' attitu the skills to s s in solving re
ple, although a meaningful res
formal teachin udents may be mation from th anned by the he teacher, the
ng Studies pril 2018 324-8068 Publishing fame.com
ing
Turkey. learning e base of group is ut by the rooms at The test size and t 20-item lpha) has d as two ning and, science t will be l tend to ng. If the learning learning
e, useful to create context, learning m solving lls. As it udes and solve the al-world
Journal of Education and Training Studies Vol. 6, No. 4; April 2018
are asked to report and share it with his classmates in the classroom. This process should be consciously planned by the teacher, the association between the tasks given and the daily life should be well established and the guidance should be maintained during the whole process.
Despite some similarities, there are also significant differences between the context-based approach and authentic learning. In the context (life)-based approach, a problem related to everyday life is used in the lessons through stories. In this approach, the courses are taught according to certain models (ARCS, REACT). In authentic learning, the solutions are flexible. The student can even develop solutions that are specific to their cultural values. In contrast to context-based learning in which there are artificial connections established with real life, students may find solutions in their own life in authentic learning (Dewey, 2007; Gürdoğan and Aslan, 2016).
In authentic learning, the evaluation of the task assigned to the students through classical assessment methods such as multiple choice tests, written or oral exams will not provide sufficient information about the process. On the other hand, the evaluation of the authentic tasks given to the student should be continuous from the beginning of the process until the final stage of the production. The most effective method in evaluating the process is the use of alternative assessment tools (Kılıç, 2014). Not only the cognitive but also the affective and psychomotor developments of the students should be evaluated as a whole. The use of alternative assessment evaluation techniques such as portfolio, concept maps, self or peer evaluation, poster and interviews are recommended in the evaluation of high-level cognitive features of the students such as data collection, analysis and presentation of the results (Küçüktepe, 2010; Kılıç, 2014). In authentic evaluation, it is important for the students to perform, produce and share the tasks. It is essential to measure the performance of the student and to examine the formation process of the resulting product entirely (Tan, 2009). Authentic evaluation requires much more time than classical evaluation techniques, and therefore the evaluation needs to be well planned. If the teacher is inexperienced or he/she has a lack of knowledge about authentic evaluation, the evaluation then will be ineffective. Here, the teacher is expected to be well-equipped and a good mentor to direct the students (Fer and Cırık, 2007). Teachers play a crucial role in establishing and evaluating authentic learning environments. In this context, determining the teachers' attitudes towards authentic learning will be an important reference for the development of new curricula. The aim of this study is to develop a valid and reliable attitude scale for the determination of science teacher candidates’ attitudes towards authentic learning environments and its evaluation. 2. Method
2.1 Study Design
This study was designed to assess the validity and reliability of the attitude scale developed for authentic learning environments and evaluation.
2.2 Sample Group
The sample group consists of the teacher candidates (n = 202) attending Ordu University, Faculty of Education (Table 1). The study was conducted with prospective teachers receiving education in the second and third grades of science, mathematics and classroom teaching departments.
Table 1. Frequency Distribution of the Teacher Candidates Constituting the Research Sample Ordu University, Faculty of Education N %
Science Teaching 70 35
Mathematics Teaching 65 32
Classroom Teaching 67 33
Total 202 100
When the size of sampling is 100 and higher than 100 “low”, and when it is 200 and higher than 200 “medium”, and when it is 300 and higher than 300 “good”, and when it is 500 and higher than 500 “very good”, and when it is 1000 and higher than 1000 “excellent” are specified (Comrey and Lee, 1992). Besides, it is pointed out that the number of the item should be 5 or 10 times for the size of sampling (Tavşancıl, 2002). For the scale developing study consisting of 20 items it can be said that the number of sampling is (n=202) at “medium” level.
2.3 Preparation of Evaluation Instrument
Journal of Educ
attitudes inclu the scale were items in the corrections w measuring the on expert opin 2.4 Analysis of For construct Kaiser-Meyer and sample si correlation of Confirmatory scale, Cronbac 3. Results For factor ana Measures of S removed from from the scale values ranged Table 2. Anti I
Kaiser-Meyer sample size (T the sample is addition, acco Bartlett's test w was found to b Kalaycı, 2010 inter-class cor
cation and Train
uding "knowing e as follows;
scale were gr ere made cons e attitudes inte nions. The fina of the Data
validity of the r-Olkin (KMO) ize. In additio f the scale item
factor analysi ch's Alpha valu
alysis, anti-ima Sampling Ade m the analysis e. In anti-imag d between 0.84
Image Correla
r-Olkin (KMO) Table 3). KMO
adequate (Şen ording to Barle
were used to c be 0.903. It wa 0). This result s rrelation was fo
ning Studies
g, using, and a "strongly agre raded using r sidering the fe ended for authe al scale consist
e scale, an exp ) and Bartlett's on, anti-image ms and values
s was also app ue was calcula
age correlation equacy - MSA (Büyüköztürk ge correlation 6 and 0.950 (T ation Analysis R
) and Bartlett's O value was fo ncan, 2005; K ett's test results check adequacy
as stated that K showed that th found to be hig
applying" towa ee 5", "agree: reverse recodi eedbacks. The
entic environm ting of 37 item
ploratory facto s test were use correlation m of factor load plied using an “ ated.
n analysis was A should be ne k, Bökeoğlu an analysis which Table 2).
Results
s test were use ound to be 0.9 Kalaycı, 2010). s, inter-class co
y of the obtain KMO value of he sample adeq gh (x2=2350, 06
ards authentic 4", "undecide ing. Opinions 3 items in th ments and eval ms was applied
or analysis was ed to check th matrix was als dings were tab “IBM Amos 2
performed. In ecessarily abov nd Köklü, 200
h was perform
ed to check ad 903. It was stat . This result sh orrelation was ned data to fact 1 (around 1) i quacy is marve
67; p<0.01).
learning and e ed 3", "disagre of two field-e scalfield-e havfield-e b luation. Three to the teacher
s performed u he adequacy of
o used. The m bulated and th 24” package pr
n anti-image co ve 0.45 and th 09). Items with med after remo
dequacy of the ted that KMO howed that th found to be hi tor analysis an ndicates that th elous. In additi
V
evaluation wer ee 2", "totally -experts were been expressed items were ex candidates.
sing a “SPSS f the obtained mean, standard he fitness of th rogram. For rel
orrelation anal he items below h a value belo oving the items
obtained data O value of 1 (ar e sample adeq igh. Kaiser-Me nd sample size he sample is a ion, according
Vol. 6, No. 4; Ap
e used. The an disagree 1". N
asked and n d to be at low xcluded from t
19” package p data to factor d deviation, to he items was c liability analys
lysis, the value w this value sh
w 0.50 were e s from the sca
a to factor anal round 1) indic quacy is marve
eyer-Olkin (KM (Table 3). KM dequate (Şenc
to Barlett's tes pril 2018 nswers in Negative necessary level in the scale program. analysis otal item checked. sis of the
Journal of Educ
Table 3. KMO
The factor loa factor load lim rotations, thos item 34 that g of 3 and less i analysis was situation was
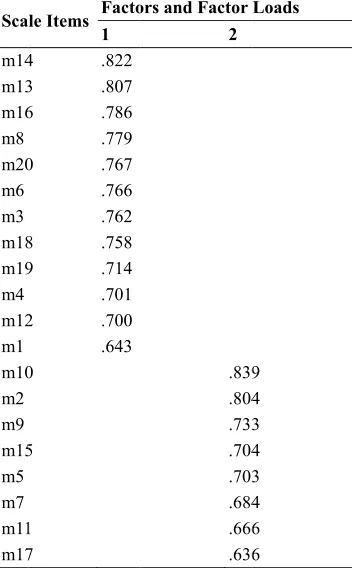
It is seen in F from the scal considered as Table 4. Facto
cation and Train
O and Bartlett's Kais
Bart
ad value of 0.4 mit value was se with factor v gets close value
items were exc repeated. The also observed
Figure 1 that th le due to the two-factor sca ors and Factor
ning Studies
s Test Results ser-Meyer-Olk
tlett's Test of
45 or higher is s set at .50. In values less tha es in more than cluded from th e results of th when the facto
he graph reach weak decisiv ale. Factor grou
Loads
Sca
m14 m13 m16 m8 m20 m6 m3 m18 m19 m4 m12 m1 m10 m2 m9 m15 m5 m7 m11 m17
kin (KMO)
Sphericity
a good measu n the explorato an .50 or close
n one sub-dim he scale. After he repeated an or loads and di
Figure 1. Eig hes a plateau fr ve effect on a ups and factor
le Items Facto 1
4 .822
3 .807
6 .786
.779
0 .767
.766 .762
8 .758
9 .714
.701
2 .700
.643 0
5
1 7
Approx. Chi-df
Sig.
ure for selectio ory factor ana to .50 were ex mensions and it
excluding the nalysis indicate
istributions of
genvalue-Facto rom the third f attitude. Consi r loads of the s
ors and Factor 2
.839 .804 .733 .704 .703 .684 .666 .636
-Square 2
on (Büyüköztü alysis, of the i
xcluded (14, 2 tems 2, 3, 4, 7, items from th e that the sca f the scale were
or Graph factor. These i idering the fac
cale items are
Loads
9 4 3 4 3 4 6 6
V
.903 2350.067 378 .000
rk, Bökeoğlu a items that und 6, 30 and 40). , 20, 24, 26, 27 he scale, the va ale is 2-factor
e examined.
items (26, 27 a ctors and fact
shown in Tabl
Vol. 6, No. 4; Ap
and Köklü, 20 dergo varimax In addition, a 7, 28 and 36 co arimax vertical
(Figure 1). A
and 28) were e tor loads, the le 4.
pril 2018
09). The x vertical s well as onsisting l rotation A similar
Journal of Education and Training Studies Vol. 6, No. 4; April 2018
In Table 4 it is seen that the items of the attitude are positive expressions for the factor 1, and negative expressions for the factor 2. While the "Positive Approach", which is the 1st factor of the scale consists of 12 items (1, 3, 4, 6, 8, 12, 13, 14, 16, 18, 19 and 20), the variance was found to be as 44.071%. The second factor, “Negative Approach”, consists of 8 items (2, 5, 7, 9, 10, 11, 15 and 17) and the variance was found to be as 14.763% (Table 5).
Table 5. Factor Eigenvalues
Factors Initial Eigenvalues Rotation Sums of Squared Loadings
Total % of Variance Cumulative % Total % of Variance Cumulative %
1 - Positive Approach 8.814 44.071 44.071 7.093 35.464 35.464
2 - Negative Approach 2.953 14.763 58.834 4.674 23.370 58.834
Table 5 shows the results of exploratory factor analysis. The total variance explained by 2 factors is 58.834%. The value of the variance explained is interpreted as an indicator of how well the relevant attitude is measured. It can be said that the total variance value (58.834%) is above the acceptable variance value (Büyüköztürk, Bökeoğlu and Köklü, 2009). Reliability analysis of all the factors and the scale was performed and the reliability coefficient (Conbach alpha) values are presented in Table 6.
Table 6. Reliability Coefficients of the Factors and the Scale
Factors Number of items Reliability Coefficient (cronbach alpha) % of variance
1 - Positive Approach 12 0.935 44.071
2 - Negative Approach 8 0.870 14.763
Total 20 0.931 58.834
When Table 6 is analyzed, it is seen that the variance of "Positive Approach" factor consisting of 12 items is 44.071 and the reliability coefficient (Cronbach Alpha) is .935. These values were 14.763 and .870 respectively in "Negative Approach" factor that consists of 8 items. The reliability coefficient of the 20-item scale was found to be .931.
The data on mean, standard deviation, total-item correlation and factor load values of the scale items are presented below.
Journal of Education and Training Studies Vol. 6, No. 4; April 2018
Table 7. Mean Standard Deviation, Total-Item Correlation and Factor Load Values of the Scale Items
Scale Items
Mean Standar
d
Deviation Tota
l-It
em
Corr
elation
Factor
Load
Va
lu
es
Factor 1 – Positive Approach
1 I love creating authentic learning environments when teaching unit topics. 3.42 1.077 .498* .643 3 I would like to use authentic learning environments in all my courses. 3.49 1.112 .666* .762 4 Authentic learning method should be used in other courses (mathematics, science). 3.79 1.008 .624* .701 6 I think that authentic learning method can be effectively used in education. 3.85 1.016 .713* .766 8 Authentic learning makes lessons more enjoyable. 3.90 .992 .739* .779 12 I think that the authentic tasks given to the students are effective in learning. 3.89 1.057 .669* .700 13 I enjoy preparing a course environment in which authentic tasks appear. 3.69 1.040 .749* .807 14 I try to prepare lesson plans involving authentic tasks and activities. 3.60 1.057 .694* .822 16 I try to use authentic learning and evaluation in my lessons as much as possible. 3.26 1.079 .688* .786 18 I think that authentic assessment and evaluation is also instructive for students. 3.88 .951 .693* .758 19 I would like to learn everything about authentic assessment and evaluation. 4.00 1.065 .686* .714 20 I think that the effectiveness of teaching activities will increase with the implementation of
task 3.71 1.083 .659* .767
Factor 2 – Negative Approach
2 I regard authentic learning environments as unnecessary to be included in the curriculum. 4.62 .713 .544* .804 5 I do not prefer to use authentic learning environments unless it is really necessary. 4.41 .924 .590* .703 7 Authentic learning activities impose an unnecessary burden to the teachers. 4.56 .759 .550* .684 9 I think it would be better to do regular lectures instead of conducting activities included in
authentic learning. 4.17 1.160 .484* .733
10 I think that authentic learning activities are not effective in learning and they are
unnecessary. 4.60 .724 .572* .839
11 I think that authentic learning environments will weaken my authority in the classroom. 4.45 .903 .527* .666
15 Authentic learning is not interesting. 4.61 .759 .540* .704
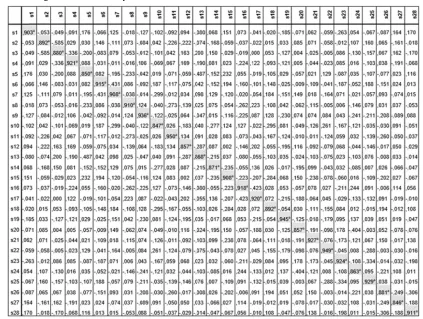
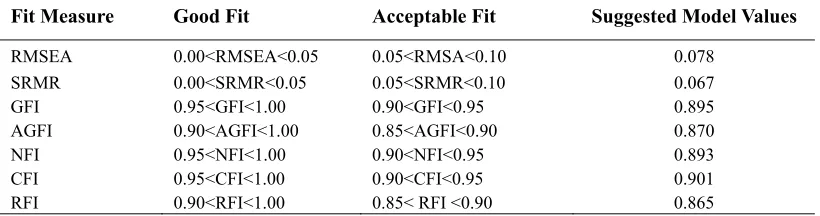
17 Authentic assessment and evaluation is not within my area of interest. 4.45 .909 .585* .636 The scale which was identified as two-factor scale in the exploratory factor analysis was also applied to confirmatory factor analysis. In the confirmatory factor analysis, goodness of fit index (GFI), adjusted goodness of fit index (AGFI), normed fit index (NFI), standardizedroot-mean-square residual (SRMR), and root mean square error of approximation (RMSEA) and comparative fit index (CFI) were considered. Acceptable threshold values of the commonly used fit indexes and fit values of the proposed model are shown in Table 8 (Schermelleh-Engel & Moosbrugger, 2003; Erdoğan, Bayram, and Deniz, 2007).
Table 8. Confirmatory Factor Analysis Results
Fit Measure Good Fit Acceptable Fit Suggested Model Values
RMSEA 0.00<RMSEA<0.05 0.05<RMSA<0.10 0.078 SRMR 0.00<SRMR<0.05 0.05<SRMR<0.10 0.067 GFI 0.95<GFI<1.00 0.90<GFI<0.95 0.895 AGFI 0.90<AGFI<1.00 0.85<AGFI<0.90 0.870 NFI 0.95<NFI<1.00 0.90<NFI<0.95 0.893 CFI 0.95<CFI<1.00 0.90<CFI<0.95 0.901 RFI 0.90<RFI<1.00 0.85< RFI <0.90 0.865
Journal of Educ
(181)=399.712 squares averag goodness of f findings supp The results of RMSA, SRMR general, it is p the 2-factor m
It is seen that items'' are bet expressions in be coherent w created betwe 4. Discussion Teaching scie science in one curriculum. T students. One planned and e are of great im teachers' attitu The developm preparing the towards authe learning was r were created. Considering th applied to the The data obtai below or nea
cation and Train
2, p<0.01. Roo ge (SRMR) = fit index (AGF
ort the factor f confirmatory R, AGFI, CFI possible to say model is shown
the covarianc tween “m1 and ntended for the with each othe en “m9 and m
ence topics ass e’s own life, f Teachers play t e of the most e
evaluation sho mportance. In udes towards a ment stage of t
scale items, w entic learning
reviewed and For the scale, he opinions of study group c ined were subj ar .50 were ex
ning Studies
ot mean squar 0.067; compa FI) = 0.870; n structure of th y factor analys
and RFI value y that the mode n below (Figure
Figure ces among som d m16”, “m18 e purpose. The er. Similar con m10”, “m15 and
sociated to rea finding out sol the most impo effective ways uld cover the
this context, authentic learni
the scale was written opinion
and evaluatio total 40 items , opinions of 2 f the field exp onsisting of 20 jected to an an xcluded. In ad
re error of app arative fit inde normed fit ind he attitude sca sis showed a es were accept el is in good ag
e 2).
e 2. Two-Facto me items have
and m12”, “m erefore, even if ndition is also d m17”.
al life will also lutions and rep ortant role here s to create suc process. Here it was aimed ing environme discussed in ns of 15 prosp on were obtain
s (18 negative 2 field experts perts, 3 items w
02 teacher can nti-image corre ddition, Kaise
proximation (R ex (CFI) = 0.9 dex (NFI) = 0 ale towards au good agreeme table, but GFI greement with
or Path Diagra been formed m12 and m13”
f the expressio o valid the ite
o increase the porting them e. A well-equi ch environmen in, teachers' a to develop a ents and evalua
detailed in ter pective teache ned. In additio 22 positive at s were asked a were excluded ndidates.
elation analysi er-Meyer-Olkin
RMSEA) = 0.0 901; goodness 0.893; the rela uthentic learnin ent between m
and NFI value the data, but t
am of the Scale in Figure 2. T and “m13 and ons are differen ems for negati
students' ach is one of the m ipped teacher nts is authentic
ttitudes toward valid and relia ation.
rms of conten ers who were n on to the opin
ttitudes) includ and corrections d from the sca
s to check the n (KMO) and
V
078; standardiz of fit index (G ative fit index
ng environme model and the es were close to
this fit is not p
e
The formed cov d m14”. These
nt, the given an ive attitude. A
ievement towa most importan will provide f c learning. Te ds authentic le able measurem
t, structure an not included i nions, the liter ding "knowing s, additions/su ale and the rem
conformity. T d Bartlett's tes
Vol. 6, No. 4; Ap
zed root mean GFI) = 0.895; (RFI) = 0.865 nts and its ev
data. It was s o acceptable v perfect. The dia
variances for ' e items also inc nswers are exp A covariance h
ards science. L nt goals of the further guidanc
aching should earning and ev ment tool to d
nd face validity in the research rature on the a g, using and a ubtractions wer maining 37 ite
Three items wit st were used t
pril 2018
residual adjusted 5. These aluation. seen that values. In agram of
''positive clude the pected to has been
Learning e science ce to the d be well valuation etermine
y. While h sample authentic pplying" re made. ms were
Journal of Education and Training Studies Vol. 6, No. 4; April 2018
adequacy of the obtained data to factor analysis and sample size. KMO value was found to be .903 indicating a marvelous adequacy. On the other hand, according to Barlett's test results, inter-class correlation was found to be high (x2= 2350.067; p<0.01). An exploratory factor analysis was performed to the data that were found to be appropriate for the sample. Four items with factor load value less than or close to 0.50, 3 items consisting of a single sub-dimension, and 1 item having close values to each other in more than one sub-dimension were excluded. Final scale consisted of 20 items. The reliability coefficient of the 20-item scale (Cronbach Alpha) was determined as 0.931.
Confirmatory factor analysis was applied to the 2-factor scale. The similarity ratio chi-square statistic was found as x2 (181) = 399.712, P <0.01. Root mean square error of approximation (RMSEA) = 0.078; standardized root mean residual squares average (SRMR) = 0.067; comparative fit index (CFI) = 0.901; goodness of fit index (GFI) = 0.895; adjusted goodness of fit index (AGFI) = 0.870; normed fit index (NFI) = 0.893; the relative fit index (RFI) = 0.865. The results obtained showed that the model is in good agreement with the data. While RMSA, SRMR, AGFI, CFI and RFI values were within acceptable range, GFI and NFI values were close to acceptable values. In general, it is possible to say that the model is in good agreement with the data, but this fit is not perfect. According to the analysis results, it can be concluded that the attitude scale developed towards authentic learning environments and evaluation is a valid and reliable scale.
Authentic evaluation should be handled as a whole by combining it with authentic tasks. In this way, it is possible to evaluate the learning and the learning process at the same time (Bektaş and Horzum 2010). In order to make an authentic evaluation, the teacher needs to have sufficient knowledge about the evaluation. However, evaluation in this way may be meaningful. When evaluating the authentic tasks, alternative assessment evaluation techniques are frequently used (Koçyiğit and Zembat, 2013; Kılıç and Aydın 2014; Gürdoğan and Aslan, 2016). In this context, teachers' attitudes towards such evaluations are of vital importance. The planning and implementation of the alternative assessment evaluation takes much more time than that in classical evaluation and this creates reluctance in some teachers (Gürdoğan and Aslan, 2016). Attitude scales that are valid and reliable will be useful for the determination of such situations and the planning of the teaching. It can be said that the scale developed in this study can be used and use for teacher candidates and teachers.
Acknowledgements
In this study, presented as oral presentation to “The Ninth International Congress of Educational Research, Ordu, Turkey / May 11-14, 2017”.
References
Bektaş, M., & Horzum, M. B. (2010). Otantik öğrenme [Authentic learning], Ankara: Pegem Akademi Yayınları. Büyüköztürk, Ş., Bökeoğlu, Ç. Ö., & Köklü, N. (2009). Sosyal bilimler için istatistik [Statistics for social sciences].
Ankara: Pegem Akademi.
Comrey, A. L., & Lee, H. L. (1992). A first course in factor analysis, Hillsdale, New Jersey: Erlbaum.
Dewey, J. (2007). Deneyim ve eğitim [Experience and education]. Çeviren: S. Akıllı. Ankara: ODTÜ Yayıncılık A.Ş. Erdoğan, Y., Bayram, S., & Deniz, L. (2007). Web based instruction attitude scale: Explanatory and confirmatory factor
analyses. Uluslararası İnsan Bilimleri Dergisi, 4(2), 1-14.
Fer, S., & Cırık, İ. (2007). Yapılandırmacı öğrenme: Kuramdan uygulamaya [Constructivist learning: Applying from theory to theory]. İstanbul: Morpa yayıncılık.
Fook, C. Y., & Sidhu, G. K. (2010). Authentic Assesment and Pedagogial Strategies İn Higher Education, Journal of Social Science, 6(2), 153-161. https://doi.org/10.3844/jssp.2010.153.161
Gürdoğan, M., & Aslan, A. (2016). Opinions of classroom teacher candidates about the authentic learning approach. Fen Eğitimi ve Araştırmaları Derneği Fen Bilimleri Öğretimi Dergisi, 4(2), 114-140.
Kalaycı, Ş. (2010). Factor analysis. SPSS applied multivariate statistical techniques. (Edt: Ş. Kalaycı) Ankara: Asil Yayın Dağıtım.
Kılıç, R. (2014). Evaluation of knowledge, attitudes and opinions about authentic measurement and evaluation methods of elementary school I level teachers. Marmara Üniversitesi, Eğitim Bilimleri Enstitüsü. Yayınlanmamış doktora tezi, İstanbul.
Kılıç, R., & Aydın, O. (2014). An Investigation of Primary School Teachers ' Knowledge and Attitudes for Authentic Assessment and Evaluation Methods. Turkish Studies-International Periodical for the Languages, Literature and History of Turkish or Turkic, ISSN, 1308-2140.
Journal of Education and Training Studies Vol. 6, No. 4; April 2018
Üniversitesi Eğitim Fakültesi Dergisi, 28(28-3).
Küçüktepe, C. (2010). Basic characteristics of primary education. (Editör: Oktay, A.) İlköğretime Hazırlık ve İlköğretim Programları, 1. Baskı: Ankara: Anı yayıncılık.
Schermelleh-Engel, K., & Moosbrugger, H. (2003). Models: Tests of Significance and Descriptive, Psychological Research Online, 8(2).
Journal of Education and Training Studies Vol. 6, No. 4; April 2018
APPENDIX. Attitude Scale towards Authentic Learning Environments and its Evaluation The following are statements that describe attitudes and behaviors towards authentic learning and assessment. These expressions may be those that identify you, or those that do not. Please read carefully each item and mark the option that best describes your situation. Your answers are not true or false, and how important your answers represent you. Your answers will only be used for this research and the information will remain hidden.
Thank you very much for your help and information. Dr. Murat ÇETİNKAYA
T
otally Disagr
ee
Disagr
ee
Unde
ci
de
d
Agr
ee
Str
ongly
A
gr
ee
1 I love creating authentic learning environments when teaching unit topics. 1 2 3 4 5 2 I regard authentic learning environments as unnecessary to be included in the curriculum. 1 2 3 4 5 3 I would like to use authentic learning environments in all my courses. 1 2 3 4 5 4 Authentic learning method should be used in other courses (mathematics, science). 1 2 3 4 5 5 I do not prefer to use authentic learning environments unless it is really necessary. 1 2 3 4 5 6 I think that authentic learning method can be effectively used in education. 1 2 3 4 5 7 Authentic learning activities impose an unnecessary burden to the teachers. 1 2 3 4 5
8 Authentic learning makes lessons more enjoyable. 1 2 3 4 5
9 I think it would be better to do regular lectures instead of conducting activities included in
authentic learning. 1 2 3 4 5
10 I think that authentic learning activities are not effective in learning and they are unnecessary. 1 2 3 4 5 11 I think that authentic learning environments will weaken my authority in the classroom. 1 2 3 4 5 12 I think that the authentic tasks given to the students are effective in learning. 1 2 3 4 5 13 I enjoy preparing a course environment in which authentic tasks appear. 1 2 3 4 5 14 I try to prepare lesson plans involving authentic tasks and activities. 1 2 3 4 5
15 Authentic learning is not interesting. 1 2 3 4 5
16 I try to use authentic learning and evaluation in my lessons as much as possible. 1 2 3 4 5 17 Authentic assessment and evaluation is not within my area of interest. 1 2 3 4 5 18 I think that authentic assessment and evaluation is also instructive for students. 1 2 3 4 5 19 I would like to learn everything about authentic assessment and evaluation. 1 2 3 4 5 20 I think that the effectiveness of teaching activities will increase with the implementation of task 1 2 3 4 5
Copyrights
Copyright for this article is retained by the author(s), with first publication rights granted to the journal.