Issues
ISSN: 2146-4138
available at http: www.econjournals.com
International Journal of Economics and Financial Issues, 2018, 8(2), 344-349.
Analysis of Income Convergence in G-20 Countries with
Structural Break Unit Root Test
Mustafa Emre Ertuğrul
1, Kemaletttin Tanrıseven
2*
1Candidate in Economics, Nevşehir Hacı Bektaş Veli University, Social Sciences Institute, Nevsehir, Turkey,
2PhD in Economics, Nevsehir, Turkey. *Email: [email protected]
ABSTRACT
In the globalizing world, the convergence of countries can’t be avoided. Any phenomenon in a country can reach other countries within a short period of time. Therefore, the article was made by using G-20 countries that came together for a purpose. The article also analysis whether or not the real income per capita of the countries can converge over time. The sample period is between 1960 and 2016. Considering the possibility of breaking during this period in the time series, the study was also tested with the single fractured Lee-Strazicich (2013) unit root test.
Keywords: G-20 Countries, Convergence, Lee-Strazicich (2013) Unit Root Test
JEL Classifications: C22, C41
1. INTRODUCTION
The concept of growth is one of the most interested topics of economists in each period. It is very significant to analysis how economic growth is occurring not only in developed countries but also developing countries. In 1956, Solow (1956) has been formed fundamental of growth theories. In the time, the theory of convergence developed among theories of growth. Globalization of the world is generally one of the most significant causes in terms of convergence of these countries.
Economists are interested whether or not per capita real incomes between countries converge in the last time. This is referred as convergence in the economic literature. Also, this information was mentioned in the former paragraph. Actually, convergence is that poor countries are improved faster than wealth countries and per capita real income converge in time. Baumol (1986) used convergence first of all in own article. He totally analyzed 16 developed and wealth countries. Convergence analysis was made using per capita income in the article and he mentioned which convergence analysis is significant in the long term.
There are certain spot which is needed to focus in convergence hypothesis. Because convergence hypothesis make a promise to
converge in the long term, it is possible to anticipate decrease of income disparity in time. Because economic growth of developed countries slows in time. On the other hand, economic growth of developing countries gradually accelerates and converges to wealth countries. For example, growth rate of USA is lower than China’s growth rate.
Convergence does not actually refer convergence occurring between the richest countries and the poorest countries. It is also necessary to fulfill foreign trade between two countries for make mention of convergence hypothesis. Indeed, convergence can be more sensible if convergence make by dividing into groups all countries. Considering all countries in the world, certain countries will never catch probably the countries such as USA and Germany. For this reason, countries to fulfill convergence analysis should choose strategically and meticulously.
Abramowitz (1986) used briefly description for convergence hypothesis. According to Abramowitz, to remain behind under certain conditions create faster growth capability and more productivity from beginning leader country. Basically, this is the main claim in convergence analysis. It is said that the convergence hypothesis is three main sources such as globalization, neo-classical growth model and spread of technology in literature. Transfer of new technologies possessing developed countries from developed countries to developing countries contribute positively economic growth rate of developing countries. Because labor wages are low especially in China, foreign investments are very much. For this reason, coming of technology to this country is the biggest factor accelerating productivity. Another concept also is globalization. This concept is different from other concepts. There is a tangible concept in terms of technological spread. But there are not tangible examples in globalization. Nevertheless, although economists haven’t explained how globalization causes to convergence, convergence is emphasized in relation to globalization.
Another notion is neo classical growth theory. The law of diminishing returns comes to mind within growth theories. This hypothesis says that countries will spontaneously show up convergence with to make transition stationary state. That is to say, because marginal productivity of capital in developing countries is higher than marginal productivity of capital in developed countries, developing countries is relatively faster than developed countries.
Income difference has become a contemporary policy issue in recent years. Therefore, importance of convergence has increased. Because, studies displays that country incomes is necessary to converge each other for to be able to make trade of two countries. This situation is valid not only for income but also for cultural convergence. It is an actual that converging countries increase communication with each other.
If income obtained post production in a country is balanced distributed, people can be said to be happier. If this sentence is interpreted according to countries, trade between two countries is related to which income is converging each other. Countries converging income to each other provide more efficiency in bilateral trade. Briefly, income convergence increases foreign trade. Therefore, one of ways of trade increasing worldwide is convergence of country incomes. In this manner, a country can demand products that it need from other countries. If there is wealthy country on one side while there is a poor country on the other side, it shouldn’t be expected to be much of bilateral trade in this case. Therefore, convergence of country incomes is very significant. Convergence notion cannot be restricted with only income. Convergence analysis can be applied on almost every subject in literature. No matter what subject, existence of convergence increases integration between binary.
This study offers to literature some contribution. The first contribution is to use the G-20 countries namely Australia, Argentina, Brazil, China, European Union, France, Indonesia, India, Italy, Japan, Mexico, South Africa, Turkey, United Kingdom, United States of America, Canada, Saudi Arabia, Korea, Rep.,
Germany, Russia. Moreover, this article contributes to literature by examining the convergence analysis for G-20 countries by using univariate with one structural breaks developed by Lee and Strazicich (2013).
It is firstly mentioned from convergence concept and from starting point of this notionin this article. Owing to subject of article, convergence notion is explained and it is referred how income convergence is showed. In second chapter of this article, literature research was made with articles containing convergence notion. And then, it was examined whether or not per capita real incomes of the G-20 countries converge each other and unit root test was applied. Finally, results were evaluated in framework of convergence analysis.
2. LITERATURE
Desli (2009) investigated beta convergence of productive fertility and per capita income for 15 European Union countries. This study was made time period when European economic and monetary union exists. A production boundary approach was used to take measures for productivity. In this article, although evidence of convergence found in terms of productivity as well as per capita income, the results show diversity in sub-segment. Convergence in per capita income consisted between 1986 and 1990 and between 1991 and 1995. Moreover convergence of productive fertility consisted between 1986 and 1990, between 1996 and 2000, and between 2000 and 2004. It was come through that result at some productivity levels. In less productive countries, income convergence is relatively encountered more.
While convergence notion for countries is examined, convergence is not only among countries. In addition, convergence also exists as regional. Brenner and Kauermann (2016) perform a study for Germany. It was explored employment which is peculiar to industry in this article. As a result, they came to conclusion that convergence is consist of existence of certain firms.
Savoia and Sen (2016) claim that inequality of per capita incomes is explained by quality of institutions in country. They contributed to this information by analyzing for convergence having bureaucratic and administrative corporate quality. They selected between 1970 and 2010 as time series. Moreover, countries having weak institutions were first analyzed in the study. As a result, they were deduced that countries having weak institutions was slowly made progress process. Cavenaile and Dubois (2011) used European Union for convergence analysis. But, all of European Union was used in article. Countries were usually chosen from central Europe and Eastern Europe. Time series was between 1990 and 2007. It was used adapted shape to panel approach of equation developed by Solow. As a result, assumption is that countries including later belong to different combination groups.
Cosci and Mirra (2017) stated that role of motorway infrastructure in decreasing economic diversities is important. Moreover, they said that was discussed both in United States and in Europe. In the second half of the 20th century, a large investment which was
time between north regions and south regions of Italy. Spatial analysis of convergence was made. As a result, they said that impact of motorway infrastructure investment was important, but they said that was strong polarization between north and south. This is because is that investments in south region are higher than investments in north region. So, between two regions emerged polarity. Breuer et al. (2014), who conducted an article related to United States of America, examined an income convergence analysis of USA states. The article’s time series are between 1929 and 2011. As a result, they deduced that were convergence in income until 1978, but they detected that in 1978 was a break. In addition, they deduced which convergence came back in 1990.
Solarin et al. (2014) examined whether or not convergence of real income in South Asian Association for Regional Cooperation (SAARC) and Association of Southeast Asian Nations (ASEAN) is. It was used Univariate Lagrange multiplier (LM) unit root tests having structural breaks for stated conditional convergence within-classical model in article. As a result of analysis, in spite of existing a convergence between ASEAN members, there was not convergence between SAARC members.
Özgüzer and Binatli (2016) examined economic effects of complexity in market by convergence analysis. Countries used in analysis were European Union countries. According to article, if complexities occurring within economy increase, convergence can be seen. Countries divided into two as complexity level. While first group includes countries having more complexity, second group includes countries having less complexity. As a result, convergence was further in first group.
Zumaquero and Rivero (2016) examined impact on convergence of financial crises and exchange rate policies. Time period is between 1970 and 2011. Countries were analyzed by dividing four groups. As a result, they deduced that high-income countries were converged to each other. It was deduced to conclusion that financial crises have supplied significant and negative contributions to economy of country. Considering exchange rate policies, in middle level countries is commonly seen.
D’Uva and Siano (2011) analyzed whether or not convergence between Italy and Italian regions is. There are different time series used in study. Primarily, all sampling times used in study were analyzed by means of ADF and KPSS tests. Later, tests were made as breaking since time series were not stable. As a result, there is not convergence in Italian regions. However, when structural break tests are applied, convergence is stochastically seen regions such as Umbria, Molise, Tuscany, Basilicata and Puglia.
Ram (2017) made income convergence analysis and used data’s between 1960 and 2010. There are three main points article. Ram (2017) summarizes as follows: “First, two measures yield qualitatively alike scripts, and both point out sigma divergence in income over the period. Second, however, they display large differences in the rate of change in income inequality, and SDLOG indicates divergence at a much higher rate than CV. It seems likely that SDLOG would point out greater divergence, or weaker convergence, than CV in many cases. Finally, that’s way,
researchers are urged not to rest too heavily on one or the other measure for an inference on sigma convergence, and it seems convenient to consider both for drawing plausible conclusions on convergence in income and many other variables studied by scholars.”
Lei and Tam (2010) analyzed whether or not income convergence between China, Macao and Hong Kong is and some evidence is offered. This article shows that countries do not diverge from each other in the long term. Income convergence relate to rapid growth of country in China. As a result, it is said that are positive signs toward deepening economic co-operation among China’s economies.
Dawson and Strazicich (2010) carried out convergence analysis on group occurring 29 countries. Per capita real incomes actualizing between 1990 and 2001 were analyzed in article. LM unit root tests were examined to determine structural breaks in series and to determine the location of breaks. The most important property of this test is that it prohibits delusive rejections occurring DF test. According to results, it was seen that real incomes converged each other in 23 countries. In addition, an important matter was mentioned in article. They briefly said that the Second World War lead to structural break in many countries.
The global financial crisis has been a matter affecting countries across the world. Countries encountered with financial crises in this period. Debt crises following the destruction of financial system are also encountered. Apergis and Cooray (2014) which refers to this events made convergence analysis. Time series was quarterly between June 2009 and June 2013. They focused on convergence of debt ratios in analysis. At the end of study, a debt integrity deficiency was found in Greece and Portugal. Moreover, measures taken in emerging debt crisis are different for every country.
Robinson (2007) made convergence analysis and co integration tests of electricity prices by using European Union’s 9 countries. Prices were taken annually whether is between 1978 and 2003. In fact, main reason for making these tests was to see whether or not the policies of the countries having a intention to create single electricity market in Europe was benefit. As a result, it was deduced that almost all countries converged each other. In another article, Webber (2001) made to analysis how impacts of economic shocks affected convergence. Strikes related to international economy 1973 was mentioned. Webber using among 1960-1990 as sampling term, analyzed how other years converged when compared to 1973. As a result, convergence is slower than in 1973.
Looking at European Union’s countries, industrialized countries are generally seen. In other words, agricultural activities of these countries are not very much. Therefore, Barath and Fertö (2017) analyzed whether or not EU countries reduced agricultural factor productivity. Countries were divided into two groups when doing this analysis. On the one hand, there are old EU members. On the other hand, there are new EU members. Results show that decrease total agricultural productivity. However, there are differences between groups due to analysis as two groups. In spite of everything, it is reached result which productivity is converged at least.
The neoclassical growth model predicts not only decrease per capita income inequality in time but also converge income inequality levels in the long term. Therefore, Tselios (2009) analyzed whether or not this situation was valid at European Union countries. The database is between 1995 and 2000. Results display existence of conditional convergence in per capita income after checking unconditional convergence of income inequality at which level of education, unemployment, sectoral composition.
Convergence analysis is an analysis that can be done on every issue. Güriş et al. (2017) analyzed whether or not military expenditure of NATO countries converged. Data’s were between 1953 and 2014 in article. Hypothesis was tested with both linear unit root tests and nonlinear unit root tests. According to results, while military expenditures in Portugal, Germany, Luxembourg, Greece and England converge to average of NATO military expenditures, military expenditures of other countries diverge from average.
Wang (2012) made income convergence analysis in region of ASEAN. Looking at old members, it seems that convergence continues for a long term. Yet, new members seem to have slowly adapted to the region. However, 22 annual data was used in article and only three countries with convergence effects were identified.
Another issue that is studied in convergence field was convergence of energy production made by Apergis and Christou (2016). Analysis of energy efficiency between 1972 and 2012 was made in article. Results display that there is not an entire convergence but there is convergence at certain groups and usually converge in the long term. Moreover, they mentioned supporting of energy policies that would be beneficial for convergence.
3. METHODOLOGY, DATA AND FINDINGS
Time series analyses were used in article. Structural break is called as variations that start at any period in time series belonging to economic variables and proceed impact a certain time. Without considering structural breaks, making unit root test emerges wrong results and reduces analysis’s power. Since there is 2008 global financial crisis in used time series, one breaking unit root test was used.
3.1. Lee and Strazicich (2013) Unit Root Test
In article, unit root test developed by Lee and Strazicich (2013) was used. This test internally determines existence of structural breaks and permits only one structural break. Unit root test which
is internally determined and permits existence of one structural break is LM unit root test depended on two models as fixed (Model A) and trend (Model C). Data generation process for Lee and Strazicich (2013) unit root test can be expressed as follows:
yt = δ′Zt+Xt, Xt = βXt−1+εt (1)
Yt = δ’Zt + Xt, Xt = βXt−1, + εt (1) in equation, Zt is vector of external variables and εt is error term. Test (Model A) allowing to existence of structural break permits a level break under alternative hypothesis. Model A is expressed as Zt = [1, t, Dt] about to demonstrate a dummy variable being Dt = 1 for t > Tb + 1 and Dt = 0 for other conditions. Tbj shows time period when breaking occurs and S ‘= S1, S2, S3.
Model C similarly allows one break at level and slope under alternative hypothesis. And Model C is expressed as Zt = [1, t, Dt, DTt] about to demonstrate a dummy variable being DTt = t - Tb for t> Tb + 1 and DTt = 0 for other conditions. In Lee and Strazicich analysis, unit root test statistics are obtained using below regression according to LM rule;
t t t 1 t
Y Z S u
∆ =δ′ ∆ + φ − + (2)
In equation (ΔYt = δ’ΔZt + ϕSt-1, + ut), (St) is (Yt − ψxZtδ) and t = 2,…, T’.(δ) expresses coefficients obtained from regression of ΔYt over ΔZt. ψx, Y1, − Z1, shaped δ is obtained. In unit root test of Lee and Strazicich (2013), unit root base hypothesis is expressed by ϕ = 0.
τ:φ =0 (3)
What testing basic hypothesis of LM test statistics expressed as t-statistic. It is chosen as time giving minimum unit root t-statistic for likely breakpoints about to show Tb break time.
Inf ( ) = inf ( )τ λ τ λ
λ (4)
In fourth equation, (λ=Tb/T and λϵ[0,1]) in this shape is calculated. Critical values for minimum LM unit root test which are internally determined and permit existence of one structural break are tabulated by (2013) Lee and Strazicich (Ünlü and Bozdağ, 2016. p. 95).
Data’s used in article come about per capita real incomes of G-20 countries between 1960 and 2016. GDP per capita is measured in constant prices and US dollars (Constant 2010 US $). Data are from the World Bank World Development Indicators database (https://data.worldbank.org/indicator/NY.GDP.PCAP.KD). Due to have the highest per capita real income in this analysis, Australia was taken as main country.
4. EMPIRICAL RESULTS
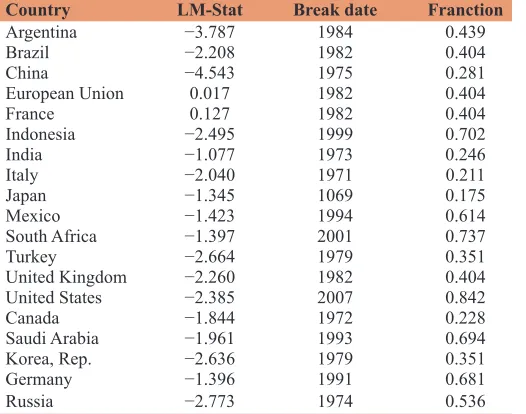
were given in Table 2. It was based on country having the highest per capita real income so as to analyze convergence of countries. Therefore, Australia is not among countries. Other countries are listed as follows. Argentina, Brazil, China, European Union, France, Indonesia, India, Italy, Japan, Mexico, South Africa, Turkey, United Kingdom, United States of America, Canada, Saudi Arabia, Korea, Rep., Germany, Russia.
The results are interpreted according to statistical values and critical values given in Table 1. Considering absolute value of the series, if it is bigger than critical value, time series is stationary and does not contain unit root. However, if test statistic value is less than critical value, time series is not stationary and contains a unit root. Then, Argentina is stationary at 5% according to Model A. In addition, China is stationary at 5% according to Model C. Other countries are not stationary at level and contain unit root.
Considering this results, convergence is related to unit root. In other words, there is stationary in Argentina and China. For this reason, there is income convergence in two countries. But the results are not stable in other countries. For this reason, we say that there is no income convergence in these countries.
In Table 2, breaks generally occurred between 1979 and 1984. Increase in oil prices adversely affected economies in 1974. Oil prices increase four times in this term. Stagflation has occurred.
Because inflation and unemployment increased together, theories applied to economic policies was abandoned in the past years. This is called first oil crisis. This problem continued until 1980. Then, second oil crisis broke out in 1980. For this reason, we can explain that breakings comparatively are much more between 1979 and 1982.
5. CONCLUSION
Turkey has faced many crises in the past 70 years. Considering to results, breaking is seen in 1979. There is also a crisis occurred in 1978 in Turkey history. Being $ 1.8 billion debt in 1970, Turkey increased to $ 10 billion in 1977. Share of short-term debt in total debt reached 52% in 1978. Therefore, another crisis broke out in 1978. Turkish Lira was devalued many times in this term. These rates are as follows; 10% in 1977, 29.9% in 1978, 77.7% in 1979 and 48.6% in 1980. Although there is many crises in Turkey and world, the biggest crisis affected Turkey is 1978 crisis.
REFERENCES
Abramowitz, M. (1986), Catching up, forging ahead and falling behind. Journal of Economic History, 46(2), 385-406.
Apergis, N., Christou, C. (2016), Energy productivity convergence: New evidence from club converging. Applied Economics Letters, 23(2), 142-145.
Apergis, N., Cooray, A. (2014), Convergence in sovereign debt ratios across heavily indebted EU countries: Evidence from club convergence. Applied Economics Letters, 21(11), 786-788. Barath, L., Fertö, I. (2017), Productivity and convergence in European
agriculture. Journal of Agricultural Economics, 68(1), 228-248. Baumol, W.J. (1986), Productivity growth, convergence, and welfare:
What the long-run data show. The American Economic Review, 76(5), 1072-1085.
Brenner, T., Kauermann, G. (2016), Specialization and convergence of industry-specific employment in germany: A linear mixed-model approach with spatial components. Regional Studies, 50(2), 326-341. Breuer, J.B., Hauk W. Jr., McDermott, J. (2014), The return of convergence
in the US states. Applied Economics Letters, 21(1), 64-68. Cavenaile, L., Dubois, D. (2011), An empirical analysis of income
convergence in the European union. Applied Economics Letters, 18(17), 1705-1708.
Choi, H., Li, H. (2000), Economic development and growth convergence in China. The Journal of International Trade and Economic Development, 9(1), 37-54.
D’Uva, M., Siano, R. (2011), Time series approaches to Italian regional convergence. Applied Economics, 43(29), 4549-4559.
Dawson, J.W., Strazicich, M.C. (2010), Time-series tests of income convergence with two structural breaks: Evidence from 29 countries. Applied Economics Letters, 17(9), 909-912.
Desli, E. (2009), Convergence and efficiency: Evidence from the EU-15. Journal of Post Keynesian Economics, 31(3), 403-430.
Güriş, S., Güriş, B., Tıraşoğlu, M. (2017), Do military expenditures converge in NATO countries? Linear and nonlinear unit root test evidence. Theoretical and Applied Economics, 24(2), 237-248. Lee, J., Strazicich, M.C. (2013), Minimum LM unit root test with one
structural break. Economics Bulletin, 33(4), 2483-2492.
Lei, C.K., Tam, P.S. (2010), A panel data approach tothe income convergence among mainland China, Hong Kong and Macao. Journal ofthe Asia Pacific Economy, 15(4), 420-435.
Liu, H., Wang, L. (2010), Time series analysis of income convergence in
Table 1: Structural single fracture LM critical values
Model A
1% 5% 10%
−4.239 −3.566 −3.211
Model C
Λ 1% 5% 10%
0.1 −5.11 −4.50 −4.21
0.2 −5.07 −4.47 −4.20
0.3 −515 −4.45 −4.18
0.4 −5.05 −4.50 −4.18
0.5 −5.11 −4.51 −4.17
Reference: Lee and Strazicich
Table 2: Regression results
Country LM-Stat Break date Franction
Argentina −3.787 1984 0.439
Brazil −2.208 1982 0.404
China −4.543 1975 0.281
European Union 0.017 1982 0.404
France 0.127 1982 0.404
Indonesia −2.495 1999 0.702
India −1.077 1973 0.246
Italy −2.040 1971 0.211
Japan −1.345 1069 0.175
Mexico −1.423 1994 0.614
South Africa −1.397 2001 0.737
Turkey −2.664 1979 0.351
United Kingdom −2.260 1982 0.404 United States −2.385 2007 0.842
Canada −1.844 1972 0.228
Saudi Arabia −1.961 1993 0.694
Korea, Rep. −2.636 1979 0.351
Germany −1.396 1991 0.681
China. Applied Economics Letters, 17(1), 25-29.
Özgüzer, G.E., Binatlı, A. (2016), Economic convergence in the EU: A complexity approach. Eastern European Economics, 54(2), 93-108. Ram, R. (2017), Comparison of cross-country measures of
sigmaconvergence in per-capita income, 1960–2010. Applied Economics Letters. Available from: https://www.Doi.Org/10.1080/ 13504851.2017.1391992.
Robinson, T. (2007), The convergence of electricity prices in Europe. Applied Economics Letters, 14(7), 473-476.
Savoia, A., Sen, K. (2016), Do we see convergence in institutions? A cross-country analysis. The Journal of Development Studies, 52(2), 166-185. Solarin, S.A., Ahmed, E.M., Dahalan, J. (2014), Income convergence
dynamics in ASEAN and SAARC Blocs. New Zealand Economic Papers, 48(3), 285-300.
Solow, R.M. (1956), A contribution to the theory of economic growth. Quarterly Journal of Economics, 70(1), 65-94.
Tselios, V. (2009), Growth and convergence in income per capita and income inequality in the regions ofthe EU. Spatial Economic Analysis, 4(3), 343-370.
Ünlü, H., Bozdağ, H. (2016), “Manufacturing industry exports and economic growth relationship in the case of structural break: A case study for turkey. International Journal of Social Sciences and Education Research, 2(1), 92-102.
Wang, M.S. (2012), Income convergence within ASEAN, ASEAN+3: A panel unit root approach. Applied Economics Letters, 19(5), 417-423.
Webber, D.J. (2001), A slowing of national income convergence. Applied Economics Letters, 8(11), 709-711.