Turkish Journal of Fisheries and Aquatic Sciences 12: 453-460 (2012)
www.trjfas.org ISSN 1303-2712 DOI: 10.4194/1303-2712-v12_2_36
© Published by Central Fisheries Research Institute (CFRI) Trabzon, Turkey in cooperation with Japan International Cooperation Agency (JICA), Japan
The Pollution Status of Bottom Surface Sediments Along the Turkish Coast
of the Black Sea
Introduction
Accumulation of metals in marine sediments causes enrichment and a pollution source for the ecosystem. Unlike many organic pollutants, metals do not degrade, but remain in the environment and transport from one place to another. Metals may be transport directly or via river and atmosphere from natural sources (e.g. weathering and erosion of rocks, soil) and anthropogenic activities such as discharging from mining activities, industrial processes, domestic waste, storm water including plant debris, fine soils, direct dumping, agricultural waste (Guieu et al., 1991; Kubilay, Yemenicioğlu and Saydam, 1995; Tuncer et al., 1998; Ergül et al., 2008; Özşeker and Erüz, 2011). Transportation and deposition ways of the dissolved and particulate matter - including some factors such as differences in solubility of compounds, adsorption processes and the activity of organisms determine the fate of the contaminants in the marine environment.
Metals are mainly removed by adsorption/absorption onto both organic and inorganic particles by physically and/or chemically. Adsorption is related with the interactions of the solute, solvent and their surfaces and effects the distribution of elements, the electrostatic properties of suspended matter, which provides aggregation and transport, and reactivity of surfaces such as dissolution, precipitation (Westall, 1987; Gibbs, 1986).
The Black Sea is an almost enclosed sea, which is only linked to the Mediterranean Sea through the İstanbul (Bosporus) and Çanakkale (Dardanelles) Straits. There are many direct and indirect discharges such as riverine, industrial, agricultural and domestic sewage which influence the pollution of the coastal areas.
Many previous works in different times and regions indicated that the anthropogenic and natural inputs occur synchronously and are changing continuously and influencing the geochemistry of
Mürşide Sur1,*, Halil İ. Sur1, Reşat Apak1, Erol Erçağ1
1 Istanbul University, Institute of Marine Science and Management, Müşküle Sokak, No: 1, Vefa, 34116, Istanbul, Turkey.
* Corresponding Author: Tel.: +90.212 4400000/26056; Fax: ; E-mail: mursidesur@istanbul.edu.tr
Received 15 March 2012 Accepted 6 July 2012
Abstract
The aim of this work is to assess the sediment pollution by contamination factor (Cf) of metals and degree of
contamination (CD) of stations. Sediment samples were collected from 26 stations in autumn 2010 and analyzed for metals
(Al, Cd, Cu, Pb, V, and Hg). The degree of contamination is estimated as very high at one station, considerably high at nine stations, moderately high at fifteen stations and low at one station. This study also helps to classify the contaminants whether they are anthropogenic or not.
Keywords: Metal, contamination factor, degree of contamination, anthropogenic
Karadeniz'in Türkiye Kıyıları Boyunca Deniz Tabanı Yüzey Sedimentlerindeki Kirllilik Durumu
Özet
Bu çalışmanın amacı; metallerin kirlilik faktörü (Cf) ve istasyonların kirlilik derecesini (CD) belirleyerek sediment
kirliliğinin değerlendirmesini yapmaktır. 2010 sonbaharında 26 istasyondan sediment örnekleri toplanmış ve Al, Cd, Cu, Pb, V, Hg metalleri için analiz edilmiştir. Kirlilik derecesi bir istasyonda çok yüksek, dokuz istasyonda oldukça yüksek, onbeş istasyonda orta derecede yüksek ve bir istasyonda düşük bulunmuştur. Bu çalışma, kirleticilerin antropojenik olup olmadığını belirlemede de yardımcı olmaktadır.
454
sediments. Therefore, distinguishing the sources is difficult. Some pollution assessments of metals in different regions were applied to sediments by combining with specified parameters. These parameters were compared the metal content of the samples with reference (background) values for each metal (Hakanson, 1980). Ridgwaya et al. (2003) differentiated the anthropogenic and natural inputs with the geochemistry of materials while Wu et al. (2007) combined the geochemical and statistical methods.
In this paper, latest concentrations of the metals (Al%; Cd, Cu, Pb, Hg, V µg/gr) in surface sediments are presented along the Turkish coasts of the Black Sea. The possible sources, enrichment and contributions of each metal to sediment contamination are investigated by calculating contamination factor and contamination degree parameters. The measurement of vanadium concentration in surface sediment will contribute the identification of the anthropogenic and natural sources with other metals.
Sampling and Methods
Surface sediments were collected in autumn 2010 from the Turkish coasts of the Black Sea with a van Veen type grab sampler. Sampling locations are shown in Figure 1.
Analytical Methods
EPA Method 3051a, was used to determine metals in sediment. Dried and homogenized sediments digested in MARS 5 microwave digestion oven and metals were analized by inductively coupled plasma optical emission spectroscopy (ICP-OES) .
Mercury (Hg) was analyzed by cold vapor atomic adsorption spectroscopy (CV-AAS) (Standard method-3112B) (Clesceri et al., 1998).
Statistical Methods
Hakanson (1980) suggested some parameters; contamination factor (Cf) and degree of contamination
CD; to estimate the sediment pollution within a basin.
Cf is the ratio of the metal concentration in the
sediment to the reference (background) value for the substance and indicates the enrichment or contamination of a substance. The sum of all contamination factors illustrates the degree of sediment contamination for investigated area.
Pearson’s Correlation coefficients (r) are calculated to determine relationships among different metals implying that r (rho): -1.0 (inverse); 0.0 (no); 1.0 (positive) correlations (www.texasoft.com/ winkpear.html).
Results and Discussion
Metal concentrations are used for calculations of Cf and CD but they are not tabulated. The maximum
and minimum metal concentrations for Aluminum are varied: between 14.52-2.30(%) ; Cadmium: 1.04-0.03 (µg/g); Copper: 407.93-2.87 (µg/g); Lead: 79.78-2.51(µg/g); Mercury: 2.86-0.47 (µg/g); Vanadium: 1215.81-10.82 (µg/g).
Correlation results showed that there is no perfect relation between the elements. But moderately positive relationships were found for the pairs of Cu-Pb (0.65), Cu-Cd (0.59), Cu-V (0.46), Cu-Pb-V (0.43), Pb-Cd (0.37), V-Cd (0.37), Pb-Al (0.35).
Pollution Status of the Stations with Respect to Cf and CD
According to Hakanson (1980), the results are specified with Cf of each metals and CD of stations. Cf
and CD values are given in Table 1 and the criteria for
Cf and CD are described in Table 2. To obtain a better
view to the pollution status of investigated stations, the Cf and CD results in Table 1 are summarized in
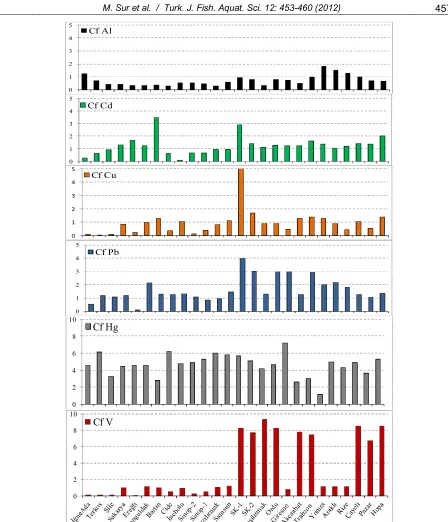
Table 3. Distributions of Cf and CD are shown in
Figure 2 and Figure 3 respectively.
The pollution status of the stations may be described in the following order:
1- Very high degree pollution: The station SK-1 was found to be highly contaminated. The dominant pollutants were V and Cu with very high Cf values.
Figure 1. Locations of the sampling stations along the Black Sea coast of Turkey.
455
Contamination levels were considerable for Hg and Pb, and moderate for Cd, low for Al.
2- Considerable degree pollution: All contaminated stations are located in the Eastern Black Sea (Figure 3). Hg in Giresun and V in other stations are strongly contributed to pollution. The significant pollutants for SK2 were Hg>Pb. Cf of Cu was low in
Giresun and Pazar and moderate in other stations. The contribution of metal pollution in descending order is V>Hg>Cu> Cd=Pb> Al.
3- Moderate degree pollution: Araklı found more polluted than the other stations in this group. Hg was the dominant pollutant with very high Cf values
at Kızılırmak, Cide, Terkos and with considerable Cf
values at most of the stations. Cd (except Bartın), Cu, Pb, V and Al were appeared with moderately and/or low Cf values.
4- Low degree pollution: Only Şile was in this group.
Assessment of Pollution
The Turkish Black Sea coasts are very steep and rocky and intersected with many rivers and streams. They are flowing with high load from the mountains where a large number of mine mineralization and sometimes flooding in rainy seasons. Main rivers and streams with high load of some pollutants such as Sakarya, Gülüç, Filyos, Bartın, Kızılırmak, Yeşilırmak, Melet, Aksu, Söğütlüdere, Değirmendere, Melen (Tuncer et al., 1998) flow to the sea. The currents play important role to transport material. For example: Danube is the most known among the other European rivers which flows into the Black Sea and meanders of the river effluent are detected and there are the some semi-permanent anticyclonic eddies between the cyclonic boundary current which flows from west to east, and the waves of the coast (Sur et al., 1994). The western coast of the Black Sea is not Table 1. Contamination factors (Cf) of metals and degree of sediment contamination (CD) of the Black Sea along Turkish
Coast.
Stations Cf CD
Al Cd Cu Pb Hg V
İğneada 1.26 0.27 0.12 0.54 4.55 0.13 6.87
Terkos 0.71 0.63 0.05 1.19 6.13 0.16 8.86
Şile 0.45 0.90 0.11 1.11 3.28 0.16 5.99
Sakarya R 0.44 1.30 0.83 1.20 4.43 1.00 9.19
Ereğli 0.34 1.67 0.23 0.13 4.55 0.08 6.99
Zonguldak 0.32 1.23 0.97 2.15 4.55 1.17 10.39
Bartın 0.36 3.47 1.28 1.28 2.83 0.98 10.19
Cide 0.29 0.63 0.38 1.27 6.23 0.56 9.36
İnebolu 0.52 0.10 1.06 1.33 4.78 0.92 8.69
Sinop-2 0.52 0.67 0.13 1.08 4.93 0.31 7.62
Sinop-1 0.48 0.67 0.39 0.87 5.30 0.57 8.28
Kızılırmak R 0.30 0.93 0.81 0.97 6.03 1.08 10.11
Samsun 0.61 0.93 1.12 1.48 5.83 1.24 11.21
SK-1 0.93 2.90 7.16 3.99 5.70 8.23 28.90
SK-2 0.78 1.40 1.70 3.04 5.10 7.72 19.75
Yeşilırmak R 0.34 1.13 0.91 1.30 4.15 9.35 17.19
Ordu 0.78 1.27 0.91 2.97 4.63 8.24 18.80
Giresun 0.74 1.23 0.48 2.97 7.15 0.82 13.40
Akçaabat 0.50 1.23 1.28 1.25 2.63 7.82 14.70
Trabzon 0.96 1.63 1.39 2.93 2.98 7.43 17.31
Yomra 1.82 1.37 1.27 2.02 1.18 1.12 8.77
Araklı 1.52 1.07 0.92 2.18 4.98 1.17 11.83
Rize 1.29 1.20 0.43 1.80 4.33 1.16 10.20
Çayeli 0.99 1.40 1.05 1.26 4.90 8.56 18.16
Pazar 0.71 1.37 0.55 1.06 3.68 6.71 14.07
Hopa 0.67 2.00 1.39 1.37 5.28 8.50 19.20
Reference* 1 1 1 1 1 1 6
*Krauskoff, 1967
Table 2. Descriptive criteria of the Cf and CD (Hakanson, 1980).
Cf CD Description
Cf <1 CD < 6 Low degree of contamination
1≤ Cf <3 6 ≤ CD < 12 Moderate degree of contamination
3 ≤ Cf < 6 12 ≤ CD < 24 Considerable degree of contamination
456
industrialized when compared to eastern coast. The main industrial organizations are the iron – steel plants and power plant (Zonguldak; coal- fired ), (Hopa; fuel-oil fired), copper smelting (Zonguldak, Samsun, Murgul), paper (Zonguldak, Giresun), fertilizer (Samsun), industrial chemicals, food, textile, cigarettes, tea plant, hazelnut, cement, leather, manufacturing weapons. Fishery is very important in most of the cities. Metals are used and discharged in the effluents of many facilities such as smelters or mining and metal based industries (Al, Cd, Cu, Pb, V, Hg), batteries (Cd, Pb, Hg), paint pigment (Cd, Cu, Pb, Hg, V), petroleum refineries and coal manufacturing or burning of fossil fuel (V, Pb, Hg, Cd), water treatment and pipe systems (Al, Cu, Pb), agricultural to prevent disease or fertilizer (Cu, Pb, Hg, Cd), catalyst (Hg, V), medical and pharmaceutics (Al, Hg), paper mills (Hg), ammunition (Pb) cigarettes (Cd) (Clesceri et al., 1998).
Aluminum was not effective as a pollutant because Cf of Al for 22 stations were low (Figure 2).
Aluminum is an aeolian and hydrolytic scavenging (rapidly removed by adsorption onto particles) element. Al can be found naturally in some rocks and mine effluents and the mineral type of soil in the investigated area is effected the distribution of the sediment type. During weathering of silicates (mainly hydrolysis reaction), new clay minerals can be formed
together with cations and silicic acid in solution (Krauskopf, 1967). The moderate enrichment of Al can be attributed to weathering of kaolin (alumina silicates), bentonite and mining activities near Yomra, Araklı, Rize, and quartz sand mines near İğneada (www.mta.gov.tr).
Cadmium, Copper and Lead were not enriched very much at most of the stations. Enrichment of metals (Cu> Pb>Cd) at SK1 is caused by discharging of untreated industrial effluent from copper smelting and fertilizer plants (IFC, 2007). Positive correlation results showed that Cu, Pb, Cd sources may be common. This agrees with the existence of cadmium in soils and rocks as sulfide minerals and obtaining during production of other metals like zinc, lead, and copper (www.mta.gov.tr).
Cadmium contamination was highest at Bartın (Figure 2). The source of Cd may be the Filyos River, which has higher load of Cd than of Bartın River (Tuncer et al., 1998) and carried from west to east by the currents. Secondly, Bartın river is polluted by many kind of wastes such as industrial plants (established near the mouth of the river), domestic, agricultural activities and navigation on the river, and a big flooding in 1998 is caused to many damage including land lose (Çelikyay and Cengiz, 2006). So, many anthropogenic pollutants - cadmium containing batteries, fertilizer, paints with previously settled in Table 3. Ranking order of sediment contamination of the investigated stations according to CD values and sequence of the
contamination factors (Cf).
Stations Contamination factor Cf
Cf > 6 Very High 3 < Cf < 6 Considerable 1< Cf <3 Moderate Cf <1 Low
D egr ee of c o nt am in at ion Very high CD > 24
SK-1 V>Cu Hg>Pb Cd Al
C ons ide ra b le 12 < C D < 24
SK-2 V Hg>Pb Cu > Cd Al
Hopa V Hg Cd>Cu>Pb Al
Ordu V Hg Pb>Cd Cu>Al
Çayeli V Hg Cd>Pb>Cu Al
Trabzon V - Hg>Pb>Cd>Cu Al
Yeşilırmak V Hg Pb>Cd Cu>Al
Akçaabat V - Hg>Cu>Pb>Cd Al
Pazar V Hg Cd>Pb Al>Cu
Giresun Hg - Pb>Cd V>Al>Cu
M od er at e 6 < C D < 12
Araklı - Hg Pb>Al>V> Cd Cu
Samsun - Hg Pb>V>Cu Cd>Al
Zonguldak - Hg Pb>Cd>V Cu>Al
Rize - Hg Pb>Al>Cd>V Cu
Bartın - Cd Hg>Cu=Pb V>Al
Kızılırmak Hg - V Pb>Cd> Cu>Al
Cide Hg - Pb Cd>V>Cu>Al
Sakarya - Hg Cd>Pb>V Cu>Al
Terkos Hg - Pb Al>Cd>V>Cu
Yomra - - Pb>Al>Cd>Cu>Hg>V -
İnebolu - Hg Pb>Cu V>Al>Cd
Sinop-1 - Hg - Pb>Cd>V>Al>Cu
Sinop-2 - Hg Pb Cd>Al>V>Cu
Ereğli - Hg Cd Al>Cu>Pb>V
İgneada - Hg Al Pb>Cd>V>Cu
Low CD < 6
457
0 1 2 3 4 5
Cf Al
0 1 2 3 4 5
Cf Cd
0 1 2 3 4 5
Cf Cu
0 1 2 3 4 5
Cf Pb
0 2 4 6 8 10
Cf Hg
0 2 4 6 8 10
Cf V
Figure 2. Distribution of the contamination factors of metals in surface sediments along the Turkish coastline of the Black Sea.
458
the riverbed- are swept into the sea bottom because of the high river discharge after storm events (Puig et al., 1999).
Cd was also moderately enriched at some stations Hopa> Ereğli> Trabzon because of the mining and/or smelting of Cu-Pb-Zn. In addition; coal-fired power plant at Ereğli can be influenced the contamination of Cd remained in ash (Ergül et al., 2008).
Copper enrichment for other stations (except SK1, SK2) was generally low and some were near the borderline of the moderate and low degree Cf values
(Figure 2) and may be caused by local small copper mining activities at Trabzon, Hopa, İnebolu or carried via rivers by weathering the soil as a result of high rainfall.
However, accumulation of Pb was higher than Cd and Cu for Zonguldak, Ordu, Giresun and Trabzon (Figure 2). This can be related with the changing mineral content of ore and metal inputs, for example; the % of Pb is 3 or 8 times higher than Cu in Pb-Zn reserved in some region of Trabzon, Ordu and Giresun (www.mta.gov.tr). Some small enrichment can be caused in city centers by anthropogenic Pb (used in fuel as an anti-knock), transported via Aeolian dust (Whitfield and Turner, 1987). Cu, Pb both tend to combine with sculpture but their mobilizations are different i.e. while Cu easily passes to the water phase by dissolving as Cu +2 ions, Pb retains in the medium (www.mta.gov.tr). In addition, enrichment of Pb can be the result of emission of coal burning in power plant at Zonguldak.
Vanadium is enriched very much (Cf > 6) in
most of the eastern stations (Yeşilırmak>Çayeli>Hopa>SK1>Ordu>SK2>Akçaab at>Trabzon>Pazar) sediments (Figure 2, Table 3). Vanadium can be found in the earth's crust and in rocks, some iron ores – trapped in ferromagnesian rock, and crude petroleum as vanadium porphyrins. It is not mined in Turkey, but vanadium minerals are known in ore such as Vanadinite (Pb5(VO4)3Cl),
descloizite (Pb(Zn,Cu)VO4.OH), carnatite
K2(UO2)2(VO4)2. 1-3H2O, patronite VS4
(www.mta.gov.tr). As mentioned above, moderately positive correlations are determined between pairs of V-Cu >V-Pb> V-Cd. Therefore, it can be mobilized from mining processes and/or because of weathering by river runoff or storm water. In some cities, the ship traffic is very high and because of the oil pollution, V can increase by bacterial degradation of crude oil (Uysal, 2006). It has high affinity against organic compounds and make organic complexes and not soluble in reducing environment. Biogenic migration of vanadium is also important because it is used by organisms (e.g. tunicates) and some marine algae when they died, these organisms remain in the sediment and caused enrichment of vanadium (Krauskopf, 1967). The accumulation of V at SK-1 was related with industrial waste such that it is used as a catalyst during production of sulfuric acid, which
is necessary to produce phosphate fertilizer (IFC, 2007).
Mercury contributed the pollution at most of the stations (Figure 2). Hg can be found as elemental and because of its strong affinity to sulfide, organic matter and suspended sediment it is combined with sulfide and formed less soluble cinnabar HgS (the chief source) (Clesceri et al., 1998) and methylated in sediments. Baeyens et al. (1998) mentioned that Hg concentration in sediment is high during autumn and winter because of the scavenging of Hg with sulfide (produced by sulfate reducing bacteria) and the sulfate reducing rates of organisms are influenced with temperature. The main polluting source could be a chlor-alkaline plant, which uses Hg as a catalyst. However, there was no any big chlor-alkali plant but other industrial application of Hg can be a source. Some other sources can be caused to increase Hg contamination. Naturally, Hg enters from the degassing of the earth crust and by geothermal sources such as hot springs (Sabadell and Axtmann, 1975). Cinnabar can be found with some minerals such as pyrite, stibnite, realgar, chalcedony, calcite, quartz and barite in the fractures and fissures of sedimentary rocks near volcanic activity and hot springs (www.mta.gov.tr). Mercury is not produced from its ore in the region but there are many mineral ores along the coasts of the Black Sea that can be less visible source for Hg and enter from other mining activities of above-mentioned minerals or from weathering processes. Hot springs in Ordu, Samsun, Rize, and Zonguldak can be sources for Hg enrichment, too.
In most of the cities along the coast of the Black Sea, Hg can be emitted from the irregular storage of garbage waste (including batteries, thermometers, amalgam wastes etc.) and from agricultural areas because of pesticides, and fungicides. An old mine at Kastamonu –Bozkurt, can be also a source in Cide for mercury emissions. Mercury has been used in marine paints in the past like lead, copper, cadmium as antifouling but still can be another less visible source for sediment (Johnsen and Engøy, 2000). Because, fishery is very important sector in the region and so ship activities are caused to increase the pollution. Coal is another source for Hg especially in the coal region Zonguldak and in western parts of the Black Sea (Terkos, İğneada). Because Hg is a coal-phile element and tends to combine strongly with humic matter, and accumulates in peats and lignites (Yudovich and Ketris, 2005). This tendency is effected the enrichment of Hg in Yeşilırmak together with other sources. Maximum enrichment of Hg was at Giresun. This may be caused by barite ore and together with other sources such as; garbage, paper mill (Hg is used to retard the mold) near the bank of the river mouth at Giresun.
459
results of Ergül et al. (2007) at around Yomra while Pb was nearly the same. According to Özşeker and Erüz (2011), Cu values of Akçaabat and Yomra stations were smaller and Pb was smaller at Yomra but higher at Akçaabat than this study. The measured Cu and Cd concentrations around Samsun were higher than the results of Bakan and Özkoç (2007), while Pb was approximately the same except near Yeşilırmak. Generally, there is an increasing trend of pollution around the same locations.
The results confirmed that the Turkish Black Sea coast is facing an environmental pollution especially due to some heavy metals with high enrichment ratio. Briefly; contribution to pollution decreased in the order of Hg> V> Pb> Cd> Cu> Al. Samsun region was highly polluted with industrial wastes. Eastern Black sea found to be as considerably polluted while Western Black Sea is moderately polluted.
The present study indicated the impact of natural sources (erosion, flood) as well as anthropogenic inputs (mining, industrial). The erosion, flooding must be controlled by building stream bank fences, reducing impervious surfaces, stopping deforestation, strip cropping etc., and treatment of waste water is necessary for industrial and domestic wastes.
References
Baeyens, W., Meuleman, C., Muhaya, B. and Leermakers, M. 1998. Behavior and speciation of mercury in the Scheldt estuary (water, sediments and benthic organisms). In: W.F.J. Baeyens (Ed.), Trace Metals in the Westerschelde Estuary: A Case-Study of a Polluted, Partially Anoxic Estuary. Hydrobiologia, 366: 63–79.
Bakan, G. and Özkoç, H.B. 2007. An ecological risk assessment of the impact of heavy metals in surface sediments on biota from the mid-Black Sea coast of Turkey. International Journal of Environmental Studies, 64(1): 45-57.
DOI: 10.1080/00207230601125069
Clesceri, L.S, Greenberg, A.E. and Eaton, A.D. (Eds.). 1998. Standard Methods for the Examination Water and Wastewater, 20th Ed., American Public Health Association (APHA, AWWA, and WEF) Washington, D.C.: 3-22.
Çelikyay, S. and Cengiz, B. 2006. Ecological Planning Strategies on Bartın River region. 5th WSEAS, International conference on Environment, November 20-22. Ecosystem and Development, Venice, Italy. Ergül, H.A., Topçuoğlu, S., Ölmez, E. and Kırbaşoğlu, Ç.
2008. Heavy metals in sinking particles and bottom sediments from the eastern Turkish coast of the Black Sea. Estuarine, Coastal and Self Science, 78: 396-402. doi:10.1016/j.ecss.2008.01.006
Ergül, H.A., Alkan, D. and Topçuoğlu, S. 2007. Trace metals in mussel and sediment samples from southern coast of the Black Sea. Rapp. Comm. Int. Mer Médit., 38, 2007. Retrieved from http://www.ciesm.org/ online/archives/abstracts/pdf/38/PG_00254.pdf Gibbs, R.J. 1986. Segregation of metals by coagulation in
estuaries. Mar. Chem., 18: 149-159. doi:10.1016/0304-4203(86)90004-6
Guieu, C., Martin, J.M., Thomas, A.J. and Elbaz-poulichet, F. 1991. Atmospheric versus river inputs of metals to the Gulf of Lions: Total concentrations, partitioning and fluxes. Mar. Poll. Bull., 22(4): 176-183.
doi:10.1016/0025-326X(91)90467-7
Hakanson, L. 1980. An ecological risk index for aquatic pollution control. A sedimentological approach. Water Research, 14: 975-1001.
doi:10.1016/0043-1354(80)90143-8
International Finance Corporation (IFC) 2007. Environmental, Health and Safety Guidelines for Phosphate Fertilizer Manufacturing. Retrieved from http://www1.ifc.org/wps/wcm/connect/c24fb6804885 5759bc24fe6a6515bb18/Final%2B-%2BPhosphate %2BFertilizer%2BPlants.pdf
Johnsen, A. and Engøy, T. 2000. Contamination from marine paints- A Norwegian perspective. Retrieved from http://ftp.rta.nato.int/public//PubFulltext/RTO/ MP/RTO-MP-039///MP-039-23.pdf
Krauskopf, K.B. 1967. Introduction to geochemistry. International Series in the Earth and planetary sciences. Mc Graw-Hill, USA
Kubilay, N., Yemenicioğlu, S. and Saydam, A.C. 1995. Airborne material collections and their chemical composition over Black Sea. Mar Pollut. Bull 330, 475-483. Retrieved from htpp:www.ims.metu.edu.tr /cv/kubilaynilgun/science-MPB.pdf
Özşeker, K. and Erüz, C. 2011. Heavy Metal (Ni, Cu, Pb, Zn) Distribution in sediments from the coast of Trabzon in the Black Sea. I J of Geo-Marine Sciences. 40(1): 48-54. Retrieved from http://nopr.niscair.res.in /bitstream/123456789/11368/4/IJMS%2040(1)%2048 -54.pdf
Puig, P., Palanques, A., Sanchez-Cabeza, J.A. and Masque, P. 1999. Heavy metals in particulate matter and sediments in the southern Barcelona sedimentation system (North-western Mediterranean) Mar. Chem, 63: 311-329. doi:10.1016/S0304-4203(98)00069-3 Ridgwaya, J., Breward, N., Langston, J., Lister, R., Rees,
J.G. and Rowlatt, S.M. 2003. Distinguishing between natural and anthropogenic sources of metals entering the Irish Sea. Appl. Geochem., 18: 283-309. doi.10.1016/S0883-2927(02)00126-9
Sabadell, J.E. and Axtmann, R.C. 1975. Heavy metal contamination from geothermal sources. Environmental Health Perspectives, 12: 1-7.
Sur, H.I., Özsoy, E. and Ünlüata, Ü. 1994. Boundary current instabilities, upwelling, shelf mixing and eutrophication in the Black Sea. Prog. Oceanog., 33: 249-302.
Tuncer, G., Karakas, T., Balkas, T., Gökçay, C., Aygun, S., Yurteri, C. and Tuncel, G. 1998. Land-based sources of pollution along the Black Sea coast of Turkey: concentrations and annual loads to the Black Sea. Mar. Pollut. Bull., 36: 409–423. Retrieved from http://www.sciencedirect.com/science/article/pii/S002 5326X97002051
Uysal, A. 2006. Ham petrol fraksiyonlarının biyolojik bozunma sonrası fizikokimyasal özelliklerinin değişimi. MSc thesis. SDU, Science Institute, Isparta. Westall, C.J. 1987. Adsorption mechanism in aquatic
surface chemistry. In: W. Stumm (Ed.), Aquatic Surface Chemistry: Chemical Processes at the particle-water interface. Stumm-Wiley, New York, 520 pp.
460
in regulating the composition of seawater. In: W. Stumm (Ed.), Aquatic Surface Chemistry: Chemical Processes at the particle-water interface. Stumm-Wiley, New York, 520 pp.
Wu, Y., Hou, X., Cheng, X., Yao, S., Xia, W. and Wang, S. 2007. Combining geochemical and statistical methods to distinguish anthropogenic source of metals in
lacustrine sediments: a case study in Dongjiu Lake, Taihu Lake catchment, China. Environ. Geol., 52: 1467-1474. doi: 10.1007/s00254-006-0587-4 Yudovich, Y.E. and Ketris, M.P. 2005. Mercury in coal: a