DOI
10.17219/acem/70081
Copyright
© 2018 by Wroclaw Medical University This is an article distributed under the terms of the Creative Commons Attribution Non-Commercial License (http://creativecommons.org/licenses/by-nc-nd/4.0/)
Address for correspondence
Agata Pająk E-mail: agata_pa@wp.pl
Funding sources
None declared
Conflict of interest
None declared
Acknowledgements
The authors would like to acknowledge Beata Kołaczyńska for her involvement in the laboratory diagnosis.
Received on August 30, 2016 Reviewed on February 15, 2017 Accepted on March 31, 2017
Abstract
Background. Refeeding Syndrome (RFS) is a well-known group of symptoms which occur after the intro-duction of enteral or parenteral nutrition in undernourished patients. Intrauterine growth restriction (IUGR) is the equivalent of postnatal RFS following the beginning of feeding. The aggressive parenteral nutrition of neonates with very low birth weight (VLBW) resulting from the termination of intrauterine transplacental nutrition is a source of biochemical disorders.
Objectives. The aim of this study was to analyze metabolic disorders in preterm infants during the 1st week of life and to determine the hypophosphatemia risk factors in low birth weight neonates receiving parenteral nutrition. The retrospective analysis covered 49 neonates, aged between 24 0/7 and 32 6/7 weeks of gestation. Material and methods. The examined patients were divided into 2 groups according to the level of phos-phates during the 1st week of life: HP (n = 18) with aggravated hypophosphatemia (≤3.1 mg/dL) and NP (n = 31) with normal phosphatemia (>3.1 mg/dL).
Results. Hypophosphatemia was observed in the first days of life in 61% of children, in 45% of whom a subsequent test revealed a further fall in the phosphate level. In the rest of the preterm neonates (39%), hypophosphatemia was revealed between the 4th and 7th day of life. The risk of early hypophosphatemia was higher in neonates with IUGR (p = 0.0001; RR 5.2, 95% CI 2.2–12.4) and extremely low birth weight (ELBW) preterm infants (p < 0.05).
Conclusions. Early hypophosphatemia should be closely monitored early in life, especially in newborns with ELBW and IUGR. Further research is needed to develop an optimal nutritional regimen from the first days of life. Key words: nutrition, neonatology, hypophosphatemia, metabolic, preterm infant
Early hypophosphatemia in very low birth weight preterm infants
Agata Pająk
B–D, Barbara Królak-Olejnik
A,D–F, Agnieszka Szafrańska
A,C,DDepartment and Clinic of Neonatology, University Hospital, Wroclaw Medical University, Poland
A – research concept and design; B – collection and/or assembly of data; C – data analysis and interpretation; D – writing the article; E – critical revision of the article; F – final approval of the article
Introduction
Nutrition is an essential element in the intensive care of preterm newborns. Not only does it affect the results of treatment, but it also influences susceptibility to dis-eases in adulthood and it has lifelong cognitive impact. The aim of administering aggressive parenteral nutrition is to promote continued growth (increased weight and length) equivalent to that of a fetus’s normal intrauterine life.1–4 Refeeding Syndrome (RFS) is a well-known group
of symptoms which occur after the introduction of enteral or parenteral nutrition in undernourished patients. RFS can be prevented by the correction of electrolyte disorders and by vitamin B intake at the beginning of nutrition.5,6
The symptoms result from the quick conversion of cata-bolic metabolism to anaof cata-bolic – from the transformation of free fatty acids and ketones released during the trans-formation of bicarbonates as a primary source of energy.7,8
Intrauterine growth restriction is the equivalent of post-natal RFS after nutrition has begun. Aggressive parenteral feeding of neonates with very low birth weight (VLBW) resulting from the interruption of intrauterine transpla-cental nutrition is a source of biochemical disorders.
The term Placental Incompletely Restored Feeding syn-drome (PI-ReFeeding synsyn-drome) was proposed for preterm newborns because of the lack of adequate intake of other nu-trients in relation to amino acids and energy. Amino acids are responsible for an increase in the production of endogenous insulin. Insulin induces intracellular redistribution of phos-phates and potassium, which leads to the lowering of their concentration in blood serum. Moreover, the acceleration of anabolism results in the increased reprocessing of phos-phates and potassium.9 The clinical implication
of hypo-phosphatemia are multi-system disorders occurring mainly in energy-active organs; thus, heart or respiratory failure, muscle hypotension, neurological symptoms, hematologi-cal disorders, insulin-resistant hyperglycemia, or metabolic acidosis may occur. However, indications for the modifica-tion of the phosphate intake of nutrifor the modifica-tional treatment, which, according to current recommendations, are introduced on the 3rd day of a neonate’s life, have not yet been established.
The aims of this study were:
– to analyze metabolic disorders in preterm infants during the 1st week of life, especially
hypophospha-temia; and
– to determine the hypophosphatemia risk factors in low birth weight neonates receiving parenteral nutrition.
Material and methods
The research was carried out from August 2013 to July 2014 in the Neonatal Intensive Care Unit of the Depart-ment of Neonatology at the University Hospital in Wrocław. During this period, 2,316 neonates were hospitalized
in the department, 84 of whom were born before 33 0/7 weeks of gestation, which constituted 3.6% of all labors. The retrospective analysis covered 49 neonates aged be-tween 24 0/7 and 32 6/7 weeks of gestation. The study in-cluded children whose phosphate concentration was mea-sured at least twice during the 1st week of their lives: between
the 1st and 3rd day of life (M1), and between the 4th and 7th
day of life (M2). Patients with congenital malformations were excluded from the analysis. Two groups of neonates were identified by means of Fenton centile growth charts for preterm neonates: appropriate for gestational age (AGA) and small for gestational age (SGA).10
Starting parenteral nutrition sets were prepared by the hos-pital pharmacy and contained amino acids (1.5 g/kg), glucose and calcium (0.5 mmol/kg), but no phosphates. According to the Guidelines for Paediatric Parenteral Nu-trition published by the European Society for Paediatric Gastroenterology, Hepatology and Nutrition (ESPGHAN) in 2005, a minimum amino acid intake of 1.5 g/kg/day is necessary to prevent a negative nitrogen balance.11
Pa-tients in the study received amino acids (3.0 g/kg/day) and lipids (3 g/kg/day) from the 2nd day of life.
The patients received Glycophos (Fresenius Kabi, Up-psala, Sweden) in parenteral nutrition from the 2nd or 3rd
day of life (range: 2nd–5th day of life), according to current
recommendations.11
Phosphate supplementation was continued in the form of human milk fortifier and/or a sodium-phosphate mix-ture in all enterally-fed patients with hypophosphatemia. A phosphate level <4.4 mg/dL (1.4 mmol/L) in preterm neonates in the 1st week of life was diagnosed
as hypophos-phatemia. Severe hypophosphatemia was set at a phosphate level of <3.1 mg/dL (1 mmol/L), and hypocalcemia and hy-pomagnesemia were diagnosed at calcium and magnesium levels <8.0 mg/dL and 1.5 mg/dL, respectively. The bio-chemical tests on blood serum were performed using the Beckman Coulter analyzer (Beckman Coulter Polska Sp. z o. o., Warszawa, Poland) in the Department of Ana-lytical Laboratory of the University Hospital in Wrocław. The Bioethical Commission of Wroclaw Medical Uni-versity granted permission to carry out the retrospective analysis of the patients’ medical records.
The characteristics of the examined patients, divided into 2 groups according to the level of phosphates (HP – aggravated hypophosphatemia, ≤3.1 mg/dL; and NP – nor-mal phosphatemia, >3.1 mg/dL]) are presented in Table 1. Statistical analyses were performed using either version N-1 of the χ2 test for categorical variables,
The analysis was performed using Stargraphics Centurion XVII (Stargraphics Technologie Inc., Virginia, USA) and MedCalc v. 16.2 (MedCalc, Ostend, Belgium) for Windows.
Results
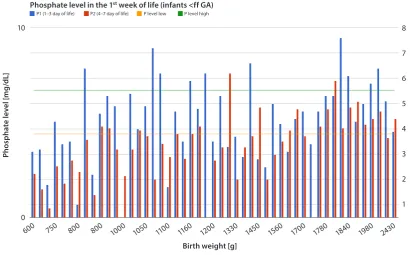
A phosphate concentration in blood serum within the prop-er laboratory range (4.4–6.7 mg/dL) was obsthe prop-erved in only 25% of infants. A value below the lower range limit was observed in 75% of neonates, and in 2 children (4%) phosphate concen-tration barely exceeded the upper range limit (Fig. 1).
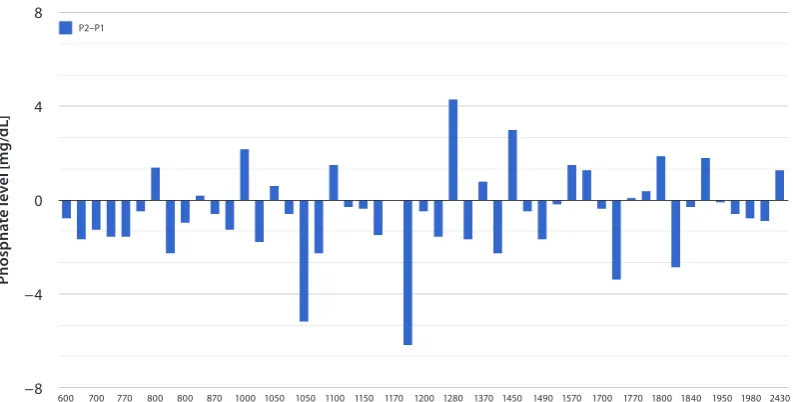
Hypophosphatemia was observed in the first days of life in 61% of children, in 45% of whom a subsequent test revealed a further fall in the phosphate level. In 39% of the examined preterm neonates, hypophosphatemia was recognized between the 4th and 7th day of life (Fig. 2).
On the basis of phosphate concentration, the neonates were divided into 2 groups: those with aggravated hypo-phosphatemia (≤3.1 mg/dL) and those with normal phos-phatemia (>3.1 mg/dL).
The median concentration of phosphates in 1–3-day-old newborns’ blood serum was 3.1 mg/dL in the HP group and 5 mg/dL in the NP group; however, in the tests
Table 1. Characteristics of the preterm infants: A comparison of HP and NP
Characteristics HP
(n = 18)
NP
(n = 31) RR 95% CI p-value
Gestational age weeks, mean ±SD 29.2 ±2.2 29.8 ±2.4 – 0.3576t
GA <28 HBd , n (%) 3 (17) 7 (23) CI 0.22–2.50RR 0.74 0.6215χ
Birth weight [g], mean ±SD 1029 ±315 1477 ±447 – 0.0005t
Small for gestational age, n (%) 11 (61) 3 (10) RR 6.32
CI 2.03–19.68 0.0002χ
TPN
initial glucose intake [g/kg/day], mean ±SD1 initial amino acids intake [g/kg/day], mean ±SD1 initial P intake [mmol/kg/day], median ( range)2 initial K intake [mmol/kg/day], median (range)2
8.97 ±1.24 2.72 ±0.31 3 (1–5) 3 (2–5)
8.89 ±1.21 2.69 ±0.45 4 (2–5) 4 (2–7)
– – – –
0. 8192t 0.7891t 0.7273M-W 0.0528M-W
Days of TPN (for survivors), median (range) 13 (5–30) 10.5 (3–35) – 0.3919M-W
Days of hospital stay (for survivors) 53 (31–89) 35 (15–104) – 0.0324M-W
HP – study group; NP – control group; n – number of patients; RR – relative risk; CI – confidence interval; SD – standard deviation; GA – gestational age; HBd – hebdomas; TPN – total parenteral nutrition; χ χ2 test; t Student’s t-test; M-W Mann-Whitney test.
Pho
sp
ha
te
le
ve
l [
m
g/
dL
]
Phosphate level in the 1st week of life (infants <ff GA)
Birth weight [g]
8
7
6
5
4
3
2
1
600
10
P1 (1–3 day of life) P2 (4–7 day of life) P level low P level high
0
750 800 800 1000 1050 1100 1160 1200 1330 1450 1560 1700 1780 1840 1980 2430
Fig. 1. Phosphate concentration in blood serum of preterm infants
carried out between the 4th and 7th day of life,
the con-centrations were 2.35 mg/dL (HP) and 5.5 mg/dL (NP). The lowest level of phosphates was observed up to the 10th
day of life (median: the 6th day of life). The neonates
re-ceived phosphates in parenteral nutrition from the 3rd day
of life (range: 2nd–5th day of life). Phosphorus
supplemen-tation was continued in the form of human milk fortifier and/or a phosphate-sodium mixture in all patients with hypophosphatemia.
There was a statistically significant relationship between the minimum level of phosphorus (Pmin) [mg/dL] and birth
weight [g] with a 95% CI; p-value <0.05 (p = 0.0000).
Pmin [mg/dL] = −14.6492 + 2.53301 × ln (birth weight [g])
The R2 value indicates that the model as fitted explains
46.3533% of the variability in Pmin [mg/dL] after
transform-ing to a Y/(1-Y) scale to linearize the model. The correlation coefficient equals 0.680833, indicating a moderately strong relationship between the variables (Fig. 3).
Neonates with intrauterine growth restriction (IUGR) (RR 5.2 95% CI 2.2–124; p = 0.0001) and extremely low birth rate (ELBW) (p < 0.05) were at risk of early hy-pophosphatemia; however, the difference in gestational age between the NP and HP groups was statistically insignificant.
Even though insulin, catecholamine and invasive ven-tilation were more frequently administered, and com-plications such as intraventricular hemorrhages (IVH), early infections, bronchopulmonary dysplasia (BPD), death, or biochemical disorders (hypertriglyceridemia, hypocalcemia or hyperglycemia) occurred more often in the HP group than in the NP one, they were statisti-cally insignificant.
Discussion
Considering the problem of hypophosphatemia in neo-nates, the question of how and when to diagnose it must be answered.
The assessment of hypophosphatemia is necessarily based on the level of phosphorus in serum; thus, it is vi-tal to be fully familiar with the normal range. It is also essential to bear in mind pre-analytical errors – sample hemolysis falsely increases the phosphate concentration results, as do hypertriglyceridemia and hyperbilirubinemia in intensive care unit patients. The phosphate concen-tration in a fetus’s blood may be adopted as the golden standard for determining a preterm neonate’s biochemical condition.12 Based on the assessment of phosphate
con-centration in 560 neonates’ umbilical blood, Fenton set referential values for preterm newborns and term-born babies dependent on gestational age within 4 age ranges. The lower range limit for preterm neonates with 28–31 weeks of gestation was 1.4 mmol/L, the same as in our study. However, the upper range limit in our study was higher than that in Fenton (2.7 vs 2.1 mmol/L). In neo-nates, the norms depend on gestational age; phosphate concentration in umbilical blood decreases with GA, while the level of sodium increases.
Adults are also considered to develop serious symptoms at phosphorus levels lower than 1–1.5 mg/dL (<0.32– –0.5 mmol/L).8,13 In the developmental period, however,
phosphatemia norms depend on age – the lower the age, the higher the norms. The highest values are observed in babies, so extrapolation seems inaccurate. Safe phospha-temia ranges in neonates, especially in VLBW ones, need to be determined in the near future. Both the frequency and intensity of the described disorders in a specific study
Pho
sp
ha
te
le
ve
l [
m
g/
dL
]
Birth weight [g] 8
4
0
−4
−8
P2–P1
600 700 770 800 800 870 1000 1050 1050 1100 1150 1170 1200 1280 1370 1450 1490 1570 1700 1770 1800 1840 1950 1980 2430 640 750 770 800 800 960 1020 1050 1050 1100 1160 1170 1250 1330 1380 1480 1560 1670 1720 1780 1810 1890 1980 2300
P m
in [
m
g/
dL
]
Simple regression – Pmin vs birth weight
Pmin [mg/dL] = −14.6492 + 2.53301 × In (birth weight [g])
Fig. 3. Relationship between Pmin [mg/dL] in blood serum during the 1st week of life and birth weight [g] of the preterm infants Birth weight [g]
6
5
4
3
2
1
0
0 500 1000 1500 2000 2500
are influenced by the range of the adopted norm. In order to increase the possibility of revealing hypophosphatemia complications, we used aggravated hypophosphatemia (de-fined as a phosphorus level of <1 mmol/L) for the purpose of statistical analysis. In publications, hypophosphatemia is set at various phosphorus concentrations ranging from <0.8 mmol/L to ≤ 0.9 mmol/L or ≤ 1 mmol/L.9,14–16
Therefore, which level should require intensive phos-phate supplementation? In other words, when should hypo-phosphatemia be diagnosed? It may be necessary to review the results of the studies conducted with metabolic meth-ods, which can precisely pinpoint the ranges of clinically significant hypophosphatemia.17,18
Just 10 years ago, hypophosphatemia in neonates, as well as in babies, was associated with a metabolic bone disease diagnosed at the end of the 1st month of life; and
in the ear-ly neonatal period, this age group was actualin the ear-ly expected to develop hyperphosphatemia.
On the basis of both our own studies and pub-lished works, it may be concluded that after changing the nutrition protocol, hypophosphatemia is not a rare complication in VLBW infants and it often occurs in the 1st week of life.9,14,19–21 The early
hypophospha-temia observed in VLBW infants and those who are small for gestational age (SGA) suggest that it may have the same mechanism as RFS. VLBW neonates with sep-sis require special attention, because they present even lower values of phosphorus concentration in blood.14,20
Three out of 4 neonates from our study group diag-nosed with sepsis within the first 2 weeks of life had
pronounced early hypophosphatemia (<3.1 mg/dL); 2 of them died. Transient hypophosphatemia is also ob-served in both children and adults in the course of diag-nosed infections; phosphorus concentration is inversely proportionate to C-reactive protein (CRP) level, so other anti-inflammatory factors are said to take part in the pro-cess (tumor necrosis factor alpha and interleukin 6).22,23
When should phosphorus concentration be monitored, then? Unfortunately, there are no generally accepted pro-tocols, but there is increasing evidence which indicates that it is important to measure phosphate concentration within the first days of life.4,15,21 However, the number
of additional tests in infants is limited not only by indica-tions for their use, but also by the amount of circulating blood and the risk of iatrogenic anemia. There are sugges-tions that phosphate concentration should be monitored twice a day before stabilization.24 Other authors argued
for monitoring the clinical and biochemical parameters of RFS in the 3rd or 4th day of life in infants at risk, including
VLBW or ELBW neonates requiring parenteral nutrition.19
Based on the data which we obtained, the 1st
mea-surement of phosphorus should be taken by the 3rd day
of life and it should be retaken every 2 or 3 days within the 1st week of life due to the risk of increased
hypophos-phatemia. While correcting acute hypophosphatemia, the concentration in blood serum should be measured 2 h after infusion.8 The dose and timing of phosphorus
are typically administered. More and more data advocate intake safety from the 1st day of standard nutrition which
contains phosphates.26–28 However, phosphorus
supple-mentation is currently recommended from the 3rd day
of life; before that, neonates receive only a small amount of phosphorus in a lipid solution. Fears of early phos-phate intake result from the need to intake sodium and potassium simultaneously, which is not recommended in the first days of life until diuresis stabilizes. The com-plications from phosphorus intake, especially intravenous feeding, also include hypocalcemia and excess intake resulting in hyperphosphatemia.11 It is important to point
out that regardless of phosphate supplementation, a de-crease in phosphate concentration was observed in 66% of preterm neonates with parenteral nutrition older than 3 days of life whom we examined, a fact that indicates insufficient intake. While performing parenteral intake of Ca or P in the amount of 3 and 1.92 mmol/kg/day, respectively, in the 3rd day of life, Christman et al.
ad-ministered the maximum recommended phosphate doses to preterm infants <34 GA; however, as many as 34% of babies had a phosphorus level of <1.8 mmol/L in the 5th
day of life.21
The study we carried out is a preliminary one. The small group of patients studied made it impossible for us to pres-ent conclusive results concerning RFS clinical symptoms in preterm neonates with aggravated hypophosphate-mia. Prospective studies are currently being conducted in our center.
Conclusions
Early hypophosphatemia is a common metabolic com-plication in neonates with <33 GA who receive parenteral feeding. Thus, thorough monitoring is necessary from the very first days of life, especially in VLBW and SGA neonates. It is necessary to carry out further studies in or-der to determine optimal nutritional standards in the early stages of life. It is also essential to identify risk groups of in-fants who may have higher requirements for supplemented phosphates within the 1st week of life to prevent RFS.
What is new:
– adequate phosphate intake is important for preven-tion of metabolic bone disease in preterm infants; – recommendations for neonatal mineral intake are
based on in utero acceleration rates, but supplemen-tation requirements of preterm neonates vary be-tween studies.
What is known:
– early hypophosphatemia is a common metabolic complication in neonates before 32 GA receiving parenteral nutrition;
– thus, thorough monitoring is necessary from the very first days of life, especially in VLBW and SGA neonates.
References
1. Adamkin D, Radmacher P. Current trends and future challenges in neo-natal parenteral nutrition. J Neonatal Perinatal Med. 2014;7:157–164. 2. Nehra D, Carlson S, Erica M, et al. The American Society for Parenteral
and Enteral Nutrition ( ASPEN) clinical guidelines: Nutrition support of neonatal patients at risk for metabolic bone disease. J Parenter Enteral Nutr. 2013;37:570–598.
3. Hay WW, Jr. Aggressive nutrition of the preterm infant. Curr Pedi-atr Rep. 2013;1(4):222–239. doi:10.1007/s40124–013-0026-4 4. Embleton ND, Morgan C, King C. Balancing the risks and benefits
of parenteral nutrition for preterm infants: Can we define the opti-mal composition? Arch Dis Child Fetal Neonatal Ed. 2015;100:F72–F75. 5. Crook MA, Hally V, Panteli JV. The importance of the refeeding
syn-drome. Nutrition. 2001;17:632–637.
6. Khan LU, Ahmed J, Khan S, Macfie J. Refeeding syndrome: A literature review. Gastroenterol Res Pract.2011;410971. doi:10.1155/2011/410971 7. Skipper A. Refeeding syndrome or refeeding hypophosphatemia:
A systematic review of cases. Nutr Clin Pract. 2012;27:34–40. 8. Byrnes MC, Stangenes J. Refeeding in the ICU: An adult and pediatric
problem. Curr Opin Clin Nutr Metab Care. 2011;14:186–192.
9. Bonsante F, Iacobelli S, Latorre G, et al. Initial amino acid intake influ-ences phosphorusus and calcium homeostasis in preterm infants: It is time to change the composition of the early parenteral nutri-tion. PLoS ONE. 2013;8:e72880. doi:10.1371/journal.pone.0072880 10. Fenton TR, Kim JH. A systematic review and meta-analysis to revise
the Fenton growth chart for preterm infants. BMC Pediatr.2013;13:59. doi:10.1186/1471-2431-13-59
11. Koletzko B, Goulet O, Hunt J, Krohn K, Shamir R. Guidelines on Paedi-atric Parenteral Nutrition of the European Society of Paedion Paedi-atric Gas-troenterology, Hepatology and Nutrition (ESPGHAN) and the Euro-pean Society for Clinical Nutrition and Metabolism (ESPEN), support-ed by the European Society of Pasupport-ediatric Research (ESPR). J Pediatr Gastroenterol Nutr. 2005;41:1–87.
12. Fenton TR, Lyon AW, Rose MS. Cord blood calcium, phosphate, magnesium, and alkaline phosphatase gestational age-specif-ic reference intervals for preterm infants. BMC Pediatr. 2011;11:76. doi:10.1186/1471-2431-11-76
13. Sikora P. Phosphataemia disturbances in children. Pediatr Dypl. 2014;18:37–44.
14. Moltu SJ, Strømmen K, Blakstad EW, et al. Enhanced feeding in very-low-birth-weight infants may cause electrolyte disturbances and septicemia: A randomized, controlled trial. Clin Nutr. 2013;32:207–212. 15. Ross JR, Finch C, Ebeling M, Taylor SN. Refeeding syndrome in very-low-birth-weight intrauterine growth-restricted neonates. J Perina-tol. 2013;33:717–720.
16. Boubred F, Herlenius E, Bartocci M, et al. Extremely preterm infants who are small for gestational age have a high risk of early hypo-phosphatemia and hypokalemia. Acta Paediatr. 2015;104:1077–1083. 17. Moco S, Collino S, Rezzi S, Martin FP. Metabolomics perspectives
in pediatric research. Pediatr Res. 2013;73:570–576.
18. Alexandre-Gouabau MC, Courant F, Moyon T, et al. Maternal and cord blood LC-HRMS metabolomics reveal alterations in energy and poly-amine metabolism, and oxidative stress in very-low-birth-weight Infants. J Proteome Research.2013;12:2764–2778.
19. Mizumoto H, Mikami M, Oda H, Hata D. Refeeding syndrome in a small-for-dates micro-preemie receiving early parenteral nutri-tion. Pediatr Int.2012;54:715–717.
20. Brener Dik PH, Galletti MF, Fernández Jonusas SA, et al. Early hypo-phosphatemia in preterm infants receiving aggressive parenteral nutrition. J Perinatol. 2015;35:712–715.
21. Christmann V, de Grauw AM, Visser R, Matthijsse RP, van Goudoev-er JB, van Heijst AF. Early postnatal calcium and phosphorusus metab-olism in preterm infants. J Pediatr Gastroenterol Nutr. 2014;58:398–403. 22. Antachopoulos C, Margeli A, Giannaki M, et al. Transient hypophos-phataemia associated with acute infectious disease in paediatric patients. Scand J Infect Dis. 2002;34:836–839.
23. Naffaa ME, Mustafa M, Azzam M, et al. Serum inorganic phosphorous level predict 30-day mortality in patients with community acquired pneumonia. BMC Infect Dis.2015;15:332. doi:10.1186/s12879-015-1094-6 24. Koletzko B, Poindexter B, Uauy R. Nutritional care of preterm
25. Lafeber HN, van de Lagemaat M, Rotteveel J, van Weissenbruch M. Timing of nutritional interventions in very-low-birth-weight infants: Optimal neurodevelopment compared with the onset of the meta-bolic syndrome. Am J Clin Nutr. 2013;98:556–560.
26. Jamin A, D’Inca R, Le FN, et al. Fatal effects of a neonatal high-pro-tein diet in low-birth-weight piglets used as a model of intrauterine growth restriction. Neonatology. 2010;97:321–328.
27. Bolisetty S, Pharande P, Nirthanakumaran L, et al. Improved nutrient intake following implementation of the consensus standardized par-enteral nutrition formulations in preterm neonates before-after inter-vention study. BMC Pediatr. 2014,14:309. doi:10.1186/s12887-014-0309 28. Imel EA, Econs MJ. Approach to the hypophosphatemic patient.
![Fig. 3. Relationship between Pmin [mg/dL] in blood serum during the 1st week of life and birth weight [g] of the preterm infants](https://thumb-us.123doks.com/thumbv2/123dok_us/8765592.1754266/5.595.47.439.485.760/relationship-pmin-blood-serum-birth-weight-preterm-infants.webp)
