Stimuli generation framework for testing multiple processes in VHDL
Vacius Jusas, Tomas Neverdauskas
Software Engineering Department, Kaunas University of Technology, Studentu St. 50, LT-51368, Kaunas, Lithuania, phone: +370 37 300399
e-mail: [email protected], [email protected]
http://dx.doi.org/10.5755/j01.itc.43.4.7598
Abstract. Hardware Description Languages (HDL) like VHDL are used to design and simulate programmable logic devices. Usually the description of the device under test consists of several processes. This concept introduces problems of how to test and verify complex systems. In this paper, we present a new framework called TestBenchMulti that is able to generate test stimuli for parallel VHDL designs. The framework combines Control Flow Graphs (CFGs), extension of Symbolic Execution (SE) and Satisfiability Modulo Theories (SMT) into a sequence of methods to generate stimuli capable of obtaining high code coverage. The experiments were carried out on synthesizable VHDL circuits at the behavioural level. The obtained code coverage results were confirmed in the real implementation using Xilinx FPGA hardware.
Keywords: Parallel processes; hardware verification; test-bench generation; code coverage evaluation.
1. Introduction
With the ever-growing demand for greater perfor-mance and faster time to market, coupled with the exponential growth in hardware size, verification has become increasingly difficult and time consuming process [1]. This raises the need for the development of new techniques and methodologies that can provide the verification team with the means to achieve its goals quickly and with limited resources.
In order to determine if a chip was manufactured correctly, or if it continues to function as intended, it must be tested. The test is an evaluation based on a set of requirements and is often called stimuli in hardware verification. Test-bench is a combined set of stimuli. Depending on the complexity of the design, the test-bench may be a mere perusal of the product to determine whether it suits personal needs, or it could be a long, exhaustive checkout of a complex system to ensure compliance with many performance and safety criteria. Emphasis of the test may be directed a speed of execution, an accuracy or a reliability.
In hardware design, multiple parallel processes are a very natural way to express required computational logic. But for human being such a representation can be a very complex task. Therefore, the description of the circuit having several parallel processes increases the complexity of verification exponentially.
In this research, we focus on providing a novel semi-automatic framework to generate test stimuli for parallel VHDL designs. We verify the test stimuli
obtained using our framework on real FPGA hardware, as well.
The paper is organized as follows. We review the background information in Section 2. We present the framework to generate test for VHDL models in Section 3. We provide the evaluation of the results of the experiment in Section 4. We finish with conclu-sions in Section 5.
2. Background
2.1. Verification process
A wide variety of verification technologies are available, broadly classified as simulation-based, static/dynamic analysis-based and formal technolo-gies. The simulation is still the most widely used form of the device verification [2]. One of the problems of simulation is to have the test-benches to validate the design functionalities.
by creating a model of the circuit (a representation or abstraction of selected features of the system) and simulating the input stimuli by means of that model.
Hardware designers perform extensive simulations called “behavioural verification”. Because VHDL is similar to a high-level programming language and it borrowed a lot of constructs from Ada [4], we can apply software quality assurance techniques to a hard-ware design in order to identify and remove faults. These faults need to be detected through the use of test-benches. Test-bench automation through the gene-ration of test patterns and test cases increases the effi-ciency and effectiveness of behavioural verification [5].
Fig. 1 shows a test configuration in which stimuli are applied to a device under test (DUT), and the response is evaluated. If we know what the expected response is from the correctly operating device, we can compare it to the response of the DUT to determine if the DUT is responding correctly.
Figure 1. Concise description of the FPGA verification process in simulation mode
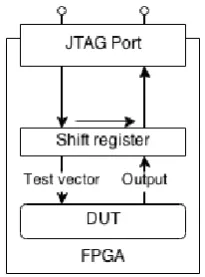
The same applies to the model and physical FPGA hardware. The FPGA itself can provide the circuitry you need to monitor and control your own application circuit. JTAG is an IEEE standard (1149.1) developed in the 1980s to solve printed circuit board
manufactu-ring issues [6]. Nowadays it finds more use as pro-gramming, test and probing port. In our research, we use JTAG for testing of FPGA. The basic idea is provided in Fig. 2 and it can be explained as follows. The test stimuli are shifted into the FPGA, then they are applied to the primary inputs of circuit, next the responses are captured at the primary outputs and they are loaded into the shift register, and finally the resp-onses are shifted out of the FPGA. The shift register is a cascade of flip flops possessing the same clock, in which the output of each flip-flop is connected to the “data” input of the next chained flip-flop, resulting in a circuit that shifts by one position the “bit array” stored in it, shifting in the data present at its input and shifting out the last bit in the array, at each transition of the clock input. We can use the same test-bench both for the model and for FPGA hardware by provi-ding JTAG interface library to simulation software and by changing configuration of verification target. The use of the same test-bench enables us to compare the results obtained during simulation and in the imple-mentation of the real hardware.
2.2. VHDL as a programming language
The VHDL description of the device in source code consists of two parts: entity and architecture. The entity represents the interface of the device, and the architecture is used to code the functional implementa-tion of the device [7]. Different levels of funcimplementa-tional implementation can be used. The most frequently used description levels are the following: behavioural, re-gister transfer level (RTL), and structural. The behavioural architecture body of entity describes its function in an abstract way and the concurrent state-ments in it are limited to process statestate-ments, subpro-gram calls and signal assignments. The process
statements are further made up of sequential statements that are much like the kinds of statements we see in a conventional programming language such as statements evaluating expressions, statements assigning values to variables (variable-assignment statements), conditional execution statements ( if-then-else, case, etc.), repeated execution statements (loops) and subprogram calls. In addition, there is the signal assignment statement, which is unique to hardware modelling languages. This statement is similar to variable assignment statement, except that it causes the value on a signal to be updated at some future time. Signals are used to connect different parts of the design and they are the objects through which information is propagated between processes. Semantics of signals is closely connected to the notion of time in VHDL; a signal has not only a current value but also a projected waveform that determines its future values at certain moments of simulation time.
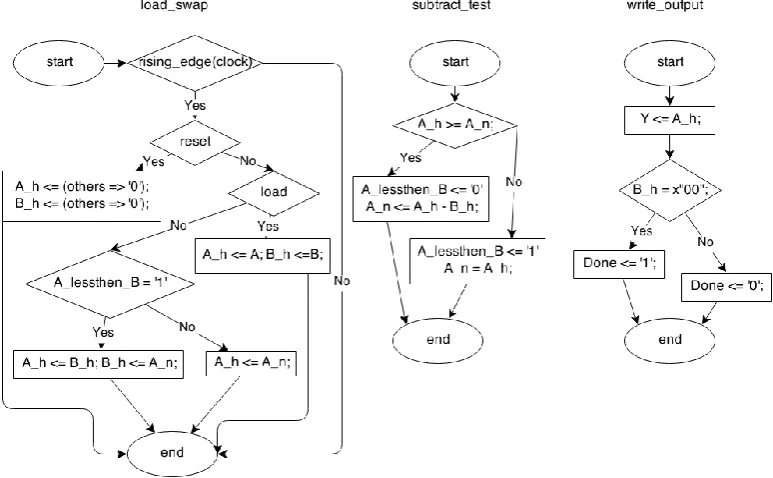
Figure 3. Control flow graph of each process in GCD circuit
2.3. Control flow in VHDL
In behavioural descriptions of VHDL, the main statement is the process statement. The statement part of an architecture body can consist of several concurrent processes. After activation of the architecture body all the concurrent statements are started and executed in parallel. The body of the process statement includes sequential statements like those found in software programming languages and it can be implemented as control flow. In our framework, each process is treated as separate control flow graph 𝐺 = (𝑉, 𝐸). Each statement in a process is a node 𝑣 ∈ 𝑉 in the control flow graph and the edges 𝑒 ∈ 𝐸 represent the control flow among statements. We add an edge (𝑒𝑎1, 𝑒𝑎2) if the statement
𝑎1 is executed immediately after the statement 𝑎2. Such a CFG is presented in Fig. 3. It represents a greatest common divisor (GCD) implementation in VHDL using parallelized Euclidean algorithm. GCD architecture consists of three processes – load_swap, subtract_test, write_output. First process is responsible for resetting circuit, loading the data and checking the difference between two input vector values A and B. Second process subtract_test calculates subtraction between two signals A_h and
B_h. Last process write_output writes result to output port Y and flags the indicator that the result is obtained.
Our framework supports branch statements (Case, If/Else) of VHDL. For each branch, a node is introduced to edge connection to parent element. A start and an end node will be added as unique entry and exit points of the process. In a control flow graph (Fig. 3), each node represented as a rectangular block matches a straight-line code without any branching. The rectangular blocks can be used to denote any other sequential statements. Directed edges are used to represent jumps in the control flow. Branch operations mostly have two directed edges denoted by yes/no.
2.4. Symbolic execution
Symbolic execution is one of the many techniques that has been used to automate software testing by generating test cases that achieve high coverage of program executions. Symbolic execution is by default static code analysis technique. Computational definitions for the basic operators of the language are extended to accept symbolic inputs and produce symbolic formulas as output [7]. The state of a symbolically executed program includes the symbolic values of program variables, a path condition (PC) and a program counter, representing next statement to be executed. The path condition is a (quantifier-free) BOOLEAN formula over the symbolic inputs. It accumulates constraints which the inputs must satisfy in order for an execution to follow the particular associated path [8]. A symbolic execution tree characterizes the execution paths followed during the symbolic execution of a program. The nodes represent program states and the edges represent transitions between states. The main difference between CFG and symbolic execution is that symbolic execution produces all possible execution paths of the program. Result of symbolic execution is Boolean formula that is solved using a SMT solver in order to provide concrete values.
Symbolic execution went its long way in software testing and it achieved quite considerable results [9], but the use of symbolic execution for hardware verification is still in evolving phase. One of the first researches devoted for VHDL using symbolic execution was presented in [10], [11] The symbolic execution was applied in the narrow sense; the faults were concurrently injected and simulated symbolically. After injection, the fault path was traced in order to verify its propagation to the primary outputs. The authors used statement coverage and bit coverage metrics. As the advantage of the approach we could notice that the authors considered the VHDL descriptions having multiple statements.
at al. did not pay attention to the VHDL designs having multiple process statements.
Liu et al. [12] presented an approach that combined dynamic simulation data and static analysis of control flow graphs at the register transfer level. A concrete simulation was applied over a fixed number of cycles. That is the disadvantage of the approach. The authors implemented the Verilog register transfer level symbolic execution engine and used branch coverage and path coverage metrics. The research was based on designs having single process only.
Jusas and Neverdauskas [13] proposed an approach that combined the specifics of hardware and software. The finite state machine represents the spe-cifics of the hardware. The control flow graph repre-sents the specifics of the software. The proposed approach allowed obtaining high code coverage but for the designs having single process only. Therefore, in this paper, we are going to extend the approach [13] to the designs having multiple processes.
2.5. Evaluation metrics
To evaluate the generated test cases, we use three code coverage metrics: statement, branch and toggle. Statement coverage measures the number of execu-table statements within the model that have been exe-cuted during the simulation run. In most verification cases, statement coverage is used as minimum goal [14]. Branch coverage [15] sometimes is referred to as decision coverage. This coverage metric measures how many times each branch in an IF/ELSE construct was executed and it is particularly useful in situations where a branch does not contain any executable statements. Toggle coverage answers the question “Did this bit of this input/output change from a value of zero (0) to one (1) and back from one (1) to zero (0) during simulation?”.
3. Framework for VHDL programs consisting
of multiple processes
3.1. Structure
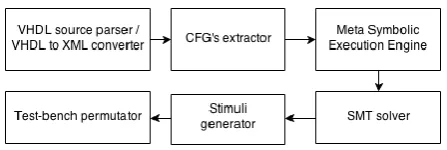
Test generation framework “TestBenchMulti” combines and extends methods shortly introduced in previous section into novel methodology. Basic framework structure is presented in Fig. 4. All the parts of framework are implemented in Python pro-gramming language. “TestBenchMulti” is continuation of the previous research [15], devoted for VHDL programs having a single process.
Figure 4. Basic structure of TestBenchMulti
The flow of the data through framework is indicated by arrows in Fig. 4. Firstly, the code in Extensible Markup Language (XML) is generated using circuit description in VHDL code. Next, the control flow graphs (CFG’s) are created using XML code. This is followed by symbolic execution process. The stimuli generation cases on the base of CFG’s are considered in the next subsection. Result of the symbolic execution is a tree (SET) structure. A significant scalability challenge for symbolic execu-tion is how to handle the exponential number of paths in the code. Each abstract path condition in a leaf node of SET is computed using Satisfiability Modulo Theories library Z3 [16] in order to obtain the concrete values. SMT is an area of automated deduction that studies methods for checking the satisfiability of first-order formulae in accordance to some logical theory of interest. While SMT techniques have been traditionally used to support deductive software very-fication, we are using this for calculation of concrete values from SMT formulae. Finally, stimuli are converted to test-bench format using VHDL language. This final step is performed completely in manual manner. We did not create the tool to convert the stimuli to test-bench format yet. This step does not require any calculation efforts. Therefore, its automation was left to the end.
3.2. Stimuli generation
In parallel software programming, two common approaches are used: lightweight and heavyweight processes. In lightweight process, the threads of the process share the same address space. This approach can easily lead to conflicts in case of improper synchronization, for example, if processes are writing to the same memory location at the same time.
Each heavyweight process contains its own address space. This approach is more general, safer, but it is more complex. This execution model is used in VHDL. Communication between processes is accomplished using signals that are declared in declaration part of the architecture unit. These signals are visible to all the processes that are present in the architecture body. The restriction is imposed on the writing rights to these signals; single process can assign a value to the particular signal.
The most designs use clock signal to synchronize the circuit. Therefore, we consider the descriptions of the synchronous circuits. Consequently, at least one process in the architecture body will be sensitive to the clock signal and such a process will always be present. All the other processes can be sensitive to the same clock signal, to some other signals at the primary inputs or to the signals that are declared in the declaration part of the architecture unit.
Axiom. Every design described in VHDL at the behavioural level has at least one master process. There can be several master processes if the design performs some functions independently.
Bearing in mind the Axiom we divide the descriptions of the circuits into three categories. We assign to the first category the circuits that are described by the independent processes. The processes can be driven either by the clock signal or by the other signals at the primary inputs. We assign to the second category the circuits that are described by one explicit master process driven by clock signal and all the other processes are slave and follow the commands from this process. In this case, all the slave processes are sensitive to the signals that obtain values from the master process. We assign to the third category all the other circuits that have implicit master process. In this case, several processes are sensitive to clock signal and processes share some common information. Usually one process assigns value to the signal; the other process tests the value of the assigned signal. The task is to find which process is master. According to the Axiom such a process must be present.
3.3. Independent processes
This is the simplest case. All signals declared in sensitivity list of each process are independent, and processes do not share information. Parallel execution of each process depends only on sensitivity list and the signal values at the primary inputs. In this situation, we can form CFG of each process independently. The count of CFG is equal to the count of processes. Then each CFG is executed symbolically independently, as well.
3.4. Explicit master and slave processes
In this case, the master process is activated by the clock signal. Slave processes are activated by the signals, values to which are assigned in the master process. We inject CFG of each slave process into the CFG of the master process to the place where appropriate signals are used. After this code manipu-lation, we obtain single sequential process that is executed symbolically.
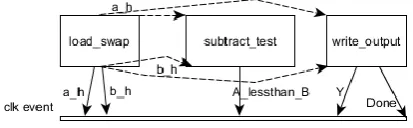
We already have presented the graphical representation of such CFG’s for GCD circuit in Fig. 3. We present for the same circuit the abstract view of the processes and the relations among the processes defined by the signals in Fig. 5. The process load_swap is the master process. The processes subtract_test and write_output are the slave processes. The master process assigns values to the signals a_h and b_h that activate slave processes. The slave process subtract_test assigns the value to the signal A_lessthan_B that is tested in the master process.
Symbolic code execution enables to obtain SET tree that is presented in Fig. 6. As we can see, although our design is small enough it contains in total 10 leaf nodes. Every path into leaf node will be
converted to test stimulus. Large number of leaf nodes ensures large number of test stimuli. Consequently, large number of test stimuli guarantees high quality of code coverage.
Figure 5. Relation of processes in GCD circuit
3.5. Implicit master and slave processes
In this case, several or all the processes are sensitive to the clock signal. The master process cannot be distinguished according to the sensitivity to the clock signal. In order to find the master process we construct the directed graph of data flow among the processes. We name it the graph of relation (GoR). In GoR, the vertex maps the process. The edge is directed from the first vertex to the second vertex if the value to the signal is assigned in the first process and the value is tested in the second process. We present an example of the graph of some hypothetical circuit having 5 processes in Fig. 7. We label using letter I and the sequential number the primary inputs. The primary outputs are labelled using letter O and the sequential number. The numbers shown in parentheses denote the bit size. We label using letter C and the sequential number the inner relations among the processes. Reset and clock signals are not included because they are present in the sensitivity lists of all the processes.
In order to find the master process we define the following three rules:
1. The process must be sensitive to the clock signal and reset signal if the reset signal is present.
2. The process must send commands to several other processes. Either possible master process or the processes directly related to possible master process must receive data from primary inputs.
3. The process must receive and test answers from the processes, to which it has sent commands either directly or indirectly. If we look to Fig. 7, we see that process P3 satisfies the defined rules. Therefore, the process P3 is the master process for our considered hypothetical circuit.
When the master process is determined, then the procedure follows the same steps as in the case of the explicit master process.
4. Experiments
Figure 6. Combined Symbolic Execution Tree of GCD
Figure 7. Graph of relation of hypothetical circuit
chopper circuit [17], GCD implementation in VHDL using parallelized Euclidean algorithm and B13 circuit from ITC99 benchmark suite [18]. The characteristics of the circuits are presented in Table 1. The chopper is a circuit that converts fixed dc input to a variable dc output voltage directly. B13 is interface to meteo sensors [18]. The chopper circuit represents the first category of the circuits. GCD circuit represents the second category of the circuits. B13 circuit represents the third category of the circuits.
Framework “TestBenchMulti” generates for each circuit code stimuli for verification. In our research, we use Mentor Graphics ModelSim software to
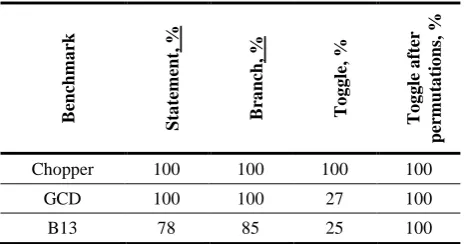
simulate our design and compute code coverage. During this phase the coverage analysis tool inspects the VHDL source code and computes statement, branch, toggle and toggle after permutation coverage results (Table 2).
Table 1. Designs under Test
Circuit Number of processes Lines of code
Chopper 7 51
GCD 3 43
B13 (ITC99) 5 296
As we can see from Table 2, we did not obtain high toggle coverage for the GCD and B13 circuits. Therefore, we employed the tool that added missing toggles at the primary inputs. Such extra stimuli allowed obtaining complete toggle coverage for all the circuits. We did not obtain complete statement and branch coverage for B13 circuit. We investigated the problem and we learnt that one of the processes has an implicit loop. Our tool cannot manage this problem correctly. There is a room for improvement in test stimuli generation for single process. Stimuli generation for a loop using symbolic analysis technique always was a challenge.
To our best knowledge we do not know the results of automatic test stimuli generation of the researches that would consider the circuits described in VHDL at P1
P4 P3
P2
P5 I1
O1 O2 O3 O4(4)
O5 O6
O7 I2(8)
I3 C1 C2
C3
C4
C6 C5
C8
the behavioural level and having multiple processes. Consequently, we cannot compare our obtained results with the results of the other researches.
We implemented all the mentioned circuits into real FPGA hardware. For FPGA hardware, we used Xilinx Spartan XC3S200A FPGA and Xilinx ISE Suite for FPGA configuration. Generated binary stimuli are transferred to FPGA through JTAG interface. The same verification process is applied. We obtained exactly the same coverage results as in simulation mode.
Table 2. Coverage results
Be n ch m a rk S ta te m en t, % Br a n ch , % To g g le, % To g g le a fte r p er m u ta ti o n s, %
Chopper 100 100 100 100
GCD 100 100 27 100
B13 78 85 25 100
5. Conclusions
Verification is an important part of design process. The test stimuli are needed to verify the behaviour of designed circuit. The tool, which is able to generate test stimuli automatically, quite substantially eases the process of verification. We presented the updated version of the test stimuli generation framework for the verification of VHDL model having parallel processes. The framework combines several tools and the final result of the framework is a test-bench for the verification of the circuit model described in VHDL at the behavioural level and having multiple processes.
To our best knowledge, we presented the framework of test stimuli generation for VHDL models at the behavioural level having multiple processes for the first time. The obtained coverage results using various metrics indicate high quality of generated test stimuli.
We verified the results obtained using simulation environment in the real FPGA implementation. Hardware implementation confirmed the results obtained using software implementation.
References
[1] E. Bareiša, V. Jusas, K. Motiejūnas, R. Šeinauskas. The use of a software prototype for verification test generation. Information Technology and Control, 2008, Vol. 37, No. 4, 265–274.
[2] D. Zheng, W. Yichen, Z. Xueyi. The methods of FPGA software verification. In: Proceedings of the 2011 IEEE International Conference on Computer
Science and Automation Engineering (CSAE), 2011,
Vol. 3, pp. 86–89.
[3] K. Arshak, E. Jafer, C. Ibala. Power Testing of an FPGA based System Using Modelsim Code Coverage capability. In: Proceedings on the 2007 IEEE Interna-tional Conference on Design and Diagnostics of
Elec-tronic Circuits and Systems, 2007, pp. 1–4.
[4] J. Barnes. Ada 95 Rationale: The Language, the Standard Libraries. Springer, 1997.
[5] L. Feng, Z. Dai, W. Li, J. Cheng. Design and applica-tion of reusable SoC verificaapplica-tion platform. In:
Proceedings of the 2011 IEEE 9th International
Conference on ASIC (ASICON), 2011, pp. 957–960.
[6] IEEE Standard Test Access Port and Boundary Scan Architecture, IEEE Std. 1149.1-2001, 1–212, Jul. 2001. [7] J. A. Darringer, J. C. King. Applications of Symbolic Execution to Program Testing. IEEE Computer, 1978, Vol. 11, No. 4, 51–60.
[8] S. Khurshid, C. S. Păsăreanu, W. Visser. Generali-zed symbolic execution for model checking and testing. In: Tools and Algorithms for the Construction
and Analysis of Systems, Springer, 2003, 553–568.
[9] C. Cadar, P. Godefroid, S. Khurshid, C. S. Păsăreanu, K. Sen, N. Tillmann, W. Visser. Symbolic execution for software testing in practice: preliminary assessment. In: Proceedings of the 33rd
International Conference on Software Engineering,
2011, pp. 1066–1071.
[10] A. Andrews, A. O'Fallon, T. Chen. RUBASTEM: A Method for Testing VHDL Behavioral Models. In:
Proceedings of the 2004 IEEE International
Sympo-sium on High Assurance Systems Engineering, 2004,
pp. 187-196.
[11] L. Liu, S. Vasudevan. Efficient validation input gene-ration in RTL by hybridized source code analysis. In:
Proceedings of the Design, Automation and Test in
Europe Conference and Exhibition, 2011, pp. 1596–
1601.
[12] F. Ferrandi, F. Fummi, L. Gerli, D. Sciuto. Symbo-lic functional vector generation for VHDL specifica-tions. In: Proceedings of the Design, Automation and
Test in Europe Conference and Exhibition, 1999, pp.
442–446.
[13] I. G. Harris. Fault models and test generation for hardware-software covalidation. IEEE Design & Test
of Computers, 2003, Vol. 20, No. 4, 40–47.
[14] S. Tasiran, K. Keutzer. Coverage metrics for functional validation of hardware designs. IEEE
Design & Test of Computers, 2001, Vol. 18, No. 4, 36–
45.
[15] V. Jusas, T. Neverdauskas. Combining Software and Hardware Test Generation Methods to Verify VHDL Models. Information Technology and Control, 2013, Vol. 42, No. 4, 362–368.
[16] L. De Moura, N. Bjørner. Z3: An efficient SMT solver. In: Tools and Algorithms for the Construction
and Analysis of Systems, Springer, 2008, 337–340.
[17] M. Jenihhin, A. Tsepurov, V. Tihhomirov, J. Raik, H. Hantson, R. Ubar, G. Bartsch, J. M. Escobar, H.-D. Wuttke. Automated Design Error Localization in RTL Designs. IEEE Design & Test, 2014, Vol. 31, No. 1, 83–92.
[18] ITC99 Benchmark Suite. CAD Group at Politecnico di Torino, http://www.cad.polito.it/downloads/tools/itc99.html.