MICROSTRUCTURAL EVOLUTION OF NICKEL DURING SPARK PLASMA SINTERING
by
Matthew Thomas Luke
A thesis
submitted in partial fulfillment of the requirements of the degree of
Master of Science in Materials Science and Engineering Boise State University
© 2010
BOISE STATE UNIVERSITY GRADUATE COLLEGE
DEFENSE COMMITTEE AND FINAL READING APPROVALS
of the thesis submitted by
Matthew Thomas Luke
Thesis Title: Microstructural Evolution of Nickel During Spark Plasma Sintering Date of Final Oral Examination: 04 December 2009
The following individuals read and discussed the thesis submitted by student Matthew Thomas Luke, and they also evaluated his presentation and response to questions during the final oral examination. They found that the student passed the final oral examination, and that the thesis was satisfactory for a master’s degree and ready for any final modifications that they explicitly required.
Megan E. Frary, Ph.D. Chair, Supervisory Committee Darryl P. Butt, Ph.D. Member, Supervisory Committee Indrajit Charit, Ph.D. Member, Supervisory Committee
iv
ACKNOWLEDGEMENTS
This investigation was conducted as part of the requirements for the degree of
Master of Science in Materials Science and Engineering from Boise State University.
The equipment and materials used in this investigation were provided or made available
by the Department of Materials Science and Engineering at Boise State University, by
Dr. William Windes and Dr. Mark Carroll at Idaho National Laboratory, and Todd
Gansauge at Idaho State University and the Center for Advanced Energy Studies. This
research was funded in part by an Idaho National Laboratory LDRD under the
supervision of Dr. Megan Frary and Dr. Darryl Butt of Boise State University, and Dr.
William Windes and Dr. Mark Carroll of Idaho National Laboratory. Funding was also
provided by the Boise State University Graduate College through a fellowship from the
Nuclear Regulatory Commission. Dr. Megan Frary is gratefully acknowledged for the
guidance and direction she provided to this study. In addition, the support and direction
provided by Dr. Darryl Butt of Boise State and Dr. Indrajit Charit of the University of
Idaho are sincerely appreciated. Finally, the members of both the Frary and Butt
Research Groups deserve acknowledgement for their help in producing and analyzing
v ABSTRACT
Spark plasma sintering (SPS) is reported to produce materials with properties
superior to those that result from conventional processing techniques. Spark plasma
sintering is also reported to process materials at lower temperatures and in a shorter time
than other processes, which may facilitate the synthesis of materials that are traditionally
difficult to process. While the properties of materials that result from SPS processing
have been studied, there is not a thorough understanding of the evolution of the
microstructure in response to SPS process parameters. A comparison of the
microstructure of nickel produced by SPS at varying ramp rate, temperature, dwell time,
and applied pressure, and nickel produced at varying time and temperature by
conventional sintering (CS) techniques is made. Material properties that are compared
include: density, hardness, porosity, average grain size, and grain boundary character.
Evaluations of the activation energy of sintering, plastic flow, and modeling using a
hot-press equation of SPS nickel are also performed to elucidate the mechanism of sintering.
The results from this study are expected to give insight into more complex material
systems processed with SPS.
The specimens processed by SPS reach higher density at lower temperatures than
those processed by CS techniques. The hardness of SPS nickel is linearly related to the
density, consistent with results from foams. The hardness and porosity results also
vi
high temperatures or for long dwell times. Approximations of the grain growth rate of
SPS nickel are higher than for CS nickel. The grain boundary character is stable during
both SPS and CS processing, with significant increases in the Σ3 and special fractions only occurring at the longest times and highest temperatures. The activation energy of
sintering indicates that SPS nickel densifies by diffusional processes. A hot-press model
is also used to help identify the sintering mechanism, but the model is insufficient to
explain the SPS process. The microstructural evolution of nickel is different during
vii
TABLE OF CONTENTS
ABSTRACT ... v
LIST OF TABLES ... x
LIST OF FIGURES ... xi
LIST OF ABBREVIATIONS ...xvii
LIST OF SYMBOLS ...xviii
CHAPTER 1: INTRODUCTION ... 1
1.1 : Motivation for Research ... 1
1.2 : Research Objectives ... 2
CHAPTER 2: BACKGROUND INFORMATION ... 4
2.1 : Overview of Sintering Processes ... 4
2.1.1 : Traditional Sintering ... 4
2.1.2 : Pressure-Assisted Sintering ... 11
2.1.3 : Spark Plasma Sintering ... 17
2.2 : Densification and Microstructural Evolution in Pure Metals by SPS .... 23
2.3 : Powder Metallurgy Studies of Nickel ... 25
2.3.1 : Conventional Nickel Processing ... 25
2.3.2 : SPS of Nickel ... 27
2.4 : Grain Growth and Grain Boundary Character in Nickel ... 29
viii
3.2 : Processing with SPS ... 34
3.3 : Conventional Sintering of Nickel ... 40
3.4 : Density, Hardness, and Porosity Measurements ... 41
3.6 : SEM and EBSD ... 44
CHAPTER 4: RESULTS ... 46
4.1 : Error and Repeatability ... 46
4.1.1 : Measurement Error ... 46
4.1.2 : Repeatability of the SPS Process ... 48
4.2 : Characterization of the Initial Nickel Powder ... 49
4.3 : Density of Sintered Nickel ... 53
4.3.1 : Density of SPS Nickel ... 53
4.3.2 : Density of CS Nickel ... 57
4.4 : Hardness Results ... 59
4.4.1 : Hardness of SPS Nickel Samples ... 59
4.4.2 : Hardness of CS Nickel Samples ... 61
4.5 : Porosity Results ... 63
4.5.1 : Porosity of SPS Nickel ... 63
4.5.2 : Porosity of CS Nickel ... 65
4.6 : Grain Size Results ... 66
4.6.1 : Grain Size Results for SPS Nickel ... 66
4.6.2 : Grain Size Results for CS Nickel ... 71
ix
4.7.2 : Grain Boundary Character of CS Nickel ... 74
4.8 : SEM of SPS Nickel Fracture Surfaces ... 76
4.9 : Microstructural Evolution ... 79
4.9.1 : Microstructural Evolution of SPS Nickel ... 79
4.9.2 : Microstructural Evolution of CS Nickel ... 82
CHAPTER 5: DISCUSSION ... 84
5.1 : Density and Densification ... 84
5.2 : Hardness ... 91
5.3 : Evidence of Temperature Gradients ... 92
5.4 : Grain Growth During SPS ... 95
5.5 : Grain Boundary Character Distribution ... 100
5.6 : Evaluation of Sintering Mechanisms During SPS ... 102
5.6.1 : Activation Energy of Sintering ... 102
5.6.2 : Plastic Flow ... 107
5.6.3 : Deformation Mechanism Map ... 110
5.6.4 : Hot Press Modeling ... 112
5.6.5 : Discussion of the Sintering Mechanism of Nickel in SPS ... 116
CHAPTER 6: CONCLUSIONS ... 117
REFERENCES ... 119
x
LIST OF TABLES
Table 2.1. Initial stage sintering mechanisms for Equation 2.3 ... 8
Table 2.2. Values of the exponents q and g for Equation 2.16 ... 16
Table 2.3. Reported activation energies for nickel diffusion. References from German and Ashby [42, 55-57] ... 26
Table 3.1. Table of the processing conditions used for spark plasma sintering. The number for each process condition is the number of specimens produced to determine the repeatability of the process ... 40
Table 5.1. Estimates of the final density due to plastic flow for SPS nickel calculated from Equations 2.11 and 2.12. Estimates are compared to the highest density obtained during SPS of nickel. Process conditions with no data for calculations are left blank ... 109
Table 5.2. Results for HD, q, and g from the fit to the hot-pressing model in Equation 5.5 ... 114
Table A1. Density, hardness, and porosity results for CS processed nickel ... 128
Table A2. Grain boundary character and grain size results for CS processed Nickel ... 128
Table A3. Density, hardness and porosity results for SPS processed nickel ... 129
Table A4. Grain size results for SPS processed nickel ... 130
xi
LIST OF FIGURES
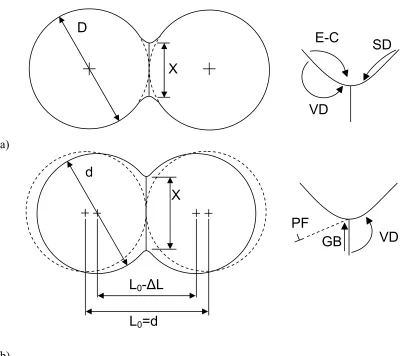
Figure 2.1. Idealized two sphere sintering model. The surface transport
mechanisms (a), evaporation-condensation (E-C), volume diffusion of atoms from the surface to the surface (VD), and surface diffusion (SD) lead to neck formation, but not to a change in the particle centers. The bulk transport mechanisms (b), plastic flow (PF), grain boundary diffusion (GB), and volume diffusion (VD) are responsible for changes in the particle centers (densification). Adapted from German
[56, 57] ... 7
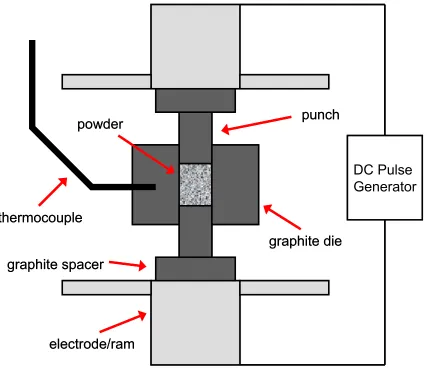
Figure 2.2. Schematic of the SPS process. Powder is held in a conductive die, and heated directly using pulsed DC current in the presence of an electric field and under applied pressure. Temperature is measured at the die wall by a thermocouple or by optical pyrometry ... 18
Figure 2.3. Deformation mechanism maps for nickel with grain sizes of 1 and 10
μm [89]. Images taken from the online version of the Frost and Ashby text, available at: http://engineering.dartmouth.edu/defmech/ ... 27
Figure 3.1. Dr. Sinter Lab SPS-515S (SPS Syntex Inc., Kanagawa, Japan) spark plasma sintering machine owned by Boise State University. The process chamber is on the left, the machine controls are on the center unit, and the analysis unit is on the right ... 35
Figure 3.2. Schematic of the die, punches, and spacers that were used to process nickel with SPS. The drawing is to scale, and the dimensions of each piece are given. The nickel powder is represented by the gray object inside the die ... 36
Figure 3.3. Temperature and pressure profile used to sinter nickel by SPS. Plot shows a profile for a sample to be processed at 800°C for 3 min at 61.9
MPa ... 38
xii
datasets were collected and are all in good agreement ... 50
Figure 4.2. SEM images of the nickel powder used in all the experiments, a)
shows an image taken at 2500X and b) at 200X ... 50
Figure 4.3. Grain size distribution of the as-received nickel powder. The distribution was obtained by performing EBSD on mounted and
polished nickel powder ... 52
Figure 4.4. Orientation map showing grain size and shape in the as-received nickel powder. The map was obtained by performing EBSD on mounted and polished nickel powder. The colors correspond to different grain
orientations ... 52
Figure 4.5. Density as a function of temperature for SPS processed nickel specimens. The lines link samples with the same pressure and dwell time across the temperature range. The colors represent the different applied pressures and the symbols the different dwell times ... 54
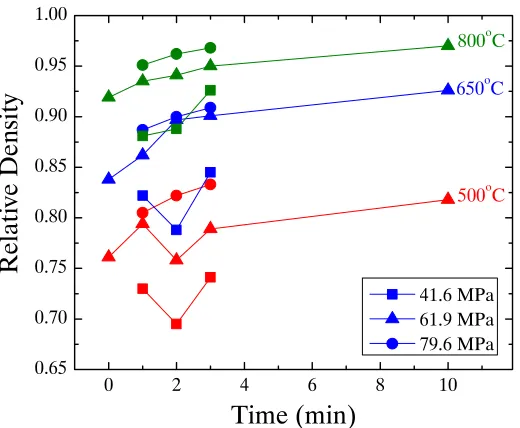
Figure 4.6. Density as a function of dwell time for SPS processed nickel specimens. The lines link samples with the same temperature and pressure. The colors represent the different temperatures and the
symbols the different applied pressures ... 55
Figure 4.7. Density as a function of applied pressure for SPS processed nickel specimens. Lines connect samples processed at the same temperature and dwell time. The colors represent the different temperatures and the symbols the different dwell times ... 55
Figure 4.8. Density of SPS nickel samples processed at varying ramp rates. The black squares show samples that were cooled at the limits of the SPS machine and the gray dots are samples that were cooled at the same rate at which they were heated ... 56
Figure 4.9. Density as a function of temperature of SPS nickel samples heated at 100°C/min, with an applied pressure of 62 MPa, and with no dwell .... 57
Figure 4.10. Density of CS nickel samples as a function of temperature. The
symbols represent different dwell times connected by the lines ... 58
Figure 4.11. Density of CS samples as a function of dwell time. The symbols
xiii
samples were polished to 800 grit before the hardness testing ... 60
Figure 4.13. Hardness of all SPS nickel samples produced at varying temperature, dwell time, and applied pressure as a function of density. The symbols indicate the different processing temperatures and heating rates. The error bars represent the standard deviation of the hardness
measurements ... 60
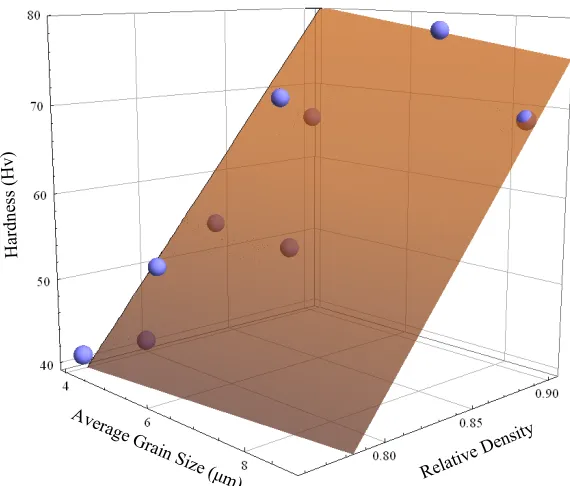
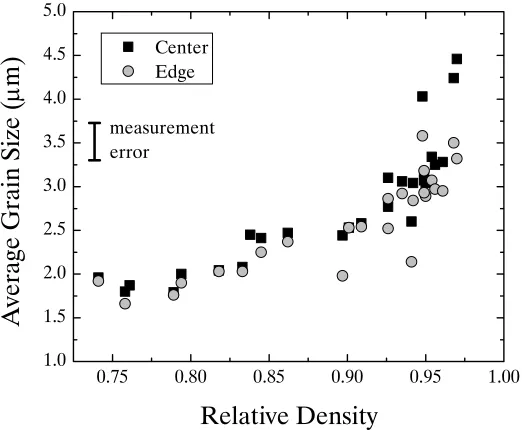
Figure 4.14. Hardness as a function of average grain size and relative density of SPS nickel. The dots are the actual values, and the shaded plane
represents a fit of hardness to average grain size and relative density .. 61
Figure 4.15. Hardness of all CS nickel samples as a function of density. The symbols correspond to the different temperatures. The error bars
represent the standard deviation of the hardness measurements ... 62
Figure 4.16. Hardness of all CS nickel samples as a function of average grain size and relative density. The dots are the actual values, and the shaded plane represents a fit of hardness to average grain size and relative
density ... 63
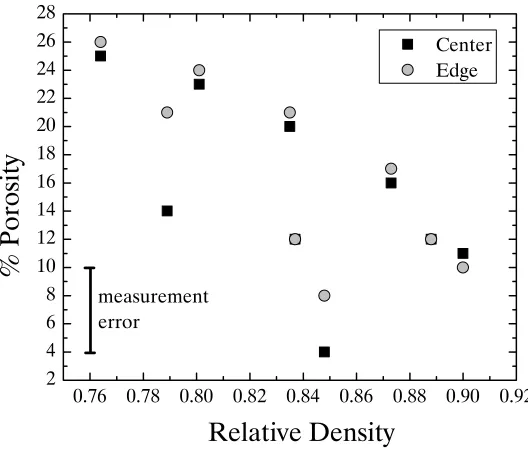
Figure 4.17. Porosity of all SPS nickel samples produced at varying temperature, dwell time, and applied pressure as a function of density. The black squares are the measurements taken at the center of the sample, and the gray dots are measurements taken at the edge of the sample. The lines represent linear fits of the porosity values at the center and the
edge ... 64
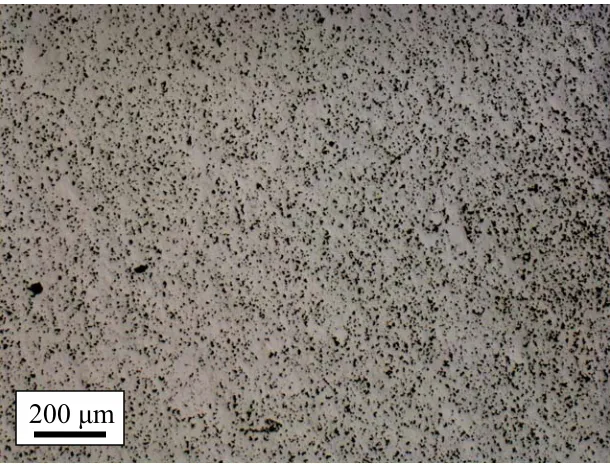
Figure 4.18. Optical micrograph of the cross section of the SPS nickel sample produced at 800°C for 3 min at 61.9 MPa. The micrograph shows the distribution of porosity across the sample. The right edge of the
micrograph is the edge of the sample ... 65
Figure 4.19. Porosity of all CS nickel samples as a function of density. The black squares correspond to measurements taken at the sample center and the gray dots to measurements at the sample edge ... 66
xiv
Lines connect samples processed at the same dwell time and applied
pressure ... 68
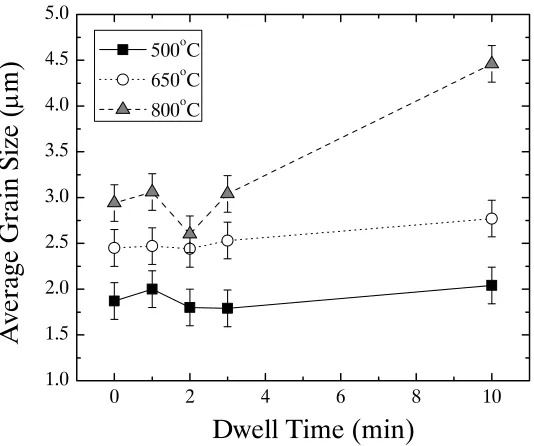
Figure 4.22. Plot of average grain size as a function of dwell time for SPS nickel samples processed at 61.9 MPa. The symbols represent the different temperatures. Lines connect samples processed at the same
temperature ... 69
Figure 4.23. Average grain size of SPS nickel processed from 400 – 1000°C at 61.9 MPa with no dwell. The error bars represent the average grain size
measurement error ... 70
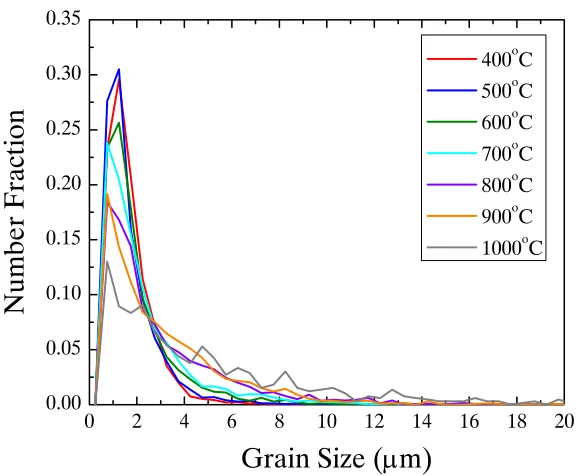
Figure 4.24. Grain size distribution for SPS nickel processed from 400 – 1000°C at 61.9 MPa with no dwell. Each line represents a different process
temperature ... 70
Figure 4.25. Average grain size for CS nickel shown as a function of dwell time. The symbols correspond to the temperatures. The error bars represent the average grain size measurement error ... 71
Figure 4.26. Fraction of Σ3 and special boundaries in SPS nickel as a function of dwell time at constant temperature. The colors correspond to the dwell
time ... 73
Figure 4.27. Fraction of Σ3 and special boundaries in SPS nickel as a function of temperature at constant dwell time. The colors correspond to the
process temperatures ... 73
Figure 4.28. Grain boundary character distribution of SPS nickel samples processed from 400 to 1000°C at 61.9 MPa with no dwell. The black points are the Σ3 values and the gray points are the total special boundary
fraction ... 74
Figure 4.29. Fraction of Σ3 boundaries in CS nickel as a function of dwell time at constant temperature. The colors correspond to the dwell time ... 75
Figure 4.30. Fraction of Σ3 boundaries in CS nickel as a function of temperature at constant dwell time. The colors correspond to the temperature ... 76
xv
for each specimen. The scale bar is the same at each magnification .... 78
Figure 4.33. Orientation maps of SPS nickel processed from 400 to 1000°C at 61.9 MPa with no dwell. The scale bar is the same for all the figures. Black areas are pores. The colors correspond to particular orientations according to the legend ... 80
Figure 4.34. Orientation maps of SPS nickel processed from 500 to 800°C at 61.9 MPa with dwell times of 1 to 10 min. The scale bar is the same for all the figures. Black areas are pores. The colors correspond to particular orientations according to the legend ... 81
Figure 4.35. Orientation maps of SPS nickel processed from 500 to 800°C for 3 min at 41.6 and 79.6 MPa. The scale bar is the same for all the figures. Black areas are pores. The colors correspond to particular
orientations according to the legend ... 82
Figure 4.36. Orientation maps of CS nickel. The scale bar is the same in all figures. Black areas are pores. The colors correspond to particular orientations according to the legend ... 83
Figure 5.1. Comparison of density achieved during SPS and CS processing of nickel as a function of temperature. The SPS samples were processed with no dwell at 61.9 MPa, and the CS samples were sintered for 1 h .. 85
Figure 5.2. Instantaneous density during SPS processing of nickel. Samples were processed at 650°C for 0 and 10 min at 61.9 MPa. The different colors indicate the different dwell times ... 87
Figure 5.3. Instantaneous density during the heating and dwell phase of SPS nickel processed at different ramp rates to 800°C at 61.9 MPa. The
different colors indicate the different ramp rates ... 88
Figure 5.4. Instantaneous density as a function of temperature for the SPS nickel samples processed at different ramp rates to 800°C at 61.9 MPa. The different colors indicate the ramp rates ... 89
xvi
the gray dots to measurements taken at the edge of the samples, and the lines represent the 95% confidence bands for each sample set ... 93
Figure 5.7. Log-log plot of average grain size as a function of time for SPS nickel processed at three different temperatures and 61.9 MPa. The symbols correspond to the different temperatures and the lines are linear fits .... 97
Figure 5.8. Grain size as a function of time for SPS nickel processed at three different temperatures and 61.9 MPa. The lines represent the linear fits to the grain size data ... 99
Figure 5.9. Grain size as a function of time for CS nickel. The lines represent the linear fit to the grain size data ... 100
Figure 5.10. Plot of relative density as a function of temperature for SPS nickel processed at varying ramp rates to 800°C at 61.9 MPa. Only the data up to the dwell period is shown. Colors represent the different ramp
rates ... 103
Figure 5.11. Arrhenius plot used to calculate the apparent activation energy of sintering for SPS nickel samples processed at varying ramp rates. Three curves are shown for specific densities from which the apparent activation energy was calculated ... 104
Figure 5.12. Arrhenius plot used to calculate the apparent activation energy of sintering for SPS nickel samples processed at 61.9 MPa for 10 min. Three curves are shown for specific densities from which the apparent activation energy was calculated ... 106
Figure 5.13. Yield strength of high-purity annealed nickel as a function of temperature, adapted from a report by the National Bureau of Standards [112]. The yield strength decreases with increasing
temperature ... 108
Figure 5.14. Deformation mechanism maps for nickel with grain sizes of 1 and 10
μm [89]. Images taken from the online version of the Frost and Ashby text, available at: http://engineering.dartmouth.edu/defmech/. The highlighted areas show the regions that correspond to the range of SPS process conditions used in this study ... 111
xvii
LIST OF ABBREVIATIONS
CS - Conventional sintering
CSL - Coincident -site lattice
DC - Direct current
EBSD - Electron backscatter diffraction
FAST - Field-assisted sintering technique
P2C - Plasma pressure compaction PAS - Plasma-assisted sintering
PECS - Pulsed electric current sintering
SEM - Scanning electron microscope
xviii
LIST OF SYMBOLS
A - Materials constant for activation energy calculation
b - Burgers vector
B - Collection of material constants for initial-stage sintering
B1 - Thermally activated parameter for initial-stage sintering
B2 - Thermally activated parameter for intermediate-stage sintering
C - Material constant for power-law creep deformation
γ - Surface energy
d - Particle diameter
dm - Mean diagonal length of Vickers indentation
dp - Pore radius
Do - Diffusivity pre-exponential
D - Diffusivity
Db - Grain boundary diffusion coefficient
Ds - Surface diffusion coefficient
Dv - Volume diffusion coefficient
δ - Grain boundary width
F - Force
g - Grain growth exponent
xix
H - Collection of material constants related to the hot-pressing mechanism
k - Boltzmann’s constant
Ko - Rate constant for activation energy calculation
K - Thermally activated parameter for grain growth
Lo - Initial distance between particle centers
ΔL - Change in distance between particle centers
m - Material constant exponent for initial-stage sintering
M - Molecular weight
μ - Shear modulus
n - Material constant exponent for initial-stage sintering
η - Viscosity
P - Vapor pressure
PA - Applied pressure
PE - Effective pressure
Pg - Gas pressure in a pore
q - Pressure exponent
Q - Activation energy
R - Gas constant
R1, R2 - Radii of curvature
ρ - Theoretical density
ρg - Green-body density
xx
σ - Stress, specifically the sintering stress associated with a curved surface
σY - Yield strength
Σ - Coincident-site lattice index
t - Time
ti - Time at the onset of intermediate-stage sintering
T - Temperature
u - Geometric term for densification during intermediate-stage sintering
φ - Stress intensification factor
X - Neck diameter
CHAPTER 1: INTRODUCTION
1.1: Motivation for Research
The properties, processing, and microstructure of any material are interrelated [1].
Different process techniques produce different microstructures, and certain
microstructures may result in superior material properties [1]. A study of spark plasma
sintering (SPS), a process which has been reported to improve the properties of a wide
variety of materials [2-40], is presented here. This study was performed with
commercially-pure nickel powder sintered both using conventional sintering (CS) and
SPS, under a variety of conditions, to determine how the microstructure evolved as a
function of process conditions. This study also provided some insight into the
mechanisms that are active during SPS and some understanding of the kinetics of
sintering and grain growth during SPS. Microstructural characterization using electron
backscatter diffraction (EBSD) allowed for observation of grain growth inside
polycrystalline nickel powder, as well as growth and densification of the powder
particles. This study on a simple, pure metal system aids understanding of the
microstructural evolution, sintering mechanisms, and kinetics of more complex material
systems.
Nickel was selected due to its well characterized behavior during sintering and
annealing [41-55]. The use of a straightforward, well understood system allows for
SPS and those that result from conventional processing. Under CS conditions, nickel will
undergo surface diffusion at temperatures below 600°C, and will not densify at
temperatures below that point [41, 42, 55]. Above that temperature, densification will
progress due to volume diffusion [41, 42, 55]. Grain growth during sintering of nickel
has a t1/3 dependence [56, 57], and during annealing has a t1/2 dependence [45, 47, 49, 50, 53, 54], where t is time. Another important microstructural characteristic is the grain
boundary character distribution. The grain boundary energy in nickel can be significantly
reduced by the formation of twin boundaries, and high fractions of twin boundaries are
found in annealed nickel [49, 54, 58]. The twin boundary fraction in sintered nickel is
strongly temperature dependent and increases with increasing temperature [43]. Results
from this comparative study of CS and SPS nickel are expected to correlate with
nickel-based alloys and other systems processed with SPS.
1.2: Research Objectives
The primary objective of this research was to characterize the effects of SPS
process conditions on the microstructure of nickel in comparison to conventional
sintering of nickel. A comparison of the process techniques gives insight into sintering
mechanisms that are unique to the SPS process and the kinetics of sintering and grain
growth during SPS. An understanding of the microstructural evolution during SPS is
essential for understanding the processing-properties relationship that is extensively
discussed in SPS literature.
Processing with SPS allows for different temperatures, heating rates, dwell times,
University and located at the Center for Advanced Energy Studies at a variety of all these
conditions to determine how each individually affects the microstructure. For
comparison, nickel was also conventionally sintered at different temperatures and for
different dwell times. Characterization of the density, hardness, and porosity was
performed to understand the densification and to give an insight into the mechanical
properties. Microstructural characterization was performed using scanning electron
microscopy (SEM) and analysis using EBSD. This analysis resulted in the effect of SPS
and CS process conditions on grain size and grain boundary character. Characterization
using EBSD was central to this study as it allowed for a thorough analysis of the
microstructure and how it changed according to process conditions which, in turn, shows
CHAPTER 2: BACKGROUND INFORMATION
2.1: Overview of Sintering Processes
2.1.1: Traditional Sintering
Sintering is the consolidation of powders into solid parts [56, 57, 59]. Sintering
techniques have been used for thousands of years to make pottery, jewelry, bricks, and
other materials [56, 57, 59]. Little consideration was given to the science of sintering
until the early 20th century, beginning with the work of Coolidge on tungsten powders for light bulb filaments [59]. Sintering has since been extensively studied and the theoretical
models first developed by Kuczynski, Coble, Kingery, Berg, Johnson, and others provide
the basis for sintering theory today [60-66]. Several textbooks are available on the theory
and science of sintering [56, 57, 67]. The summary provided in this section is taken from
German [56, 57].
Sintering is the bonding of particles by diffusion of atoms to reduce surface area.
Conventional sintering is typically performed by pressing powders into a compact and
heating the compact to a point, below the melting temperature, where the atoms can
diffuse. Diffusion is a thermally activated process, requiring a minimum energy to begin.
The activation energy for thermal diffusion is described by the Arrhenius relation:
⎟ ⎠ ⎞ ⎜
⎝ ⎛− =
RT Q D
D oexp (2.1)
where D is diffusivity, Do is the diffusivity pre-exponential, Q is the activation energy for
is the temperature. As atoms diffuse, some will move into positions that reduce the total
surface area and thus reduce the surface energy. The driving force for atoms to move to
positions that reduce the surface energy is associated with the stress at the particle
surface. The Laplace equation gives the stress of a curved surface, σ, by:
⎟⎟ ⎠ ⎞ ⎜⎜
⎝ ⎛
+ =
2 1
1 1
R R
γ
σ (2.2)
where γ is the surface energy, and R1 and R2 are the radii of curvature of the surface.
Particles with small radii of curvature have high associated stresses. Also, the surface
energy of a particle is inversely related to its diameter; smaller particles have higher
surface energies per unit volume. Thus, when two particles are touching, there is a
driving force to reduce the stress and surface area by increasing the radii of curvature at
the contact point. As atoms diffuse to the contact region, a neck, or the initial bond,
forms between the particles. After initial neck formation, atoms continue to diffuse to the
neck region, which increases the radius of curvature and, in turn, slows the sintering
process as the driving force is reduced. In the intermediate sintering stage, pore volume
is decreased and the idealized pore structure changes from being irregular and angular to
an interconnected cylindrical structure along the grain boundaries. As pore volume
continues to decrease, the structure becomes unstable (the breakdown is where the ratio
of pore length to radius becomes larger than 2π) and at the final stage of sintering, the
pore structure collapses into isolated spherical isolated pores. The isolated pores do not
inhibit grain growth as much as the interconnected structure does which leads to
increased grain growth during late stage sintering. Grain growth and isolated pores at
late stage sintering can slow the rate of densification, especially if the pores contain
The sintering process can include plastic deformation or particle rearrangement,
but at all stages involves the diffusion of atoms. Generally, diffusion processes fall into
two main categories: surface and bulk transport, illustrated in Figure 2.1. Surface
transport (Figure 2.1a) involves the rearrangement of particles to form a neck without any
shrinkage or densification. Surfaces of crystals consist of various types of defects, such
as surface vacancies, adsorbed atoms, ledges and kinks, many of which can participate in
diffusion. Surface diffusion involves the breaking away of an atom, usually from the site
of a surface defect, random motion of that atom across the surface, and finally
reattachment at a different site, possibly another defect. In neck formation in surface
diffusion, atoms fill sites at the interface between particles that reduce the curvature and
thereby reduce the surface energy. Surface diffusion is the dominating mechanism at low
temperatures in most metals, including nickel [41, 56]; metals with high vapor pressure
also undergo evaporation-condensation surface transport. Evaporation occurs on a
particle surface and atoms move across the pore space to be deposited on a different
surface.
Bulk transport processes involve the movement of mass from the interior of the
particle to the neck region and cause shrinkage (Figure 2.1b). Bulk transport includes
volume diffusion, grain boundary diffusion, plastic flow, and viscous flow. Plastic flow
is the glide and climb of dislocations due to stress at the neck and absorption of vacancies
during pore size reduction. Plastic flow is important during the heating stage (especially
for compacted powders with high dislocation density) but decreases as dislocations are
annealed out of the particles. Viscous flow, where materials with decreased viscosity at
phase sintering, or when liquid is present at grain boundaries. Grain boundary diffusion
is important in most polycrystalline metals as it is more energetically favorable than
diffusion through the lattice.
a)
b)
Figure 2.1. Idealized two sphere sintering model. The surface transport mechanisms (a),
evaporation-condensation (E-C), volume diffusion of atoms from the surface to the
surface (VD), and surface diffusion (SD) lead to neck formation, but not to a change in
the particle centers. The bulk transport mechanisms (b), plastic flow (PF), grain
boundary diffusion (GB), and volume diffusion (VD) are responsible for changes in the
particle centers (densification). Adapted from German [56, 57].
SD
VD
E-C
D
X
X
d
L
0-
Δ
L
L
0=d
During initial stage sintering, two processes occur: neck growth and shrinkage.
The equation for isothermal neck growth in initial stage sintering is given by:
m n
d Bt d
X =
⎟ ⎠ ⎞ ⎜ ⎝
⎛ (2.3)
where X is the neck diameter, d is the particle diameter, t is time, and B, m, and n are a
collection of material and geometric constants. The values of B, m, and n depend on the
sintering mechanism and are given in Table 2.1.
Table 2.1: Initial stage sintering mechanisms for Equation 2.3.
Mechanism n m B
Viscous flow 2 1 3γ/η
Plastic flow 2 1 9πγbDv/kT
Evaporation-condensation 3 2 (3Pγ/ρ2)(π/2)1/2(M/kT)3/2
Volume diffusion 5 3 80DvγΩ/kT
Grain boundary diffusion 6 4 20δDbγΩ/kT
Surface diffusion 7 4 56DsγΩ4/3/kT
γ = surface energy Dv = volume diffusivity
η = viscosity Ds = surface diffusivity
b = Burgers vector Db = grain boundary diffusivity
k = Boltxzmann's constant P = vapor pressure T = absolute temperature M = molecular weight
ρ = theoretical density Ω = atomic volume
δ = grain boundary width
Several characteristics of sintering can be inferred from the equations in Table
2.3. For example, there is a strong dependence on inverse particle size, meaning that
smaller particles sinter more rapidly. Also, surface diffusion and grain boundary
diffusion are more important for smaller particles. There is an exponential dependence
contain diffusivity terms, and diffusivity was defined in Equation 2.1 to be exponentially
dependent on temperature. Therefore small changes in temperature are expected to have
large effects. Neck growth is proportional to time, and therefore time is expected to have
a smaller contribution than does temperature.
The equation for shrinkage during sintering is given by:
m n n o d t B L L 2 1 2 = ⎟⎟ ⎠ ⎞ ⎜⎜ ⎝ ⎛ Δ (2.4)
where ΔL is the change in the distance between particle centers (see Figure 2.1b), Lo is
the starting distance between particle centers (the diameter of one particle), and B1 is
exponentially dependent on temperature and defined by:
⎟ ⎠ ⎞ ⎜ ⎝ ⎛ − = RT Q B
B1 exp (2.5)
where B is the same as defined in Equation 2.3 and Table 2.1. The shrinkage equation is
only valid for bulk transport mechanisms and does not require measuring the neck
diameters between particles.
The densification during initial stage sintering is small. Intermediate stage
sintering is the most important for densification and for determining the final properties
of the specimen, but is the most complex and least understood. During intermediate stage
sintering, pore rounding, densification, and grain growth occur simultaneously. There are
no good fundamental models for intermediate stage sintering, but empirical models have
been developed. Densification during intermediate stage sintering is given by:
⎟⎟ ⎠ ⎞ ⎜⎜ ⎝ ⎛ + = i i S t t
B2ln
ρ
where ρs is the fractional density, ρi is the density at the beginning of the intermediate
stage, B2 is a thermally activated parameter similar to B1 which was given by Equation
2.5, and ti is the time corresponding to the onset of intermediate stage sintering.
Curvature gradients at the pores have been largely eliminated at this stage and the driving
force becomes the elimination of remaining surface energy. The bulk diffusion
mechanisms reduce pore volume by the creation of a vacancy at the pore surface and the
diffusion of the vacancy to a grain boundary. The rate of densification by volume
diffusion, dρs/dt, is given by:
3
kTG D u dt
d S Ω V
= γ
ρ
(2.7)
where u is a geometric term (usually near 5) and G is the grain size. Grain boundaries
have a strong effect on sintering; limited grain growth promotes densification. The mean
grain size is a function of time:
Kt G
G g
o
g = + (2.8)
where Go is the initial grain size and K is a thermally activated parameter, similar to B1
and B2, and g is the grain growth exponent. Grain growth increases as the pores either
coalesce or as porosity is eliminated.
As stated previously, the pore structure collapses from an interconnected network
into a set of isolated pores during final stage sintering. Grain growth becomes more
active as the isolated pores have less of a pinning effect. Normally pores begin to close at
15% porosity and are all closed at 5% porosity. Final stage sintering is a slow process
where grain growth and densification are in competition. The densification during final
⎟⎟ ⎠ ⎞ ⎜⎜ ⎝ ⎛ − Ω = g P V S P d kTG D dt
dρ 12 4γ
3 (2.9)
where dP is the pore radius and Pg is the gas pressure in the pore. Like the intermediate
sintering equation, densification is inversely proportional to the cube of grain size.
Densification occurs only as the pore volume decreases by the diffusion of vacancies, by
bulk transport mechanisms, from the pore surface to grain boundaries. Densification is
slowed and can be stopped by trapped gas in the pores when the surface energy of the
pore is equal to the gas pressure:
P gd P = γ 4 (2.10)
Differences in pore curvature can cause smaller pores to be absorbed into larger pores in
order to reduce the surface energy. Usually, achieving full density requires a vacuum or
another sintering technique such as hot-pressing.
2.1.2: Pressure-Assisted Sintering
The application of stress during sintering may be required in order to attain
desirable densification and to eliminate porosity. An applied pressure will supplement
the inherent sintering stress and increase the densification process, especially at high
temperatures where the yield strength is decreased. Temperature plays the same role in
pressure-assisted sintering as in traditional sintering, by increasing mass motion as well
as decreasing the yield strength of the material which allows for increased response to
applied stress. Pressure-assisted sintering techniques include hot pressing, hot isostatic
pressing, forging, spark plasma sintering and others. Each technique applies pressure in a
stated, references from this section come from textbooks by German and Rahaman [56,
57, 67].
Pressure-assisted sintering techniques have several advantages over conventional
sintering, such as an increased densification rate, reduced porosity, and increased
uniformity of microstructure when performed properly. Pressure-assisted sintering can
also be used to produce materials that cannot be processed by pressure-less techniques.
However, pressure-assisted sintering techniques also have inherent drawbacks.
Contamination at particle contacts is very common with pressure-assisted sintering
techniques, which typically require less time than traditional sintering. Surface oxide
films may remain in the compact and decorate the grain boundaries, decreasing the
fracture resistance where the time required to process by traditional sintering may be
sufficient to break down the oxide layer. The application of pressure also commonly
results in distortions of the powder compact and anisotropic shrinkages. Grain growth is
also accelerated by high pressures as applied pressure increases the packing coordination
number, bringing particles into close contact sooner in the sintering process. Thus, grain
growth begins sooner than in traditional sintering where grain growth is slowed by
porosity. Pressure-assisted sintering is typically performed at lower temperature than
conventional sintering to avoid excessive grain growth.
Accelerated grain growth in pressure-assisted sintering promotes earlier pore
closure than with traditional sintering. The pores become stable once they reach
equilibrium between grain boundary energy and surface energy. If the grains are smaller
than the pores, a decrease in pore volume would decrease the surface energy in exchange
not significantly affect the grain boundary energy. Pores in a powder compact can also
be forced close by pressure, but a subsequent heat treatment may induce porosity again.
Depending on the microstructure, the effective pressure can be much higher than
the applied pressure during pressure-assisted sintering. The applied load is not
distributed evenly across the entire area of the rams or punches, but rather across the
particle contact surfaces. Since stress is force over area, smaller contact points have
greater stresses, and as the contact points grow, the stress diminishes. Stress
amplification at particle contacts enhances sintering by even low applied stresses. Since
applied stress is generally constant, the effective pressure, or pressure at the contacts,
decreases with densification. The applied pressure is generally constant, but the effective
pressure changes as the particle contacts change size, and it is the effective pressure that
affects the densification rate. Various models for the relationship between applied and
effective stress have been proposed, all of which are functions of the fractional density.
The models also assume the stress is uniform for all contacts and is uniform across each
contact, neither of which is true in reality. The high pressure at particle contacts leads to
localized deformation which improves the bond quality between particles. Also, high
strain rate processes (e.g., forging and extrusion) produce stronger materials whereas low
strain rate processes that work by diffusional creep (e.g., hot isostatic pressing) result in
annealed microstructures that are dense, but have decreased strength. In the extreme, the
capillary stress between particles (sintering stress) will exceed the yield stress and cause
rapid densification.
At all stages of densification, the densification rate is dependent on stress and
primary deformation mechanisms exist during pressure-assisted sintering: viscous flow,
plastic flow, and creep. Viscous flow occurs in materials where a glass or liquid is the
deformable phase and is not expected to be applicable in this study.
Plastic flow is the deformation of the compact at stresses above the yield strength
of the material. Yield strength decreases with increased temperature and, at extreme
pressures, it is possible to achieve 100% density at high temperatures. Typically, stress
concentration at particle contacts initially exceeds the yield strength and deformation
occurs by plastic flow. The final density attainable by plastic flow is estimated by:
3 / 1 3 3 . 1 ) 1 ( ⎥ ⎦ ⎤ ⎢ ⎣ ⎡ + − = g Y A g s P ρ σ ρ
ρ (2.11)
where ρg is the green density, PA is the applied pressure, and σY is the yield strength. This
equation is valid for final densities below 90% and at higher final densities, the density
attainable by plastic flow is given by:
⎟⎟ ⎠ ⎞ ⎜⎜ ⎝ ⎛ − = Y A s P σ
ρ 1 exp (2.12)
As particle contacts grow, the effective pressure decreases, but deformation will continue
by diffusional flow. Initial densification is due to particle rearrangement from the shear
stress and plastic flow. Grain boundary and volume diffusion become dominant as
densification continues. Diffusion controlled processes have a small dependence on
stress and strong dependence on temperature. The opposite is true for dislocation
controlled densification.
Diffusional flow and stress combine to form a creep densification process.
Depending on the temperature, pressure, and grain size, creep occurs by different
by vacancy diffusion in response to the stress gradient between grain boundaries in
tension and those in compression. The shrinkage rate for volume diffusion controlled
creep is given by:
2 0) 13.3
/ ( kTG P D dt L L
d VΩ E
= Δ
(2.13)
where ΔL/L0 is the linear shrinkage, DV is the volume diffusion coefficient, Ω is the
atomic volume, and PE is the effective pressure. Coble creep is accommodated by
diffusion along grain boundaries. The shrinkage rate depends on atom removal from the
grain boundary and deposition at the neck. The Coble creep shrinkage rate is estimated
by:
2 0) 47.5
/ ( kTG P D dt L L
d BΩ E
=
Δ δ
(2.14)
where DB is the grain boundary diffusion coefficient and δ is the grain boundary width.
Smaller particles increase the number of grain boundaries for diffusion and promote
densification. The third creep model, power law creep, occurs at both high temperature
and pressure, and depends on the rate of dislocation climb. The empirical equation for
shrinkage rate for power law creep is given by:
q E V P kT D Cb dt L L d ⎟⎟ ⎠ ⎞ ⎜⎜ ⎝ ⎛ = Δ μ μ ) / ( 0 (2.15)
where C is a material constant, b is the Burgers vector, q is the pressure exponent, and μ
is the shear modulus. Each of the creep modes is benefitted by small grain size.
The pressure-assisted technique that is most similar to spark plasma sintering is
hot-pressing. In hot-pressing and spark plasma sintering, the applied load is uniaxial, but
function of the axial stress and the ratio of the two is nearly constant. The radial and
axial pressure differential creates a shear effect that improves bonding, the collapse of
large flaws, and can disrupt the surface contamination of powders [2, 56, 57, 68]. In hot
pressing, graphite die are typically used, which can contaminate the powder compact.
The initial densification during hot pressing occurs by particle rearrangement and plastic
flow at the particle contacts. As the particle contacts grow, thus decreasing the effective
stress to the point where it falls below the yield strength, densification depends on grain
boundary and volume diffusion. A generalized equation for densification during
hot-pressing is given by:
q A g
q
s P
kT G HD dt
dρ φ
ρ =
1
(2.16)
where H is a collection of material constants and parameters related to the deformation
mechanism, D is the diffusivity coefficient, φ is the stress intensification factor, G is the
grain size, k is Boltzmann’s constant, T is temperature, PA is the applied pressure, and the
pressure exponent q and grain size exponent g are determined by the densification
mechanism. Determining the exponents can give insight into the mechanism of hot
pressing. The values of the exponents q and g are given in Table 2.2.
Table 2.2. Values of the exponents q and g for equation 2.16.
Grain Size Pressure Exponent Exponent
Mechanism g q
Volume Diffusion 2 1
Grain Boundary Diffusion 3 1 Plastic Deformation 0 >3
2.1.3: Spark Plasma Sintering
Spark plasma sintering (SPS) is a rapid, commercial sintering process developed
over the past several decades [15]. As early as 1933, patents were issued for machines
that heated and sintered powders by passing electric current through them [69-71]. In
1967 in Japan, Inoue patented a machine for rapidly sintering powders by a spark
discharge between the particles [72]. The short processing time interested Lockheed
Missile and Space Company who licensed and then acquired the “spark sintering”
technology to produce beryllium parts for Poseidon missiles [4]. Work in Japan and
America continued through the 1970s and commercial machines ultimately became
available under a variety of names [9, 28, 73]. Several alternative terms have been used
to describe spark plasma sintering including plasma pressure compaction (P2C) [35] and plasma-assisted sintering (PAS) [25]. The use of the word plasma implies spark
generation (plasma) between particles, while other names like field assisted sintering
technique (FAST) [2] and pulsed electric current sintering (PECS) [34] pointedly avoid
the words spark and plasma. Despite the disagreement on the creation of a spark or
plasma [74], SPS remains one of the most common names and is also part of the model
name of the machine used in this study. The name SPS will be used in this thesis.
Spark plasma sintering uses high amperage, low voltage, pulsed DC current and
uniaxial pressure to consolidate powders [15, 75]. A schematic of the SPS process is
given in Figure 2.2. Processing is performed in a vacuum chamber with controllable
atmosphere. During processing, the chamber is usually at negative pressure. Powder is
and punches are placed between the rams which must maintain a minimum pressure for
good electrical contact. The rams also act as electrodes for the current.
DC Pulse
Generator
graphite die
punch
thermocouple
graphite spacer
powder
electrode/ram
DC Pulse
Generator
graphite die
punch
thermocouple
graphite spacer
powder
electrode/ram
Figure 2.2 Schematic of the SPS process. Powder is held in a conductive die, and heated
directly using pulsed DC current in the presence of an electric field and under applied
pressure. Temperature is measured at the die wall by a thermocouple or by optical
The sample is heated by a pulsed DC current which passes through the electrodes
and die in the presence of a low-voltage electric field. Heat is produced from the
dissipation of energy by the punches, die, and powder. This is known as resistive or
Joule heating [15, 75]. However, voltage and current cannot be controlled directly.
Instead, a temperature profile is programmed by the user and the current is adjusted by
the SPS unit accordingly. Temperature is measured either by means of a thermocouple
inserted into the die wall or by an optical pyrometer focused on a blackbody cavity in the
die wall.
During sintering, the current is passed from the electrodes into the punches which
are in contact with both the powder and the die. From there, the current pathway is
different for conductive powders than for conductive powders [30, 76-80]. For
non-conductive powder, the current must pass through the die and heat the powder indirectly,
while for conductive powder, the current can pass through the powder and heat it directly
[30, 76-80]. If the current pathway is isolated by coating the die and punch walls with
boron nitride, conductive powders will sinter but non-conductive powders will not as no
sufficiently conductive pathway exists for the current to create heat and sinter the powder
[77]. Current flow through the sample is dependent on the conductivity of the powder as
well as the sample diameter [30, 76, 78, 79]. All of the current can flow through
conductive samples with large diameter, but for smaller samples some of the current will
flow through the die, regardless of sample conductivity [76].
The different current pathways for conductive and non-conductive powders lead
to different temperature distributions in the samples [76, 78, 80]. A combination of
radial temperature distribution in conductive samples [21, 76, 78, 80, 81].
Non-conductive samples have a more uniform temperature distribution; the current passes
around the sample and the powder is more evenly heated from the die [21, 76, 78, 80,
81]. Temperature gradients can lead to sample inhomogeneity [76, 79]. For example,
zirconia processed with SPS showed a color gradient from oxygen non-stoichiometry
[76], and ZrO2-TiN composites had higher hardness at the center of the sample than at the edge due to increased porosity at the edge [79].
The accuracy of the temperature measurements made on the outside of the die
depends on several factors. Generally, the die wall temperature, which is used to control
the electrical current, is much lower than the actual sample temperature [30, 76, 78-80,
82, 83]. The difference between the sample temperature and die temperature increases
with increasing temperature [76, 79, 80]. During heating of conductive samples, the die
wall temperature lags behind the sample temperature, but for non-conductive samples the
opposite is true [81]. During the dwell stage, the sample-die temperature difference is
less for samples with high thermal conductivity than for samples with low thermal
conductivity [79, 81]. Further, the temperature difference increases with increasing die
wall thickness and sample diameter [21, 79]. Insulating the die wall reduces the
discrepancy between die and sample temperature, but the most accurate method of
measuring the actual sample temperature is to record the temperature of the upper punch,
where the current density is the highest and the temperature is closest to that of the
sample [21, 76, 79-81].
Despite the inherent difficulty of measuring temperature, SPS has been reported
materials with superior properties than those processed with comparable techniques
[2-40]. It has been proposed that the actual temperature of the samples in SPS is not
different than that required to produce identical results with hot-pressing [82]. However,
several studies have shown that local temperature distributions exist within a powder
compact and that these distributions give rise to the processing advantages observed in
SPS [27, 84, 85]. The resistance is higher at the particle contact points where the
cross-sectional area is smaller, and so the energy dissipation, and therefore temperature, is
greater at the particle contacts than at the center of the powder particle [27]. During
processing, the contact points will have a higher temperature than the bulk material and
will allow necks to form much faster than in a system with a homogenous temperature
[27, 84, 85]. Song et al. and Olevsky et al. calculate that the temperature at the particle
contacts during initial processing can be high enough to melt or even vaporize the
material while the temperature of the entire compact rises only slightly [27, 84, 85].
Many, especially early researchers, attributed advantages of processing with SPS
to the creation of a current arc between the powders facilitating neck formation or the
formation of a plasma around the powders during processing [2, 28, 34, 68, 72]. For
example, aluminum is difficult to sinter by traditional methods due to the coherent oxide
layer which forms around the powder [34, 68]. However, aluminum does sinter well with
SPS, which researchers have attributed to the presence of plasma which removes, or at
least disrupts, the oxide layer and allows diffusion to proceed [34, 68]. While some
earlier techniques may have indeed produced sparks due to high potentials, the
conductive pathway through the die and low voltages make the formation of a current arc
spectroscopy, direct observation, and high-speed voltage measurements failed to find any
evidence of plasma in spark plasma sintering [74]. The authors suggest that the low
potentials employed during SPS are insufficient to produce an arc [74].
The increased densification during SPS can include both thermal and electrical
contributions [84-88]. In addition to temperature gradients that facilitate diffusion, the
high heating rates possible in SPS can bypass the surface diffusion processes which
smooth the pore structure and slow grain boundary diffusion [84, 85]. Localized high
temperature regions can also increase the rate of power-law creep [84, 85, 89].
According to creep deformation mechanism maps of metals, temperature and pressure
conditions during processing with SPS are typically in or near the region of power-law
creep [84, 85, 89]. As creep processes are important to densification during hot-pressing,
they are expected to be important in SPS as well [84, 85]. However, beyond purely
thermal effects, the contributions to densification by electrical conditions inherent to SPS
may also be significant [8, 14, 15, 22, 36, 86-88]. Atoms can move in response to an
applied electric field and due to an applied current [88, 90]. Unfortunately, as the
temperature is a result of the applied current, it is difficult to clearly separate the effects
of temperature, current, and electric field [15]. Electron-wind force, the term used to
describe the motion of atoms in the direction of applied DC current due to momentum
transfer from electrons to atoms [90], is considered to be negligible during SPS [15, 88].
It is theorized that the applied electric field and current increase either the mobility or the
concentration of defects at grain boundaries as calculated activation energies do not
imply that electromigration—diffusion in response to an electric field—is the dominant
atoms by electromigration can have a significant contribution for systems with little
porosity, or for fine powders [88]. The pattern of DC pulses in SPS has not been shown
to have any effect on material properties [15, 87].
2.2: Densification and Microstructural Evolution in Pure Metals by SPS
The majority of SPS studies focus on the unique properties that result from
complicated material systems when processed by SPS [15, 19]. However, many studies
have been performed that investigate densification of pure metals by SPS [3, 7, 9, 12, 13,
23, 27, 31, 37-40, 68, 83, 91-94]. It has been found that temperature contributes more to
the final density of metals processed by SPS than any other SPS process parameter [7, 12,
23, 31, 37-40, 83, 93, 94]. In iron, copper, and molybdenum, the density increases
linearly with temperature until the density reaches approximately 95% theoretical, at
which point the effect of temperature on density is diminished, similar to traditional
sintering [7, 23, 31, 37, 40, 94]. Other SPS process parameters do not show as significant
of an effect as the temperature [7, 23, 31, 37, 40, 94]. Dwell times of up to 15 min do not
significantly increase final density in SPS copper [37, 39]. When density is plotted as a
function of time, it increases linearly during the heating phase, and once the peak
temperature is reached, the densification rate decreases to an equilibrium rate much
smaller than that seen during heating [7, 23, 37]. The effect of pressure on the density of
metals during SPS is more significant than time, but less than temperature [23, 37]. The
pressure effect on density in molybdenum was only seen up to pressures of 50 MPa, at
which point increasing pressure did not increase density [23]. Heating rates of 50 –
Many SPS studies have shown that near theoretical density can be achieved in a
wide variety of material systems with little or no grain growth [2, 3, 5, 12, 17, 18, 23, 29,
35, 37-40, 82, 93, 94]. Alumina, yttria, and other ceramics have been processed to full
density by SPS from nano-sized powders, where the grain size increased by less than a
factor of 2, remaining in the nano-scale range [18]. In pure metals, the same trend is seen
[3, 12, 23, 35, 38-40, 93, 94]. For example, in SPS processed tantalum, the density
increased from 84 to 93% theoretical as the temperature was increased from 1500 to
1700°C, but the average crystallite size did not change [3]. Densification occurs first
during SPS of pure metals, and significant grain growth occurs after densification is
nearly complete, just as in final stage conventional sintering [39, 94]. Optical
micrographs of SPS copper and molybdenum show that with increasing temperature,
particles first bond and then consolidate, reducing porosity without significant changes to
the grain size [39, 94]. Densities of up to 97% can be achieved in copper without a
significant increase in grain size [37, 39]. However, above a certain temperature the
grain size will show a sharp increase [3, 37, 39]. The grain size in copper increased from
approximately 2.5 to 6.5 μm above 750°C for otherwise identical process parameters [37,
39]. In tantalum, the average crystallite size increased by more than a factor of 4, from
22 to 113 nm, with an increase in temperature of 1700 to 1900°C [3]. In nano-sized
copper, grain growth was also found to increase exponentially with increasing
temperature [37]. Increasing dwell time and applied pressure also increase the grain size
in SPS molybdenum and copper, but, similar to the effect on density, not as significantly
as temperature [23, 39]. Limited information is available on the grain orientation that
aluminum or tantalum processed by SPS [3, 13], while fiber texture in SPS tantalum is
reduced compared to that in hot-pressed tantalum [3].
2.3: Powder Metallurgy Studies of Nickel
Pure nickel was used for this study. A summary on studies of nickel that relate to
the experiments performed in this thesis are presented here. Studies on the sintering and
deformation of nickel are presented first, followed by grain growth and grain boundary
character in nickel, and finally a summary of SPS studies of nickel.
2.3.1: Conventional Nickel Processing
The sintering of nickel has been extensively studied, and Ni was frequently used
in early sintering studies to understand sintering in general [42, 44, 48, 51, 65]. Before
densification occurs in nickel powders, the NiO layer on the powder surfaces is broken
down by thermal dissociation or reduction by a process gas such as hydrogen [12, 41,
95]. After the removal of the NiO layer on the powder surfaces, densification proceeds
by diffusion processes [41, 56, 57]. The activation energies for the different diffusion
mechanisms in nickel are given in Table 2.3 [41, 42, 55-57]. The identification of the
sintering mechansism in nickel has undergone some refinement [51], but current
textbooks state that nickel densifies by volume diffusion [41, 56, 57]. Significant
densification by volume diffusion begins around 600°C, below which densification does
Table 2.3. Reported activation energies for nickel diffusion. References are from
German and Ashby [42, 55-57].
Q (kJ/mol) Q (kJ/mol) German Ashby Surface Diffusion 164 199 Grain Boundary Diffusion 108 115 Volume Diffusion 298 271
The densification mechanism during sintering of nickel has been found to change
with particle size [12, 51, 95]. As nickel powder decreases from 10 μm down to 0.1 μm,
grain boundary and surface diffusion combined become prevalent over volume diffusion
[12, 51, 95]. During initial sintering, line defects (e.g., dislocations) promote
densification in larger nickel powders [95], but for smaller powders, as much as 80% of
initial stage densification may be due to interparticle gliding [12]. Further, the activation
energy for sintering of nickel has been shown to change with particle size [96]. The
activation energy of sintering for nickel nanopowder was found to be 66.2±3 kJ [96].
In relating the mechanisms of conventional sintering to SPS, a deformation
mechanism map may provide insight [88, 89]. Deformation mechanism maps show
regions where diffusion, creep, and plastic deformation processes are expected to be
dominant as functions of stress and temperature [89]. The mechanism of deformation in
nickel also depends on grain size [89, 97], and two deformation mechansism maps for
grain sizes found in this study are presented for nickel in Figure 2.3 [89]. For nickel with
grains that are 1 mm (larger than presented here), the deformation mechanism map shows
a large power law creep area and separate grain boundary and lattice diffusion areas [89].
temperature [89, 97]. At grain sizes of 1 μm, diffusional flow, where grain boundary
creep is the dominant mechanism, is the primary creep mechanism over nearly the full
temperature range used in this study [89].
Figure 2.3. Deformation mechanism maps for nickel with grain sizes of 1 and 10 μm
[89]. Images taken from the online version of the Frost and Ashby text, available at:
http://engineering.dartmouth.edu/defmech/.
2.3.2: SPS of Nickel
Several studies have been performed on nickel powder using SPS processes [12,
19, 83, 91, 92]. The first studies focused on creating powder compacts using
electrocompaction [91, 92]. The electrocompaction process is not the same as the current
spark plasma sintering process, but rather is accomplished by discharging capacitors
across powder compacts at kilovolt potentials in microseconds [91, 92].
Electrocompaction studies on nickel powder found that the energy dissipation at the
melt the nickel oxide on the powder surface as well [92]. Further, the volumetric
expansion of the heated powder would have produced a pressure sufficient to break the
oxide layer [92]. Nearly all the oxide was removed from nickel powder processed by
electrocompaction, and the remaining oxide was broken down to oxygen and nickel
which diffused into the powder matrix [92].
A study was done in 2000 by Kim et al. which sintered nickel using the now
standard SPS process [83]. Nickel powder was processed in a 30 mm diameter die (15
mm inner diameter) at 40 MPa with no dwell time, a heating rate of 2.4°C/min, and the
temperature was measured using a thermocouple on the die surface [83]. A heating rate
of 2.4°C/min is much lower than the rate used in this study. At die temperatures of 400,
500, and 800°C, the actual sample temperatures (measured using a second thermocouple
and a solid nickel blank) were approximately 440, 560, and 930°C respectively [83]. It
was also determined that the actual temperature of a powder compact would be higher
than the temperature measured on a solid nickel blank given the same SPS parameters
due to differences in conductivity [83]. Nickel processed to 400°C showed almost no
particle bonding, but at 500°C necks formed and plastic deformation was observed [83].
At 800°C, the nickel compact reached 98% theoretical density [83]. Nickel processed at
varying ramp rates showed that the maximum densification rate is observed at
approximately 500°C (extrapolated actual sample temperature) [83]. Dwell times of up
to 3 minutes had very little influence on densification [83]. Likewise, varying ramp rates
from 0.8 to 3 °C/min had essentially no effect on the final density when processed to