DEMOGRAPHIC RESEARCH
VOLUME 38, ARTICLE 13, PAGES 309
,
320
PUBLISHED 23 JANUARY 2018
http://www.demographic-research.org/Volumes/Vol38/13/ DOI: 10.4054/DemRes.2018.38.13
Descriptive Finding
Educational differences in period fertility:
The case of South Korea, 1996–2010
Eunkoo Lee
© 2018 Eunkoo Lee.
This open-access work is published under the terms of the Creative Commons Attribution 3.0 Germany (CC BY 3.0 DE), which permits use, reproduction, and distribution in any medium, provided the original author(s) and source are given credit.
1 Introduction 310
2 Data 311
3 Method 311
4 Results 312
5 Conclusion 317
Demographic Research: Volume 38, Article 13 Descriptive Finding
Educational differences in period fertility:
The case of South Korea, 1996–2010
Eunkoo Lee1
Abstract
BACKGROUND
Previous studies on education-specific fertility in South Korea suggest that fertility differentials across educational groups have been diminishing in recent years.
OBJECTIVE
This study aims to verify whether education-specific fertility differentials have diminished in South Korea, as suggested by previous studies.
METHODS
I use data from the 10% sample of South Korea’s 2010 census to estimate the education-specific period total fertility rate (TFR) by using the own-children method.
RESULTS
I observe a steep rise in fertility for women with middle school or less (low education) education since the early 2000s. I find a large proportion of young foreign-born women concentrated in this low-education group. When I repeat the analysis considering only native-born Korean women this increasing pattern disappears: Native-born Korean women with low education had the lowest fertility level throughout the period of analysis (1996–2010).
CONCLUSIONS
Contrary to previous studies’ finding that the education-specific fertility differential gap is narrowing in South Korea, I find that the period TFR for the low-education group shows a sharp increase in fertility level since 2005 due to the increase of foreign-born women, who are mostly young with a low level of education. After removing foreign-born women from the data set, the low-education group persistently had lower fertility than other groups.
CONTRIBUTION
By capturing the impact of the recent demographic change resulting from the increase in international marriages, this study contradicts the previous finding that the fertility gap between educational groups in South Korea has been diminishing in recent years.
1. Introduction
Education is one of the most important factors influencing fertility behavior. There have been a few studies that attempt to quantify fertility differentials by level of education in South Korea (hereafter referred to as Korea). However, education-specific fertility estimates are not readily available due to methodological challenges and data availability. Furthermore, education-specific fertility estimates from extant studies are not easily comparable due to differences in data sources, methodology, and the criteria used to classify educational groups.
A recent study by Yoo (2014) estimates completed cohort fertility by utilizing the question in the census that asks the number of children ever born. Yoo (2014) uses past censuses to estimate completed cohort fertility for women born between 1926 and 1970. Based on these estimates, Yoo (2014) concludes that fertility differentials in Korea have been diminishing across all educational levels, arguing that Korea does not conform to Bongaarts’ (2003) finding that educational differentials in fertility continue to persist in post-transitional societies such as Korea. However, this study is limited to observing the recent fertility dynamics of young women over time, since the latest cohort is limited to women born in 1970. This paper aims to provide patterns of fertility change over time by taking a period approach.
A study by Choe and Retherford (2009) estimates the education-specific period total fertility rate (TFR), which is based on parity progression ratios, by using the birth history reconstruction method. However, the results are only given in two educational categories (“high school or less” and “more than high school”), which makes it difficult to observe possible fertility differences by educational level at a more disaggregated level. Based on the 2% census sample of 2005, they observe that the differences in period TFR of low- and high-education groups remained small throughout the period of analysis (1995–2005).
Demographic Research: Volume 38, Article 13
multiple sources of data. In addition, the accuracy of these fertility estimates has not been validated to date, and these estimates are limited in scope in that they are only available for four recent census periods (2000, 2005, 2010, 2015).
In summary, Yoo (2014) and Choe and Retherford (2009) suggest that education-specific fertility differential gaps are diminishing. In contrast to these findings, a recent press release from Statistics Korea (2017a) reports a steep increase since 2005 in the fertility of women with the education level of middle school or less. These differences are possible due to the different sources of data and methodologies used in the respective studies.
This paper extends the ongoing endeavors of quantifying education-specific fertility differentials in Korea. My main goal is to verify whether fertility differentials by level of education have diminished in Korea.
2. Data
The 10% sample of Korea’s 2010 census is used in this study. While it is often necessary to pool multiple sources of data to estimate the education-specific period TFR, the 10% census sample is by far the largest single data set that contains the complete set of information needed to estimate the education-specific period TFR.
From the 10% census sample I created three separate data sets by educational level, each containing women (aged 15–49) with the respective level of education and all the potential candidate children (aged 0–14) to be matched by the own-children method. The matching procedure is explained in the methods section below. The three educational levels used in this study are low education (middle school or less), medium education (high school), and high education (university or higher). For this study’s analysis, the 10% census sample provides 683,257 and 1,111,179 individual records for children aged 0–14 and women aged 15–49 respectively.
In order to confirm the validity of the own-children method for the Korean context, I compare the own-children estimates from the 2% sample of Korea’s 2000 and 2005 censuses with the own-children estimates from the 2010 census (10%), as well as their vital statistics.
3. Method
own-children method is that, at a minimum, it only requires information on age, sex, and relation to the head of household to estimate the period TFR. Because of its simplicity, the method is recommended for countries lacking accurate civil registration and vital statistics. For this study, children aged 14 or younger are matched to mothers within the same households based on age, sex, relation to head of household, marital status, the total number of children ever born, and the number of surviving children. The accuracy of the matching process depends heavily on the quality of age and relation-to-head-of-household information available in the census. The number of surviving children is used to ensure that the number of children matched to a mother does not exceed the number of surviving children. The matching process provides the number of births by the mothers’ age and the number of mothers over the 15 years prior to the census. The age-specific fertility rates can then be calculated based on the number of the female population and the number of births for each year. Since the own-children method assumes own-children aged 14 or younger and their mothers are likely to live together in the same household, the fertility estimates are usually calculated for each of the 15 years prior to the census.
I use the fertility estimate software provided by the East–West Center (1992) to match the children to their mothers in each data set by level of education that I have created. The software provides an option to adjust for the mortality of children and mothers over the 15 years considered in this study. However, I use only the matching component of the software because the mortality data (life tables) for respective educational groups are not available, and in Korea the mortality level is very low for children aged 0–14 and women aged 15–49.
4. Results
Demographic Research: Volume 38, Article 13 1.00 1.10 1.20 1.30 1.40 1.50 1.60 1.70 1.80 1 9 8 6 1 9 8 7 1 9 8 8 1 9 8 9 1 9 9 0 1 9 9 1 1 9 9 2 1 9 9 3 1 9 9 4 1 9 9 5 1 9 9 6 1 9 9 7 1 9 9 8 1 9 9 9 2 0 0 0 2 0 0 1 2 0 0 2 2 0 0 3 2 0 0 4 2 0 0 5 2 0 0 6 2 0 0 7 2 0 0 8 2 0 0 9 2 0 1 0 T o ta l fe rt il it y ra te
Vital statistics Own-children 2010 (10% sample) Own-children 2000 (2% sample) Own-children 2005 (2% sample)
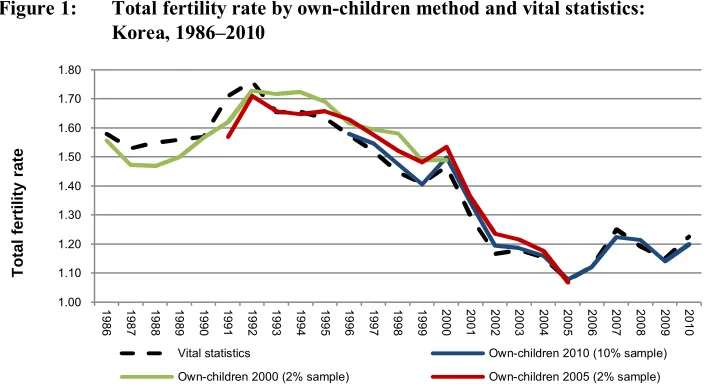
and vital statistics in Korea are of high quality. In particular, this finding suggests that the exceptional level of accuracy of the own-children estimates is due to the highly reliable “age” and “relationship to head” information in the census.
Figure 1: Total fertility rate by own-children method and vital statistics: Korea, 1986–2010
Note:TFR based on the own-children method is calculated by the author based on the 2000 (2%), 2005 (2%), and 2010 (10%) Korean census samples.
Source: 2000 (2%), 2005 (2%), and 2010 (10%) Korean census samples; vital statistics (Statistics Korea 2017b).
With the rising divorce rate in Korea, one of the main concerns regarding the use of the own-children method is whether it satisfies the assumption that children aged 14 or younger are living with their respective mothers in the same household. Despite this concern, the percentages of matched children for the 2000, 2005, and 2010 censuses are 97.5%, 97.3%, and 96.5% respectively. Such a high matching rate is puzzling at first, since the divorce rate is on the rise. In fact, the average divorce rate for wives of all ages in 2000, 2005, and 2010 was 36.54%, 38.56%, and 41.13% respectively (Statistics Korea 2017b). According to a study conducted by Lee and Kim (2011), 88% of children under age 12 were living with both parents, 9% with a single parent, and 3% without parents, based on the 2% sample of the 2005 census. It is also possible that a substantial proportion of couples decide to divorce either when they have no children or at a later age, thus not affecting the accuracy of the own-children method.
Figure 2 shows the education-specific period TFR obtained by using the own-children method. As shown in Figure 2, starting in the early 2000s there is a convergence in fertility between women with medium and high education. However, the period TFR for women with low education rises noticeably around 2005. To further investigate the possible cause of this sharp fertility rise, I look closely into the demographic details of this low-education group. I find a high proportion of young foreign-born women with low education, as evidenced in Figure 3. There is a heterogeneity among this low-education group that has not been observed in previous studies. Although the foreign-born women account for only 1.16% of all women aged 15–49, based on the 2010 census sample, their high concentration in this low-education group relative to their Korean counterparts has caused the fertility rise in this low-education group.
Figure 2: Period TFR by educational level for all women: Korea, 1996–2010
Note:Author’s calculations based on the 2010 Korean census sample (10%) by applying the own-children method.
In 1996, when the rapidly falling fertility level had been below the replacement level for twelve years, the Korean government abandoned its 1961 population control policy and adopted a new policy emphasizing population quality and social welfare (Hong 1998). However, it was not until 2005 that the Korean government recognized the seriousness of the low fertility rate and adopted a national policy to address the low fertility and aging problems in Korea.
0.80 0.90 1.00 1.10 1.20 1.30 1.40 1.50 1.60 1.70 1.80
1996 1997 1998 1999 2000 2001 2002 2003 2004 2005 2006 2007 2008 2009 2010
T
o
ta
l
fe
rt
il
it
y
ra
te
Year
Demographic Research: Volume 38, Article 13
0% 10% 20% 30% 40% 50% 60% 70% 80%
15-19 20-24 25-29 30-34 35-39 40-44 45-49
Age
Middle school or less High school University or higher
Figure 3: Percentage of foreign-born and native-born women by education and age: Korea, 2010
a) Foreign-born women b) Native-born Korean women
Note:Author’s own calculations based on 2010 Korean census sample (10%).
The number of international marriages started to increase gradually in the early 1990s, many years before 2005 when the national policy to combat low fertility was belatedly put in place (Figure 4). In the peak year of 2005, foreign-born women accounted for almost 10% of all marriages in Korea (Figure 4). One of the leading causes of this increase was the insufficient number of marriageable women for Korean men – mainly farmers living in rural areas who had been squeezed out of the marriage market (Lim 2010). In the 1960s, young women in rural areas began to leave their villages to seek a better life in the city, and this exacerbated the problem of farmers finding marriage partners. In the late 1980s, Korean men who were squeezed out of the marriage market began to seek foreign brides instead of native Korean women (Choi 2008), which led to a steady increase in the number of international marriages from the early 1990s. Based on the 10% sample of the 2010 census, women from China, including ethnic Korean Chinese (48.9%), Vietnam (21.2%), and the Philippines (7.9%) constituted 78% of all foreign-born women. In summary, their relatively higher fertility, reported in previous studies (Yoo 2017; Ryu 2015), and their high concentration at the low-education level are the main causes of the visible increase in the period TFR for women with low education.
0% 10% 20% 30% 40% 50% 60% 70% 80%
15-19 20-24 25-29 30-34 35-39 40-44 45-49
Age
0.0% 2.0% 4.0% 6.0% 8.0% 10.0% 12.0%
1993 1994 1995 1996 1997 1998 1999 2000 2001 2002 2003 2004 2005 2006 2007 2008 2009 2010
Year
Figure 4: Percentage of foreign-born women married to Korean men: Korea, 1993–2010
Note:Author’s own calculations based on vital statistics (Statistics Korea 2017b).
Demographic Research: Volume 38, Article 13
Figure 5: Period TFR by educational level for native-born Korean women only: Korea, 1996–2010
Note:Author’s calculations based on 2010 Korean census sample (10%) by applying the own-children method.
5. Conclusion
This paper reports heterogeneity in the demographic composition of women with low education in Korea, which has been overlooked by past studies. Yoo (2014) uses the cohort approach in his fertility estimation, with the cohort born in 1970 as his most recent cohort, and does not observe the sharp rise in young foreign-born women with low education, which is a period influence. This paper’s findings support the view (Kye 2012) that period effects are important in explaining fertility behaviors in Korea. However, period measures have their own limitations in that they are sensitive to tempo distortions (Bongaarts and Feeney 1998; Bongaarts and Sobotka 2012). Bongaarts and Sobotka (2012) argue that although the tempo-adjusted period fertility is not “intended
to predict completed fertility of a cohort” under a specific condition,2 it should
approximate cohort fertility in a long-term perspective. Ní Bhrolcháin (2011) also suggests that tempo-adjusted period fertility can serve as a proxy for cohort fertility. Will the tempo-adjusted period fertility narrow the gap between period and cohort
2 When the completed fertility of the cohort is constant for successive cohorts and the shape of the period
fertility schedule is constant (Bongaarts and Sobotka 2012). 0.80
0.90 1.00 1.10 1.20 1.30 1.40 1.50 1.60 1.70 1.80
1996 1997 1998 1999 2000 2001 2002 2003 2004 2005 2006 2007 2008 2009 2010
T
o
ta
l
fe
rt
il
it
y
ra
te
Year
fertility outcomes presented in this study? In future work it would be interesting to compare tempo-adjusted period fertility with cohort fertility by educational level, to see if the two fertility measures converge. In addition, Choe and Retherford (2009) use educational categories that are not sufficiently disaggregated to observe the heterogeneity present in this low-education group.
Demographic Research: Volume 38, Article 13
References
Bongaarts, J. (2003). Completing the fertility transition in the developing world: The
role of educational differences and fertility preferences. Population Studies
57(3): 321–335.doi:10.1080/0032472032000137835.
Bongaarts, J. and Feeney, G. (1998). On the quantum and tempo of fertility.Population and Development Review24(2): 271–291.doi:10.2307/2807974.
Bongaarts, J. and Sobotka, T. (2012). A demographic explanation for the recent rise in
European fertility. Population and Development Review 38(1): 83–120.
doi:10.1111/j.1728-4457.2012.00473.x.
Cho, L.J., Retherford, R.D., and Choe, M.K. (1986). The own-children method of
fertility estimation. Honolulu: East–West Center.
Choe, M.K. and Retherford, R.D. (2009). The contribution of education to South Korea’s fertility declines to below ‘lowest-low’ level. Asian Population Studies
5(3): 267–288.doi:10.1080/17441730903351503.
Choi, Y.S. (2008). Analyses of the socio-demographic characteristics in international
marriage of Koreans by census data. Journal of Korean Home Management
Association 26(5): 279–298.
East–West Center (1992). EASWESPOP: Fertility estimate programs user’s manual version 2.0 [electronic resource]. Honolulu: East–West Center. http://www.eastwestcenter.org/fileadmin/resources/research/PDFs/manual_fertili ty_estimate.pdf.
Hong, M.S. (1998). Change in the Korean fertility control policy and its effect.Korea Journal of Population Studies38(3): 182–227.
Kye, B. (2012). Cohort effects or period effects? Fertility decline in South Korea in the
twentieth century. Population Research and Policy Review 31: 1–29.
doi:10.1007/s11113-012-9232-y.
Lee, Y.J. and Kim, S.K. (2011). Socioeconomic characteristics of single-mother versus single-father households of children 12 or younger: Focusing on divorced parents.Korea Journal of Population Studies34(2): 17–43.
Ní Bhrolcháin, M. (2011). Tempo and the TFR. Demography 48(3): 841–861. doi:10.1007/s13524-011-0033-4.
Ryu, J.K. (2015). Fertility differentials between foreign wives and Korean wives: A
focus on total fertility rate and birth interval. Korea Journal of Population
Studies38(3): 49–73.
Statistics Korea (2017a). Analysis of birth, death, marriage and divorce by educational level: 2000–2015 [electronic resource]. Daejeon: Statistics Korea.http://kostat. go.kr/portal/korea/kor_nw/2/2/1/index.board.
Statistics Korea (2017b). Korea statistical information service [electronic resource]. Daejeon: Statistics Korea.http://kosis.kr.
Yoo, S.H. (2014). Educational differentials in cohort fertility during the fertility
transition in South Korea. Demographic Research 30(53): 1463–1494.
doi:10.4054/DemRes.2014.30.53.