doi:10.1251/bpo135 December 24, 2007
Micro-scale flow cytometry-based and biochemical
analysis of lipid signaling in primary B cell
subpopulations
Pierre Antony
1*,Kristen Hoek
1*, Bhaskarjyoti Sarmah
2and Wasif N. Khan
1#*These authors contributed equally.
1Department of Microbiology and Immunology and 2Department of Cell and Developmental Biology, Vanderbilt University School
of Medicine, Nashville, TN 37232-0146, USA.
#Corresponding Author: Wasif N. Khan, PhD., Department of Microbiology and Immunology, Vanderbilt University School of
Medicine, Nashville, Tennessee 37232-0146, USA. Phone: (615) 343 5632; Fax : (615) 343 7392; E-mail:
wasif.khan@vanderbilt.edu
Submitted: May 29, 2007; Revised: October 25, 2007; Accepted: December 9, 2007 Indexing terms: receptors, antigen, b-cell; immunomagnetic separation
Abbreviations: BCR, B cell antigen receptor; DAG, diacylglycerol; DMEM, Dulbecco’s modified Eagle's media; IP3, inositol
triphosphate; FCM, flow cytometry; MACS, magnetic bead cell sorting; MFI, mean fluorescence intensity; PKC, protein kinase C; RBC, red blood cell
ABSTRACT
B cell subpopulations in the spleen have been extensively characterized phenotypically; however, biochemical properties of these cell populations following B cell antigen receptor engagement have not been fully determined due to technical difficulties and limiting cell numbers. We therefore employed mini-scale protocols to assess lipid signaling, particularly that of diacylglycerol and inositol trisphosphate, with as few as 0.5x10⁶ purified early (T1) and late (T2) transitional B cells. Additionally, utilizing flow
cytometric techniques, we determined levels of phosphatidylinositol bisphosphate and calcium mobilization in T1 and T2 cells, as well as mature follicular and marginal zone B cells using less than 1x10⁶ primary B cells. Thus, these biochemical and flow
cytometric methodologies can be used to analyse signal-induced changes in phosphatidylinositol bisphosphate levels, diacylglycerol and inositol triphosphate production and calcium in each B cell population.
INTRODUCTION
The B cell compartment within the mouse spleen is comprised of at least five subpopulations, including immature transitional type 1 (T1), transitional type 2 (T2) and T2-preMZ, as well as mature Follicular (Fo) and marginal zone (MZ) B cells (1-4). Signaling throughthe B cell antigen receptor (BCR) is required for the generation of a functional mature B cell repertoire (3, 5), and multiple components of the BCR signalosome regulate biochemical events after BCR engagement. Upon activation by Btk, PLC-γ2 catalyzes the hydrolysis of phosphatidylinositol bisphosphate (PtdInsP2 or PIP2) into the two second messengers,
inositol trisphosphate (IP3), which activates Ca2+ signaling, and
diacylglycerol (DAG), which activates protein kinase C (PKC) signaling pathways (6, 7). It is well established that both calcium and PKC signaling are important in B cell survival and development/maturation, as well as proliferation (8, 9). Thus, quantities of PIP2, DAG and IP3 are likely to direct the
subsequent signaling events leading to the fate of developing B cells. Developing new protocols to study lipid signaling is
therefore a prerequisite for understanding the molecular mechanisms underlying the generation of mature B cells.
Because only a small number of each B cell subpopulation can be obtained by flow cytometry-based cell sorting methods, we developed and optimized mini-scale DAG and IP3 quantification
protocols in order to analyze the levels of DAG and IP3 within
transitional B cell subsets following BCR cross-linking. These protocols allowed the quantification of lipid species utilizing as few as 0.5-5x10⁶ purified B cells. Additionally, utilizing flow
cytometry (FCM) techniques to identify B cell populations, we analyzed PIP2 levels and calcium mobilization in transitional and
mature B cell subsets, again using as few as 1x10⁶ total B cells. Here we report the detailed experimental procedure of micro-scale flow cytometry and biochemical analysis of lipid signaling in primary B cells.
MATERIALS AND METHODS
Mice and B cell purification
Wild type C57BL/6 mice (Jackson Laboratories, Maine, USA) were used. All mice that were used as the source of splenocytes were treated humanely in accordance with federal and state government guidelines and their use was approved by the institutional animal committee.
Primary B lymphocytes were isolated from single cell suspensions pooled from the spleens of C57BL/6 mice. Cell suspensions were depleted of RBCs, and B lymphocytes were purified through magnetic sorting on an AutoMACS automated cell sorter (Miltenyi Biotech) by negative selection (CD43-depletion) to avoid B cell activation. The purity of B cells isolated in this manner was approximately 90–95% as verified by FCM analysis using anti-B220 and anti-IgM antibodies (Pharmingen, USA). FACS-sorting for highly purified transitional B cell subsets was performed as previously described (2).
Lipid analysis
PIP2 quantitation: PIP2 levels following anti-IgM stimulation
were monitored by flow cytometry. MACS-enriched B cells were resuspended (10x106 cells/ml) in complete RPMI-1640,
rested on ice for 1.5 hours, and incubated for 15 minutes at 37°C prior to assay. Cells were then stimulated with 20 μg/ml goat anti-mouse IgM F(ab’)2 antibodies (Jackson ImmunoResearch)
for the indicated times, and immediately fixed (in order to preserve PIP2 phosphorylation status) by harvesting 100 μl
(containing 1x10⁶ cells) into 1 ml cold PBS + 2%
paraformaldehyde at each time-point. Cells were permeabilized utilizing the Cytofix/Cytoperm kit (BD Biosciences) according to the manufacturer’s instructions, and intracellularly labeled with a biotinylated antibody raised against PI(4,5)P2 (Z-B045;
Echelon Biosciences, Inc; 1:500 dilution) for 20 minutes on ice. Cells were then washed and labeled with APC-conjugated anti-CD19 (clone 1D3; 1:100 dilution), FITC-conjugated anti-HSA (clone M1/69; 1:500 dilution), and PE-conjugated anti-CD21 (clone 7G6, 1:400 dilution) for the identification of splenic B cell subsets, and PerCP-Cy5.5-conjugated streptavidin (1:300 dilution) to visualize PIP2. Anti-C1qRp (AA4.1) and anti-CD23
antibodies were not utilized due to non-reactivity with B cells that have undergone fixation. Following a 20 minute incubation on ice, cells were washed, and resuspended in 100 μl FACS buffer (2% FBS in PBS), followed by 100 μl fix buffer (2% paraformaldehyde in FACS buffer) to preserve the cells. To test the specificity of the anti-PIP2 antibody, freshly isolated MACS
enriched B cells were fixed and permeabilized as described above, then intracellularly labeled with an anti-PIP2-FITC
antibody (Z-G045; Echelon Biosciences, Inc; 1:300 dilution) that had been pre-incubated with varying concentrations of PIP2
liposomes (Y-P045 (biotinylated); Echelon Biosciences, Inc) for 15 minutes on ice. Data was acquired on a BD FACSCalibur or
BD LSRII flow cytometer. Results are expressed as MFI and are representative of multiple experiments.
DAG quantification: Purified B cells were labeled with [3H]palmitic acid (2.5 mCi/ml), as a fatty acid precursor.
Labeled B cells were washed twice with PBS, incubated for various time periods or stimulated through the BCR with goat anti-mouse IgM F(ab')2 as indicated. The reactions were stopped
by the addition of excess cold PBS. The cells were pelleted by centrifugation and used for lipid extraction. The pellet was suspended in 2 ml chloroform-methanol (2:1 v/v) and 0.4 ml of 0.5 N HCl was added. The mixture was shaken vigorously, centrifuged, and the upper (aqueous) phase was discarded while the lower (organic) washed twice with theoretical upper phase (10). The radioactivity of lipids was determined on an aliquot fraction by scintillation counting. Dipalmitin carrier standard was then added, the lipid phase evaporated gently under a N2
stream and the residue dissolved in a minimum volume of chloroform-methanol (2:1 v/v). DAG was separated by thin layer chromatography on silica gel G plates using a double development system and detected under UV light after spraying the plates with primulin as previously described (11). The area containing DAG was scraped and the radioactivity determined as previously described (6, 11, 12).
[3H]-Inositol labeled soluble inositol polyphosphate (IP)
profiling: The soluble IP profile for B cells was determined by adapting a previously described protocol (13). Briefly, MACS-enriched total B cells or FACS-purified B cell subsets (10x106/ml) were cultured in inositol-free DMEM containing 60
mCi [3H]Inositol/ml (Perkin Elmer) for 4 hours. Cells were
harvested, washed twice with 1 ml PBS and suspended in PBS (10x106/ml). 100 μl cell aliquots (containing 1x10⁶ cells) were
treated with 25 μl PBS with or without 20 μg/ml goat anti-mouse IgM F(ab’)2. Treatments were stopped by adding 6.6 μl
10 N HCl and chilling cells on ice. Soluble IPs were extracted by adding 465 μl of chloroform/methanol (1:2 v/v). The mixture was vortexed for 2 minutes at maximum speed, followed by addition of 156 μl each of chloroform and 2 M KCl and another 2 minutes of vortexing. The lysate was spun at 13,000 g for 5 minutes and the supernatant recovered. Samples were analyzed by the HPLC (Shimadzu Corporation) connected to the Radio-HPLC Detector (IN/US Systems, Inc.). The IPs were resolved by a Whatman partisphere SAX strong-anion exchange column (4.6 x 125 mm) and a linear gradient from 10 mM to 1.7 M ammonium phosphate (pH 3.5) for 25 minutes, followed by elution with 1.7 M ammonium phosphate for 20 minutes.
Calcium mobilization in B cell subsets:MACS-enriched B cells were resuspended (10x106 cells/ml) in warm HBSS w/o phenol
red, and loaded with indo-1-AM (5 μg/ml) for 30 minutes at 37°C. Cells were then washed, resuspended (20x106 cells/ml) in
CD19, and/or CD21 were not used in order to avoid inadvertent stimulation of B cells. Following labeling, cells were washed, resuspended (1x10⁶/ml) in HBSS containing 1 mM calcium, and
kept on ice until assay. Prior to acquisition, cells were warmed for 15 minutes in a 37°C water bath, and applied to a BD LSR II cytometer. Baseline, non-stimulated measurements were taken for 90 seconds, followed by the addition of 10 μg/ml goat anti-mouse IgM F(ab’)2 antibodies for the indicated time. Ionomycin
(1 mM) was used as a positive control to ensure that cells were competent to release calcium from intracellular stores. Data is expressed as a ratio of Indo1-violet/Indo1-blue, and is a representative of multiple experiments.
Statistics
The data represent the mean of at least three experiments analyzed utilizing Student's t-test.
RESULTS
PIP2 hydrolysis occurs in all B cell subsets as determined by FCM
Because PIP2 serves as a substrate for PLC-γ2 in the production
of DAG (14), we wanted to determine basal and BCR-induced levels of PIP2 in all B cell subsets. MACS-enriched splenic B
cells were stimulated, harvested, and immediately fixed in 2% paraformaldehyde in order to preserve the phosphorylation status of PIP2. Cells were then stained intracellular for PIP2 and
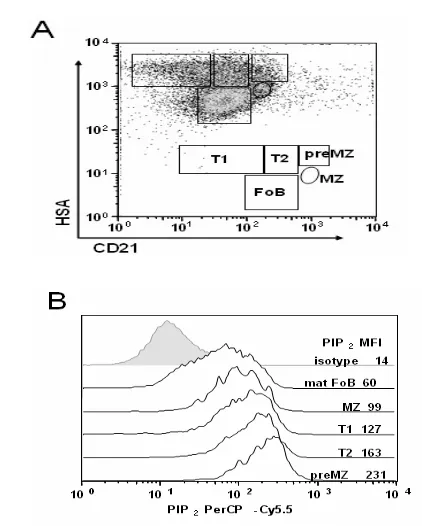
extracellular with a combination of anti-HSA, anti-CD21, and anti-CD19 antibodies for B cell subset identification. Utilizing flow cytometric analysis, CD19+ cells were displayed with HSA
and CD21 in order avoid inclusion of any remaining non-B cells in the analysis (Fig. 1A). CD21hi MZ and pre-MZ were
separated based on differential HSA expression, which corresponded to CD23 expression (preMZ are HSAhiCD23+, MZ
are HSAmidCD23lo), as we previously reported (2). Basal PIP 2
levels were then measured in each subset (Fig. 1B). In addition, we determined the kinetics of BCR-induced PIP2 production in
each B cell subpopulation following stimulation with 20 μg/ml anti-IgM F(ab’)2 antibodies. In all splenic B cell subsets, PIP2
levels were reduced immediately in response to stimulation with anti-IgM, indicative of PIP2 hydrolysis (Fig. 1C).
Optimal lipid labeling with [3H]palmitic acid is achieved
in 6 hours
To analyze the lipid synthesis and BCR-directed DAG production in wild type primary B cells, we systematically assessed the numbers of primary B cells and the amount of radioactivity required for optimum labeling. MACS-enriched total splenic B cells or FACS-sorted B cell subsets were used immediately for labeling with [3H]palmitic acid, a saturated fatty
acid (6). Pilot experiments indicate that optimal lipid synthesis is achieved with a concentration of 2.5 mCi/ml (data not shown). Using this information, we discovered that the incorporation of radioactivity was detectable after 30 min, increased in a time-dependent manner reaching a plateau at 6 h, and remained unchanged through 24 h ( Fig. 2A). The same profile was obtained when the results were expressed as cpm/mg protein indicating a dynamic process (data not shown).
BCR-induced DAG production is dose-dependent and can be detected with as few as 0.5x10⁶ B cells
MACS-enriched total B cells were labeled for 6 h with [3H]palmitic acid, then were stimulated for 5 minutes with
various concentration of anti-IgM antibodies in order to determine the production of DAG (12). DAG production increases in a dose dependent manner and is optimal at 20 μg/ml of anti-IgM (Fab’)2 (Fig. 2B).
To test the feasibility of DAG quantification experiments with small numbers of primary B cells, we labeled MACS-enriched total B cells for 6 h with [3H]palmitic acid, and determined its
incorporation into whole lipids in various numbers of B cells. We observed a strong correlation between the total radioactivity detected in whole lipids with the number of B cells labeled (r = 0.998). It is noteworthy that the radioactivity was close to 50000 and 100000 cpm for 0.5x10⁶ and 1x10⁶ labeled cells respectively
(Fig. 2C). Since the level of DAG represents 0.6% of total lipids Antony et al. – Micro-scale flow cytometry-based and biochemical analysis of lipid signaling in primary B cell subpopulations
Fig. 1A & 1B: PIP2 is hydrolyzed in all B cell subsets
extracted from the mouse primary splenic B cells (2), the amount of [3H]DAG in 0.5x10⁶ B cells should be close to 500
cpm which is more than 100 times greater than the background, and should therefore allow reliable estimation of DAG production.
We next determined the level of BCR-induced DAG production after 5 minutes of stimulation with anti-IgM (20 μg/ml) using various numbers of MACS-enriched total B cells ranging from 0.5x10⁶ to 5x10⁶. The results show that upon BCR ligation the
profile of DAG production obtained from a small number (0.5x10⁶) of primary B cells coincides precisely with that
obtained from a large number (5x10⁶) of B cells (Fig. 2D).
When 0.5x10⁶ B cells were labeled with [3H]palmitic acid, the
radioactivity detected in DAG was similar to that calculated from the standard curve (450 cpm corresponds to 0.5% of total lipids). Therefore, lipid signaling in transitional B cell subsets may be investigated using [3H]palmitic acid as the radioactive
labeling precursor. In this regard, we previously demonstrated that BCR-mediated DAG production occurs in T2 and mature B cells followingboth 5 min (2.1- ± 0.1-fold increase, and 5.1- ± 0.3-fold increase, respectively, compared with the non-stimulated control) and 30 min (2.8- ± 0.3-fold increase, and 4.8-± 0.4-fold increase, respectively, compared with the non-stimulated control) stimulation with anti-IgM (2). In contrast, T1 B cells did not produce DAG in response to anti-IgM stimulation (2).
HPLC analysis of BCR-induced IP3 production in splenic B
cell subsets
Because we observed significant differences in BCR-mediated DAG production in transitional B cell subsets, we also investigated the production of IP3 in response to BCR
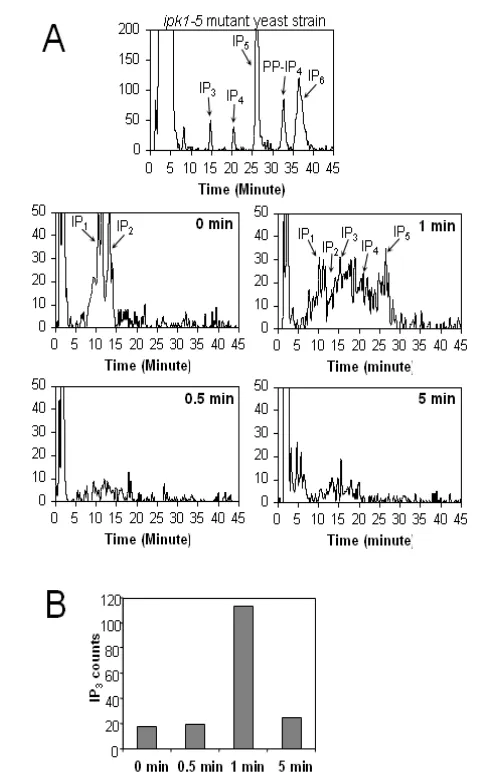
stimulation utilizing HPLC. Using MACS-enriched total B cells, we first performed a kinetics study and determined that 1 minute of anti-IgM stimulation was the optimum time-point for IP3 detection (Figure 3A and B). We then utilized 1x10⁶ FACS-purified transitional T1 and T2 B cells to investigate IP3 production following anti-IgM stimulation. T2 B cells produced significantly more IP3 than T1 B cells (1.52 ± 0.5-fold increase and 3.09 ± 0.2-fold increase, respectively; n = 3) (Figure 3 C-E), consistent with the previously observed DAG production profile (2).
FCM analysis of intracellular Ca2+ mobilization in B cell
subsets
Because the generation of IP3 subsequently induces Ca2+
mobilization in primary wt B cells (15), we next wanted to investigate calcium mobilization in B cell subsets. To precisely define stage-specific calcium mobilization within B cell subsets, we utilized FCM techniques. 1x10⁶ MACS-enriched B cells
were loaded with indo-1-AM and labeled with a combination of anti-C1qRp (AA4.1), anti-HSA and anti-CD23 antibodies for B cell subset identification (Fig. 4A). Antibodies directed against B220, CD19, and CD21 were not used in order to avoid inadvertent B cell activation. Cells were applied to the cytometer, baseline measurements taken for 60-90 seconds, then stimulated with anti-IgM for the indicated times. From the AA4+
gate, T1 (HSAhiCD23-) and T2 (HSAhiCD23+) cells were gated
for calcium analysis. The vast majority of T2-preMZ cells do not express AA4.1; therefore they are excluded from T2 cells gated in this manner. From the AA4- gate, mature FoB (HSAloCD23+) and MZ (HSAmidCD23lo) were gated for calcium
analysis. Our results demonstrate that calcium mobilization can be monitored in all B cell subsets following anti-IgM stimulation, using as few as 1x10⁶ MACS-enriched,
FACS-stained total B cells (Fig. 4B).
DISCUSSION
The goal of this study was to develop protocols to assess
Fig. 1C & 1D: PIP2 is hydrolyzed in all B cell subsets
following anti-IgM stimulation.(C): B cells were stimulated for the indicated times with 20 μg/ml anti-IgM, immediately fixed and permeabilized, then labeled and examined for PIP2 levels as in (B); T1 (filled diamonds), T2 (filled squares), mature FoB (open circles), preMZ (filled triangles), mature MZB (open triangles). Data is displayed as the average MFI of duplicate samples, and is a representative of at least 4 experiments. (D):
dynamic changes in lipid signaling in each B cell subset following antigenic stimulation. By utilizing FCM techniques to assess both PIP2 levels and calcium mobilization in individual B
cell subsets, we eliminated the necessity for purification of B cell subsets in these analyses. Additionally, we defined optimal conditions to rapidly analyze DAG and IP3 production utilizing
numbers of total primary B cells similar to the quantities of transitional B cells that can be obtained by magnetic bead and FCM based cell sorting protocols (2, 16).
In this report we used a combination of the most current staining schemes to identify B cell subpopulations in the spleen by FCM (1-4, 16, 17). We have combined extracellular staining for B cell subset identification with intracellular staining protocols in order to determine PIP2 levels in all B cell subsets following
stimulation with anti-IgM (Fig. 1). It is important to note that following an initial period of BCR-induced PIP2 hydrolysis,
BCR-induced PIP2 production occurs in all the B cell
subpopulations (Fig. 1C). This increase in PIP2 over time may
result from DAG conversion into PIP2 or PIP2 synthesis by
PIP5K following BCR stimulation (18, 19). Thus, a PIP2 cycle is
activated in B cells in response to BCR cross-linking. The lower production of DAG and IP3 in T1 B cells suggests
developmental stage-specific mechanisms of PIP2 cycling in
splenic B cell subpopulations. Additionally, it is noteworthy that the B cell subset with the lowest baseline (mature FoB) had the greatest changes in PIP2 MFI while the B cell subsets with the
highest baselines (T2 and preMZ) had the smallest changes in PIP2 MFI (Fig. 1C), indicating that the inducible production of
PIP2 through BCR stimulation is tightly associated with its basal
level. As we have previously shown for PKC phosphorylation (2), this protocol can be extended to study other intracellular biochemical signaling events following antigenic stimulation.
In addition, we have employed FCM techniques in order to assess calcium mobilization in B cell subsets. Again, employing a unique combination of antibodies, which identify B cell subsets but will not activate cells inadvertently, we monitored calcium mobilization in each B cell subset following antigenic stimulation using as few as 1x10⁶ MACS-enriched B cells and
found that all B cell subsets mobilize calcium following anti-IgM stimulation (Fig. 4). These FCM-based techniques use only minimal numbers of primary B cells, and eliminate the need for FACS-based cell sorting of individual B cell populations.
We also report that 3[H]palmitic acid can be used to efficiently
label lipids in primary splenic B cells. We observed that peak radioactivity is reached after 6 h of labeling (Fig. 2A). Since splenic B cells die rapidly in vitro in the absence of B cell growth factors and/or agonists, the relatively short duration of labeling (6 h) with 3[H]palmitic acid minimizes the loss of B
cells (16, 17). Our results also show that lipid levels can be determined with small numbers of B cells, and that the radioactivity incorporated into lipids in 0.5x10⁶ B cells is close
to 5x10⁴ cpm (8000 times higher than the background) which
should allow easy quantification of lipid species (Fig. 2C). These data are in agreement with studies performed with primary B cells labeled with [3H]arachidonic acid (15), both in
Antony et al. – Micro-scale flow cytometry-based and biochemical analysis of lipid signaling in primary B cell subpopulations
Fig. 2: Lipid synthesis and DAG production in small numbers of primary B cells.(A): Kinetics of lipid synthesis in primary B cells. Incorporation of [3H]palmitic acid (2.5 mCi/ml) into lipids was determined in purified wt primary B cells. Lipid extraction was performed according the protocol of Folch (10). Lipid synthesis is expressed in cpm and represents the average + SEM of three independent performed in triplicate. (B): BCR-induced DAG production is dose dependent. 5x10⁶ purified B cells were labeled for 6h with [3H]palmitic acid (2.5 mCi/ml) and stimulated for 5 min with various doses of anti-IgM. Lipids were extracted and separated as described (12) and DAG was quantified. DAG is expressed as percentage increase of DAG of total radioactivity and represents the average + SEM of three independent performed in triplicate. *P<0.05; ***P<0.001. (C):
the profile of DAG accumulation and the quantity of radioactivity.
An alternate enzymatic method for the quantification of DAG employed an Escherichia coli DAG kinase which catalyzes the production of [32P]phosphatidic acid from DAG substrate (20).
This radiosensitive assay was successfully developed for sn-1,2 diacylglycerols quantification. Moreover, the DAG kinase assay was already applied to Epstein-Barr virus negative Burkitt's lymphoma Ramos cells to quantify ceramide (21). Here, our lipid separation method allows the separation of sn-1,2
diacylglycerol from sn-1,3 diacylglycerol species, and the DAG level reflects that of both isomers (12). In addition, we were able to quantify other neutral lipid species (palmitic acid, mLtriglycerides, and monoglycerides) in one single experiment (data not shown).
Development of immunocompetent B-lymphocytes is critically dependent on signaling through the BCR (5). Our results show that while 20 μg/ml of anti-IgM (Fab’)2 antibodies induces
maximal production of DAG, lower doses also lead to significant production of DAG (Fig. 2B).
We also demonstrate that in response to BCR cross-linking, an increase in DAG production is clearly detectable with as few as 0.5x10⁶ B cells (Fig. 2D). We have previously employed the
methods described in this report to determine DAG production
Fig. 3A & 3B: Generation of IP3 in primary B cells: A)
Timecourse of IP3 production in primary B cells. 3x10⁶ MACS-enriched B cells were labeled with 3[H]inositol (60 mCi/ml) for 4 h, then incubated with PBS (non-stimulated) or stimulated with 20 μg/ml anti-IgM for the indicated times. Production of soluble IP species was measured by HPLC and the position corresponding to each species is indicated. IP3 production was measured as the total counts detected within the 14.25-15.25 minute time window. HPLC profile of an ipk1-5 mutant yeast strain (26) serves as reference. (B): IP3 production from the B cells in (A) is expressed as the counts in the position corresponding to IP3.
following anti-IgM stimulation in 1x10⁶ FACS-purified T1, T2
and mature FoB cells (2). In that study, we reported that T2 and FoB cells rapidly produce detectible levels of DAG following anti-IgM stimulation and that increased DAG levels are maintained for a significant period of time, while T1 B cells do not produce DAG at any time-point following anti-IgM stimulation (2).
After we observed that DAG was differentially produced in transitional B cells subsets, we wanted to confirm that IP3
production followed a similar pattern, as these two lipids are both by-products of PIP2 hydrolysis. Consistent with DAG
production, IP3 was detected by HPLC in total B cells and in
purified T2 B cells, but not in purified T1 B cells (Fig. 3 A and C). In addition to IP3, we found that levels of other IPs (i.e., IP1,
IP2, IP4, and IP5) also change in all B cell populations, however,
these changes are most apparent in total B cells (Fig. 3A). This observation may reflect more robust changes in mature follicular B cells, which is the predominant population
(approximately 60-70%) in splenic B cells. Thus, the magnitude of BCR-induced IP3 production is likely to be underestimated
because IP3 can undergo additional phosphorylations by kinases
to generate IP4, IP5 IP6. These findings also raise the possibility
that other IPs may also play distinct roles in modulating B cell physiology. Indeed, a previous report showed that the PH domain of Btk functions as an inositol 1,3,4,5-tetrakisphosphate (IP4), inositol 1,3,4,5,6-pentakisphosphate (IP5), and inositol
1,2,3,4,5,6-hexakisphosphate (IP6) binding domain and that xid
mutations (R28C) found in the Pleckstrin Homology domain result in a dramatic reduction of IP4 binding activity (22).
Consistent with these results, BCR-induced DAG/IP3 production
is Btk dependent, suggesting that B cell differentiation is likely to be correlated with the IP4 binding capacity of the PH domain
of Btk (2, 22, 23). Additionally, a recent report revealed that inositol 1,4,5-triphosphate 3-kinase and its reaction product IP4
are both required to mediate survival signalling in B cells via a Ras-ERK signalling pathway that controls the expression of the proapoptotic protein, Bim (24).
Together, these results demonstrate our ability to perform experiments to determine BCR-dependent lipid signaling utilizing the small numbers of B cells that are obtained with any of the B cell subpopulation purification protocols we have previously published (2, 16). Additionally, while these protocols were established in cells that were stimulated through the BCR, it is reasonable to believe that these protocols will be useful when monitoring B cell activation by many different cellular stimuli; in fact, we have already utilized these protocols to monitor DAG and IP3 production, as well as calcium
mobilization, in B cells stimulated with BAFF (25). Thus, the protocols that we describe in this report should allow a comprehensive determination of differential lipid signaling and signal transduction in primary B cell populations in response to various stimuli.
ACKNOWLEDGMENTS
This study was supported in part by the NIH grant R01 AI060729 (to W.N.K.). The authors wish to thank John Lowe and Joan M. Llanes for technical assistance, and Jim Higginbotham and Michele Nadef of the VUMC Flow Cytometry Core for assistance with Calcium experiments.
REFERENCES
1. Allman D, Lindsley RC, DeMuth W, Rudd K, Shinton SA, Hardy RR. Resolution of three nonproliferative immature splenic B cell subsets reveals multiple selection points during peripheral B cell maturation. J Immunol 2001;167(12):6834-40.
2. Hoek KL, Antony P, Lowe J, Shinners N, Sarmah B, Wente SR, et al. Transitional B cell fate is associated with developmental stage-specific regulation of diacylglycerol and calcium signaling upon B cell receptor engagement. J Immunol 2006;177(8):5405-13.
3. Loder F, Mutschler B, Ray RJ, Paige CJ, Sideras P, Torres R, Antony et al. – Micro-scale flow cytometry-based and biochemical analysis of lipid signaling in primary B cell subpopulations
Fig. 4: Calcium mobilization in B cell subsets. (A):
et al. B cell development in the spleen takes place in discrete steps and is determined by the quality of B cell receptor-derived signals. J Exp Med 1999;190(1):75-89.
4. Srivastava B, Quinn WJ, 3rd, Hazard K, Erikson J, Allman D. Characterization of marginal zone B cell precursors. J Exp Med 2005;202(9):1225-34.
5. Su TT, Guo B, Wei B, Braun J, Rawlings DJ. Signaling in transitional type 2 B cells is critical for peripheral B-cell development. Immunol Rev 2004;197:161-78.
6. Antony P, Petro JB, Carlesso G, Shinners NP, Lowe J, Khan WN. B cell receptor directs the activation of NFAT and NF-kappaB via distinct molecular mechanisms. Exp Cell Res 2003;291(1):11-24.
7. Coggeshall KM, Cambier JC. B cell activation. VIII. Membrane immunoglobulins transduce signals via activation of phosphatidylinositol hydrolysis. J Immunol 1984;133(6): 3382-6.
8. Hikida M, Johmura S, Hashimoto A, Takezaki M, Kurosaki T. Coupling between B cell receptor and phospholipase C-gamma2 is essential for mature B cell development. J Exp Med 2003;198(4):581-9.
9. Wen R, Chen Y, Xue L, Schuman J, Yang S, Morris SW, et al. Phospholipase Cgamma2 provides survival signals via Bcl2 and A1 in different subpopulations of B cells. J Biol Chem 2003;278(44):43654-62.
10. Folch J, Lees M, Sloane Stanley GH. A simple method for the isolation and purification of total lipides from animal tissues. J Biol Chem 1957;226(1):497-509.
11. Antony P, Farooqui AA, Horrocks LA, Freysz L. Effect of D609 on phosphatidylcholine metabolism in the nuclei of LA-N-1 neuroblastoma cells: a key role for diacylglycerol. FEBS Lett 2001;509(1):115-8.
12. Antony P, Petro JB, Carlesso G, Shinners NP, Lowe J, Khan WN. B-cell antigen receptor activates transcription factors NFAT (nuclear factor of activated T-cells) and NF-kappaB (nuclear factor kappaB) via a mechanism that involves diacylglycerol. Biochem Soc Trans 2004;32(Pt 1):113-5. 13. York JD, Odom AR, Murphy R, Ives EB, Wente SR. A
phospholipase C-dependent inositol polyphosphate kinase pathway required for efficient messenger RNA export. Science 1999;285(5424):96-100.
14. Chien MM, Cambier JC. Divalent cation regulation of phosphoinositide metabolism. Naturally occurring B
lymphoblasts contain a Mg2(+)-regulated
phosphatidylinositol-specific phospholipase C. J Biol Chem 1990;265(16):9201-7.
15. Bijsterbosch MK, Meade CJ, Turner GA, Klaus GG. B lymphocyte receptors and polyphosphoinositide degradation. Cell 1985;41(3):999-1006.
16. Petro JB, Gerstein RM, Lowe J, Carter RS, Shinners N, Khan WN. Transitional type 1 and 2 B lymphocyte subsets are differentially responsive to antigen receptor signaling. J Biol Chem 2002;277(50):48009-19.
17. Su TT, Rawlings DJ. Transitional B lymphocyte subsets operate as distinct checkpoints in murine splenic B cell development. J Immunol 2002;168(5):2101-10.
18. Saito K, Tolias KF, Saci A, Koon HB, Humphries LA, Scharenberg A, et al. BTK regulates PtdIns-4,5-P2 synthesis:
importance for calcium signaling and PI3K activity. Immunity 2003;19(5):669-78.
19. Toker A. The synthesis and cellular roles of phosphatidylinositol 4,5-bisphosphate. Curr Opin Cell Biol 1998;10(2):254-61.
20. Preiss J, Loomis CR, Bishop WR, Stein R, Niedel JE, Bell RM. Quantitative measurement of sn-1,2-diacylglycerols present in platelets, hepatocytes, and ras- and sis-transformed normal rat kidney cells. J Biol Chem 1986;261(19):8597-600.
21. Kroesen BJ, Pettus B, Luberto C, Busman M, Sietsma H, de Leij L, et al. Induction of apoptosis through B-cell receptor cross-linking occurs via de novo generated C16-ceramide and involves mitochondria. J Biol Chem 2001;276(17): 13606-14.
22. Fukuda M, Kojima T, Kabayama H, Mikoshiba K. Mutation of the pleckstrin homology domain of Bruton's tyrosine kinase in immunodeficiency impaired inositol 1,3,4,5-tetrakisphosphate binding capacity. J Biol Chem 1996;271(48):30303-6.
23. Khan WN, Alt FW, Gerstein RM, Malynn BA, Larsson I, Rathbun G, et al. Defective B cell development and function in Btk-deficient mice. Immunity 1995;3(3):283-99.
24. Marechal Y, Pesesse X, Jia Y, Pouillon V, Perez-Morga D, Daniel J, et al. Inositol 1,3,4,5-tetrakisphosphate controls proapoptotic Bim gene expression and survival in B cells. Proc Natl Acad Sci U S A 2007;104(35):13978-13983. 25. Shinners NP, Carlesso G, Castro I, Hoek KL, Corn RA,
Woodland RL, et al. Bruton's Tyrosine Kinase Mediates NF-{kappa}B Activation and B Cell Survival by B Cell-Activating Factor Receptor of the TNF-R Family. J Immunol 2007;179(6):3872-80.
PROTOCOLS
B cell purification by negative selection
Materials:
FACS buffer (PBS + 2% FBS)
MACS buffer (PBS + 0.5% BSA and 1mM EDTA)
Complete RPMI (RPMI + 10% FBS, 4mM L-glut, 100U P/S, 0.1% 2-ME, 10mM HEPES) * anti-mouse CD43 magnetic beads (130-049-801 Miltenyi Biotech)
* AutoMACS automated cell sorter or MiniMACS columns (Miltenyi Biotech) ** B-cell enrichment kit (557792 BD Biosciences) and manual IMAG magnet
1) Harvest the spleen from a wt C57BL/6 mouse.
2) Isolate splenocytes by smashing spleen in a 70 mM cell strainer with 5ml PBS. Transfer cells to a 15ml conical tube and rinse strainer 2X with 5ml PBS. Transfer washes to the tube with cells and centrifuge for 6 minutes at 1600 rpm at 4°C. 3) Aspirate supernatant and lyse RBC, while vortexing, by the addition of 900 μL sterile filtered ddH20 followed
immediately by the addition of 100 μL 10x PBS. Remove floating fat, and add FACS buffer to 10 ml. 4) Count cells.
5) Centrifuge cells for 6 minutes at 1600 rpm at 4°C. Resuspend cells at 100x106/ml in MACS buffer.
6) *Add anti-CD43 beads and incubate according to the manufacturers instructions.
7) *Sort cells on the AutoMACS using the DelpeteS cycle or on the MiniMACS magnetic columns according to the manufacturers directions.
8) Resuspend CD43-negative cells in 1-2 ml of complete RPMI and count cells. 9) Stain a small aliquot for purity with anti-B220 or anti-CD19, and analyze by FCM.
** 6-7) Alternatively, B cells can be enriched using the B cell enrichment kit and manual magnet from BD according to the manufaturers instructions.
PIP2 quantitation by FCM
Materials:
Stop buffer (PBS + 2% paraformaldehyde) BD Cytofix/Cytoperm kit
Fix buffer (FACS + 2% paraformaldehyde)
*Biotinylated anti-PIP2 antibody (Z-B045; Echelon Biosciences)
Anti-HSA-FITC antibody (BD clone M1/69) Anti-CD21-PE antibody (BD clone 7G6) *SAv-PerCP-Cy5.5 (BD 551419)
Anti-CD19-APC antibody (BD clone 1D3) *anti-PIP2-FITC (Z-G045; Echelon Biosciences)
1) Resuspend MACS-enriched B cells in RPMI (10x106/ml) and rest on ice for 1hr.
2) Warm cells in a 37°C water bath for 15 minutes
3) Prepare “Stop” tubes (1ml stop buffer) for each time point
4) Harvest Time 0 sample by collecting 100 μl (1x10⁶ cells) into the appropriate stop tube (harvest an extra sample if staining
with an isotype control)
5) Stimulate cells for desired time with anti-IgM F(ab’)2
6) Harvest cells by collecting 100 μl at each desired time point into appropriate stop tubes 7) Centrifuge 1700 rpm for 4 minutes
8) Fix/permeabilize using BD Cytofix/cytoperm kit according to manufacturer’s instructions
9) *Intracellular stain with anti-PIP2-biotin (1:500) in 100 μl perm-wash buffer/1x106 cells for 20 minutes. Wash with 1ml
perm-wash, and spin at 1700 rpm for 4 minutes.
10) *Stain intracellular with SAv-PerCP-Cy5.5 (1:300), and extracellular with anti-HSA (1:500), anti-CD21 (1:250), and anti-CD19 (1:100) in 100 μl perm-wash buffer/1x106 cells for 20 minutes. Wash with 1ml perm-wash, and spin at 1700
rpm for 4 minutes.
11) Resuspend cells in 100μL FACS + 100 ml Fix.
12) Acquire data on FACS machine.
** 9-10) Alternatively, anti-PIP2-FITC (1:300) can be used to study PIP2 levels in total B cells (for subset identification,
use in combination with HSA-PE (1:500), CD19-PerCP-Cy5.5 (1:200), and CD21-APC (1:400); all from BD)
DAG quantification by TLC
1) Resuspend purified B cells in complete RPMI, and label cells with 2.5 mCi/ml [3H]palmitic acid (Sigma) for 6 hours at
37°C, 5% CO2.
2) Spin cells at 2000 rpm for 5 minutes. 3) Remove supernatant
4) Wash cells twice with RPMI without serum
5) Resuspend cells (3x10⁶/ml) in PBS in glass tubes and warm to 37°C .
6) Incubate cells with 20 μg/ml anti-IgM F(ab’)2 for appropriate times at 37°C.
7) Stop reactions by adding 1 ml cold PBS
8) Spin the cells at 3000 rpm for 5 minutes and wash twice with PBS 9) Remove supernatant
10) Extract lipids with 2 ml of a mixture of cold chloroform:methanol (2:1, v:v) 11) Place the samples at 4 °C overnight
12) Add 400 μl HCl (0.5N) to the 2 ml sample 13) Vortex tubes for 10 seconds
14) Spin at 3000 rpm for 5 minutes at 4°C
15) Take 10 μl of the upper phase and count the radioactivity in scintillation counter to ensure that after washing the cells no radioactivity remains in the aqueous phase. Presence of radioactivity in the aqueous phase will indicate poor lipid labelling and the experiment should be discarded.
16) Remove the upper phase
17) Transfer 1 ml of the organic phase to a new glass tube
18) Remove 10 μl of the organic phase and count the radioactivity in scintillation counter
19) Add 40 μl of cold carrier lipids (mixture of phosphatidic acid, monoglycerides, 1-2 dipalmitin, palmitic acid, tripalmitin, each at 10 mg/ml; Sigma)
20) Evaporate the organic phase gently under an N2 stream
21) Resuspend the residue in 40 μl chloroform-methanol (2:1, v:v) 22) Load on a 20x20 cm Silica Gel plate (Merck)
23) Separate neutral lipids from the other lipids in the upper phase with a mixture of ethylacetate:isooctane:acetic acid:water (130:20:30:100)
24) Allow the TLC to run half-way on the plate (25-30 minutes) in the first dimension 25) Dry the plate gently with a hair dryer for 10 minutes
26) Further separate the neutral lipids with a mixture of isopropylether:acetic acid (96:4, v:v) in the second dimension 27) Dry the plates gently with a hair dryer for 10 minutes
28) Spray the plates with primulin (in acetone-water 8:2, v:v)
29) Using the carrier lipids as markers, identify the lipid species, and scrape the desired lipids (in silica) into scintillation vials 30) Add 150 μl of water and 3 ml of scintillation fluid
31) Vortex each tube for 20 seconds 32) Count radioactivity
IP3 quantification by HPLC
Soluble Inositol Polyphosphate (IP) Extraction
1) Incubate MACS-enriched total B cells or FACS-purified B cell subsets (10x106/ml) in inositol-free DMEM containing 60
mCi [3H]Inositol/ml (Perkin Elmer) for 4 hours.
2) Harvest cells, wash twice with 1 ml PBS and suspended in PBS (10x106/ml) in a glass tube.
3) Dispense 100 μl aliquots (1x10⁶ cells) in 2.0 ml screw-cap polypropylene tubes.
4) Warm cells to 37°C for 5 min. Treat cells with 25 μl PBS with or without 20 μg/ml goat anti-mouse IgM F(ab’)2 for
desired time.
6) Extract soluble IPs by adding 465 μl of chloroform/methanol (1:2 v/v). Vortex the mixture at maximum speed for 2 minutes.
7) Add 156 μl each of chloroform and 2 M KCl and vortex for another 2 minutes.
8) Spin the lysate at 13,000 g for 5 minutes and the collect the supernatant in a screw-cap tube. Store at -20°C if needed.
Separation of IPs through HPLC
Analyze the samples by the HPLC (Shimadzu Corporation) connected to the Radio-HPLC Detector (IN/US Systems, Inc.).
Sample preparation: Add ammonium phosphate (pH 3.5) to the supernatant (10 mM final). Filter through an Amicon Ultrafree-MC 0.45 mm filter unit (Millipore).
HPLC: Inject sample (500 ml) onto a Whatman partisphere SAX strong-anion exchange column (4.6 x 125 mm). Resolve the IPs by a linear gradient from 10 mM to 1.7 M ammonium phosphate (pH 3.5) for 25 minutes, followed by elution with 1.7 M ammonium phosphate for 20 minutes. For detection by an online Radio-HPLC detector, use Tru-Count (IN/US System) scintillation counting solution in 1:1 ratio.
Calcium mobilization by FCM
Materials needed:
HBSS w/o phenol red (containing 10% FCS, 1mM Mg++, with/without 1mM Ca++)
Indo-1-AM (Molecular probes I-1223), resuspended at 1 mg/ml in DMSO Anti-HSA-PE antibody (BD clone M1/69)
Anti-CD23-biotinylated antibody (BD clone B3B4) AA4.1-APC (e-bioscience 17-5892)
Non-indo-labeled cells to use for single stain controls for FCM
1) Rest MACS-enriched B cells on ice in complete RPMI for 1-2hrs
2) Wash cells, resuspend (10x106 cells/ml) in warm HBSS (without calcium), and load with indo-1-AM (5μg/ml) for 30
minutes in a humidified 37°C incubator. 3) Wash cells twice with HBSS
4) Suspend cells (20x106 cells/ml) in FACS, and place on ice (reserve a small aliquot of indo-labeled cells to serve as the
indo-1 single stain control for FCM)
5) Label remaining cells with biotinylated-CD23 (1:200 dilution) for 20 minutes (label single stain control cells as well) 6) Wash cells, and suspend (20x106 cells/ml) in FACS
7) Label cells with HSA-PE (1:750 dilution), SAv-PerCP-Cy5.5 (1:200 dilution), and AA4-APC (1:100 dilution) for 20 minutes (label single stain control cells as well)
8) Wash cells, and suspend (1x10⁶ cells/ml) in HBSS (with calcium)
9) Keep on ice until assay
10) Warm cells for 15 minutes in a 37°C water bath prior to assay 11) Compensate the flow cytometer with single stain control cells
12) Load sample onto flow cytometer set to measure the ratio of Indo-1-violet/Indo-1-blue 13) Take baseline (non-stimulated) measurement for 30-90 seconds
14) Stimulate cells, and measure calcium ratio for 4-10 minutes
** To monitor calcium efflux from the ER without influx of extracellular calcium, use calcium-free HBSS when acquiring. Calcium can be added back in to monitor calcium influx.